Chuyển đến nội dung
  • Trang chủ
  • Dịch vụ
    • Zero2Hero Khoá học AI
    • Code theo yêu cầu
  • Sản phẩm
    • Chỉ báo C2T
    • Chiến lược C2T
  • Công cụ
    • Combine Indicator – Gộp chỉ báo
    • Signal Spy – Chim lợn
    • Trading Journal – Nhật ký
    • Strategy Tester – Test chiến lược
    • Tradingview 2 Telegram
  • Blog
    • Phân tích chỉ báo
    • Signal Spy
    • Nhật ký giao dịch
    • Góc nhìn vĩ mô
    • Tắt Chart! – Tâm lý trading
    • Thủ thuật phần mềm
    • Kiểm chứng lý thuyết
  • Liên hệ
  • English
  • Tiếng Việt
  • Trang chủ
  • Dịch vụ
    • Zero2Hero Khoá học AI
    • Code theo yêu cầu
  • Sản phẩm
    • Chỉ báo C2T
    • Chiến lược C2T
  • Công cụ
    • Combine Indicator – Gộp chỉ báo
    • Signal Spy – Chim lợn
    • Trading Journal – Nhật ký
    • Strategy Tester – Test chiến lược
    • Tradingview 2 Telegram
  • Blog
    • Phân tích chỉ báo
    • Signal Spy
    • Nhật ký giao dịch
    • Góc nhìn vĩ mô
    • Tắt Chart! – Tâm lý trading
    • Thủ thuật phần mềm
    • Kiểm chứng lý thuyết
  • Liên hệ
  • English
  • Tiếng Việt
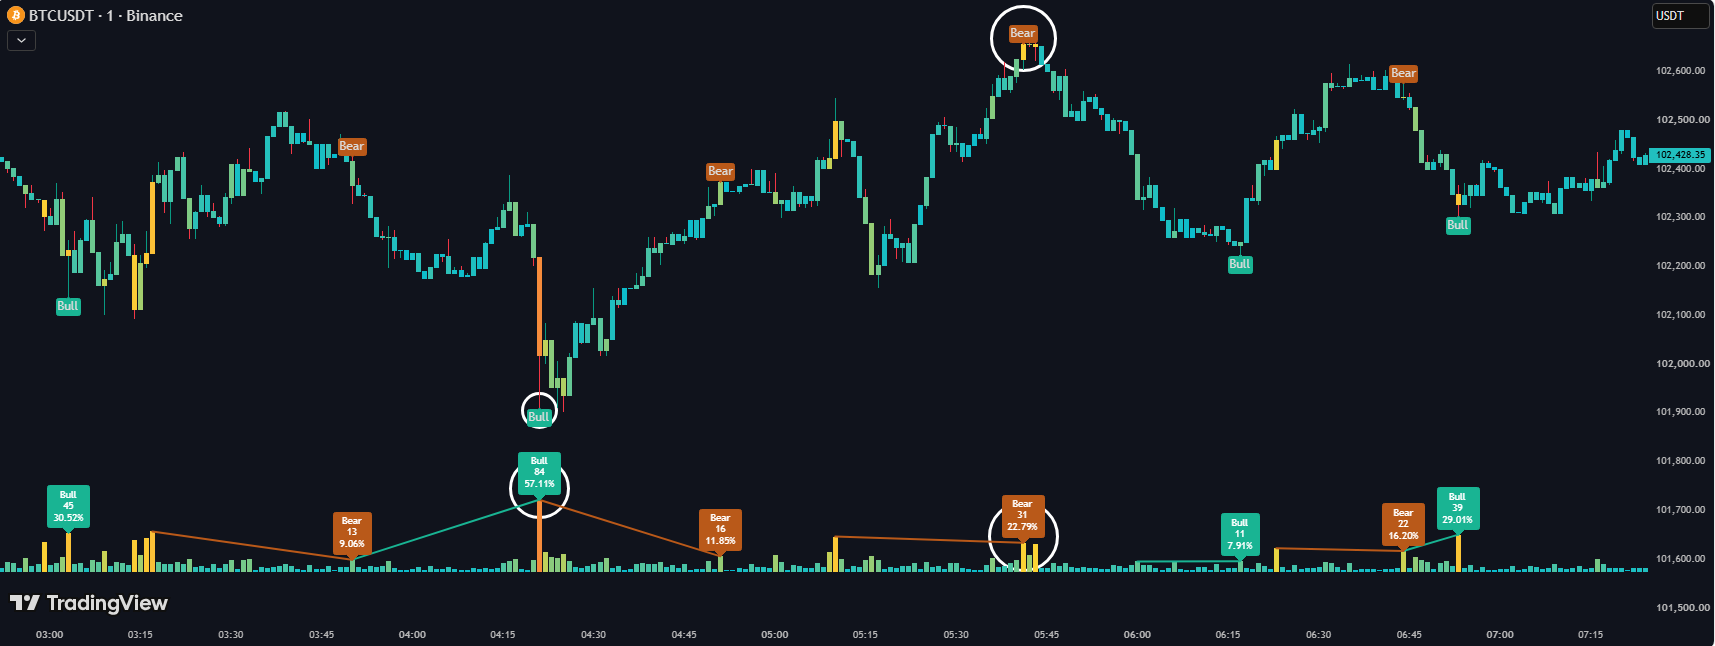
Chỉ báo Volume HeatMap Divergence trên chart TradingView (ảnh 1)

Chỉ Báo Volume HeatMap Divergence – Strategy

Chỉ báo Volume HeatMap Divergence: Vẽ khối lượng dưới dạng “heatmap” tô màu theo phân vị ngay trên biểu đồ giá. Cách hoạt động, cài đặt và logic chiến lược.
Read More »
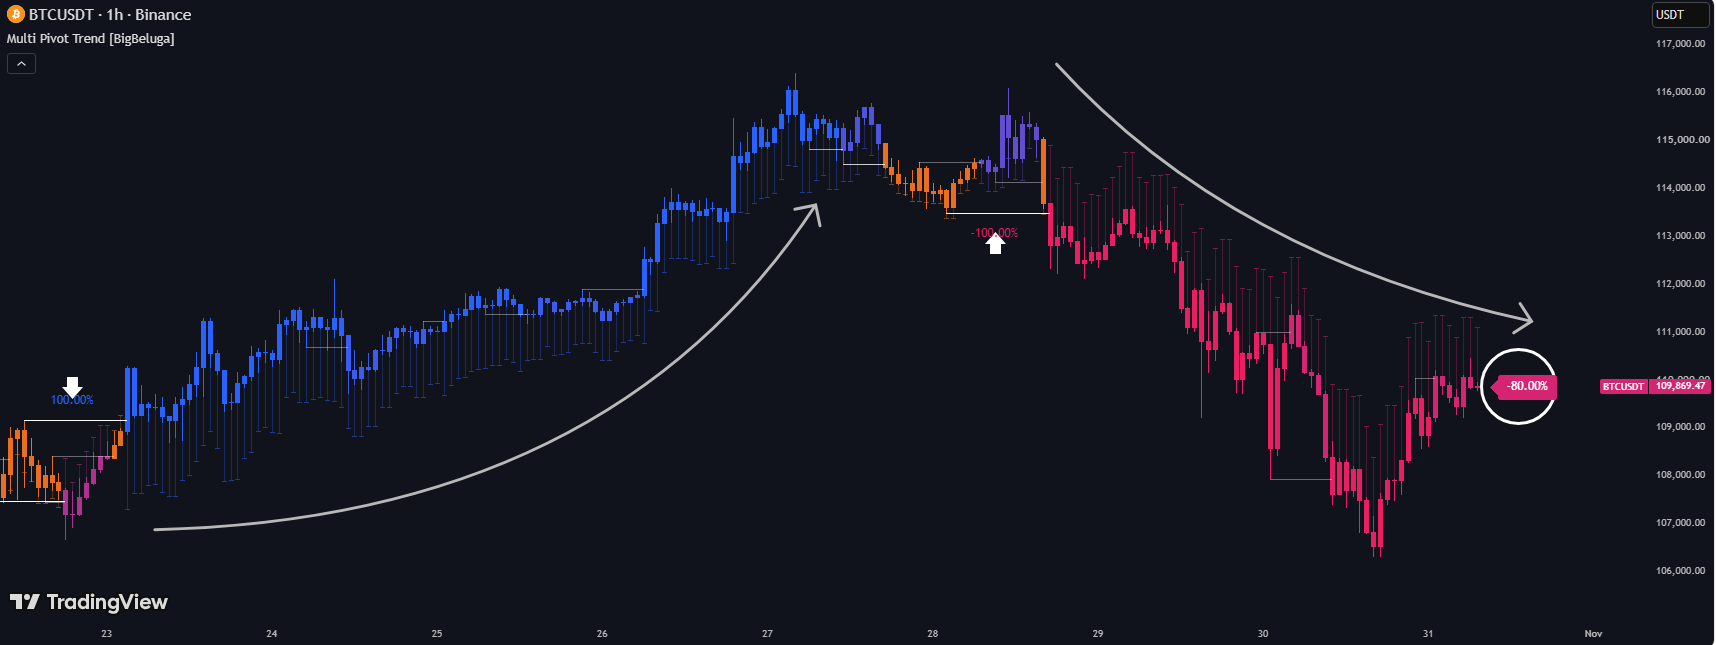
Chỉ báo Multi Pivot Trend trên chart TradingView (ảnh 2)

Chỉ Báo Multi Pivot Trend – Strategy

Chỉ báo Multi Pivot Trend: Chỉ báo chạy song song 10 bộ phát hiện breakout độc lập với 10 độ dài pivot khác nhau. Cách hoạt động, cài đặt và logic chiến lược.
Read More »
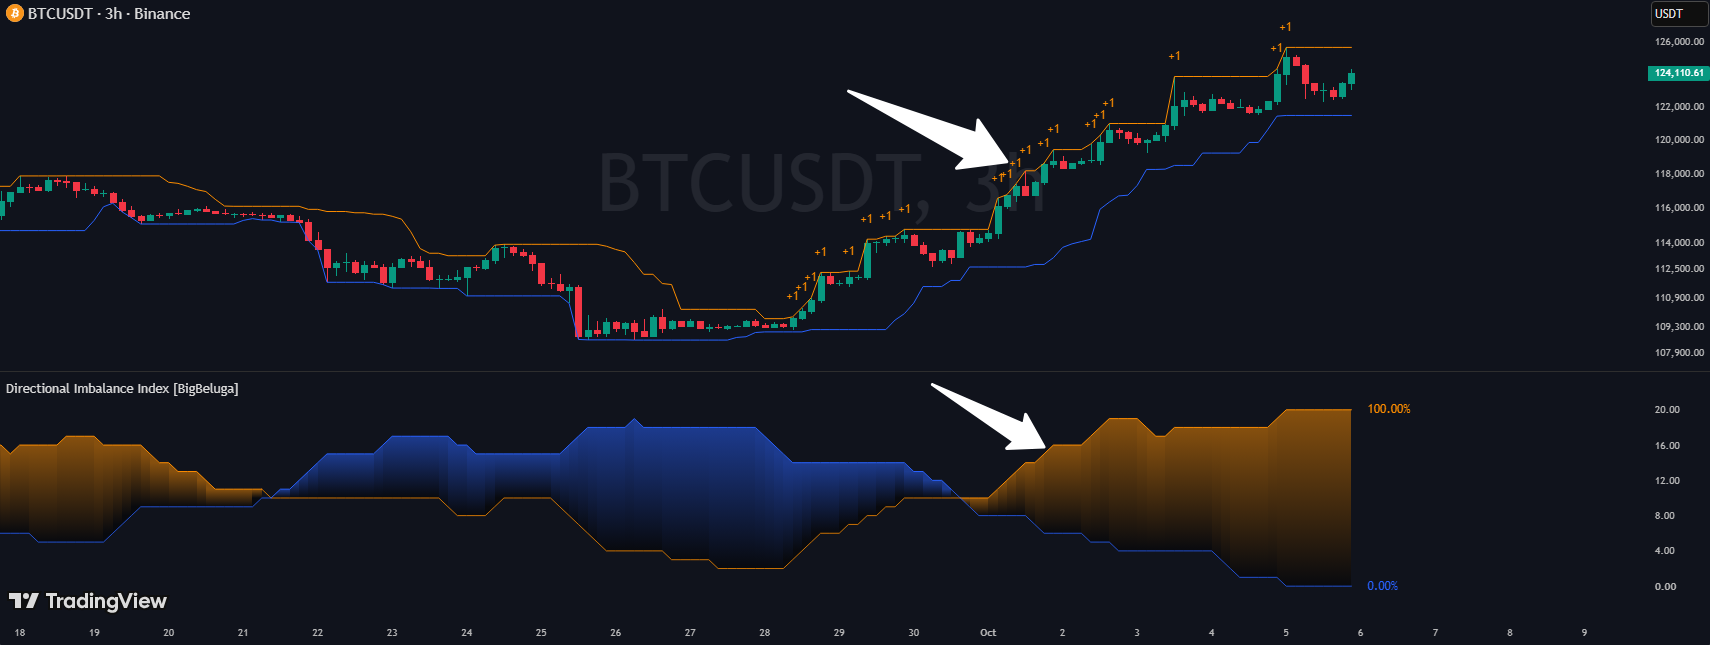
Chỉ báo Directional Imbalance Index trên chart TradingView (ảnh 3)

Chỉ Báo Directional Imbalance Index – Strategy

Chỉ báo Directional Imbalance Index: mếm số lần giá tạo đỉnh cao nhất / đáy thấp nhất trong một cửa sổ trượt. Cách hoạt động, cài đặt và logic chiến lược.
Read More »
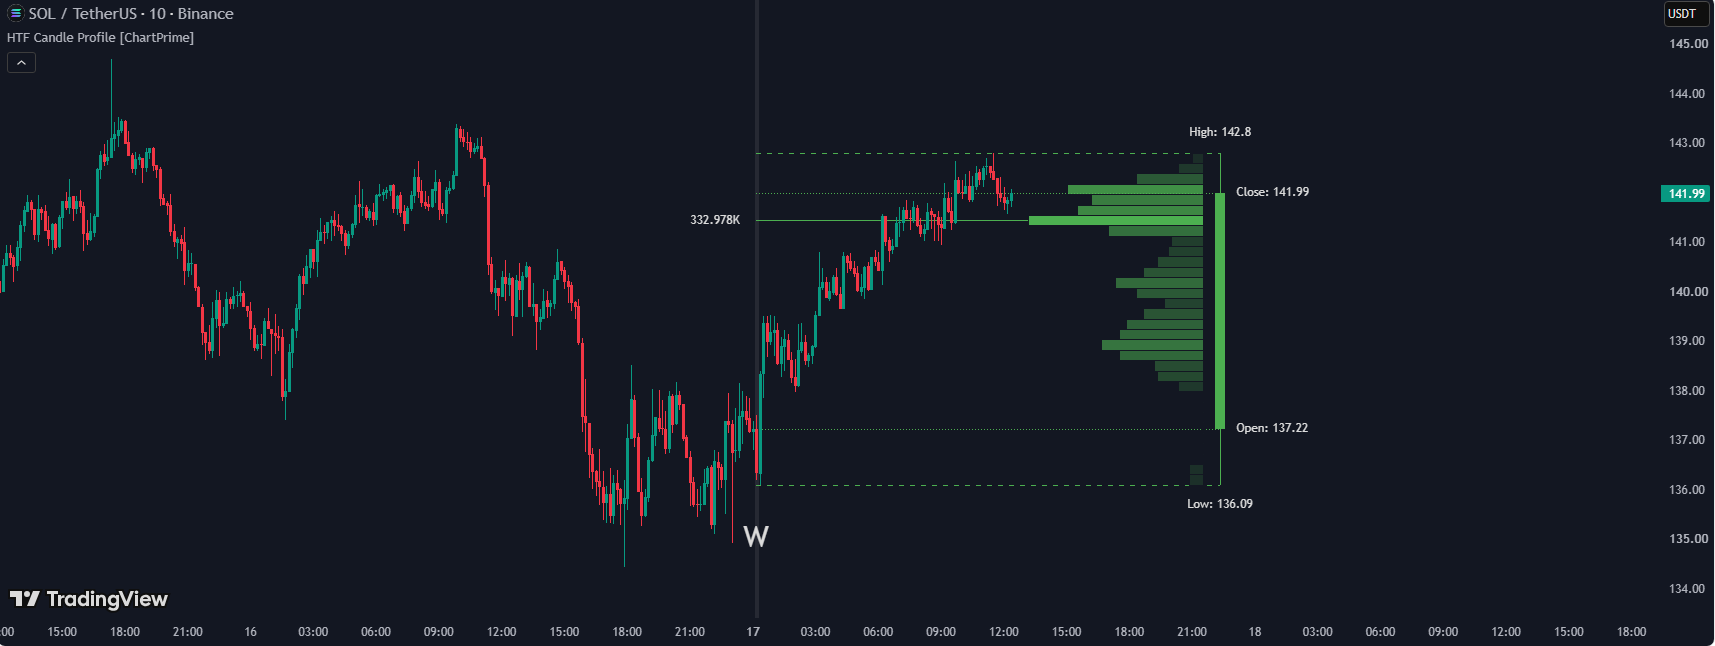
Chỉ báo HTF Candle Profile trên chart TradingView (ảnh 1)

Chỉ Báo HTF Candle Profile – Strategy

Chỉ báo HTF Candle Profile: Chỉ báo dựng biểu đồ Volume Profile cho đúng 1 nến khung thời gian lớn đang hình thành. Cách hoạt động, cài đặt và logic chiến lược.
Read More »
Chỉ báo Bollinger Bands Regression Forecast trên chart TradingView (ảnh 1)

Chỉ Báo Bollinger Bands Regression Forecast – Strategy

Chỉ báo Bollinger Bands Regression Forecast: Bollinger Bands truyền thống kết hợp thêm 1 “cái phễu” dự phóng. Cách hoạt động, cài đặt và logic chiến lược.

Read More »
Chỉ báo Bollinger Bands Regression Forecast trên chart TradingView (ảnh 1)

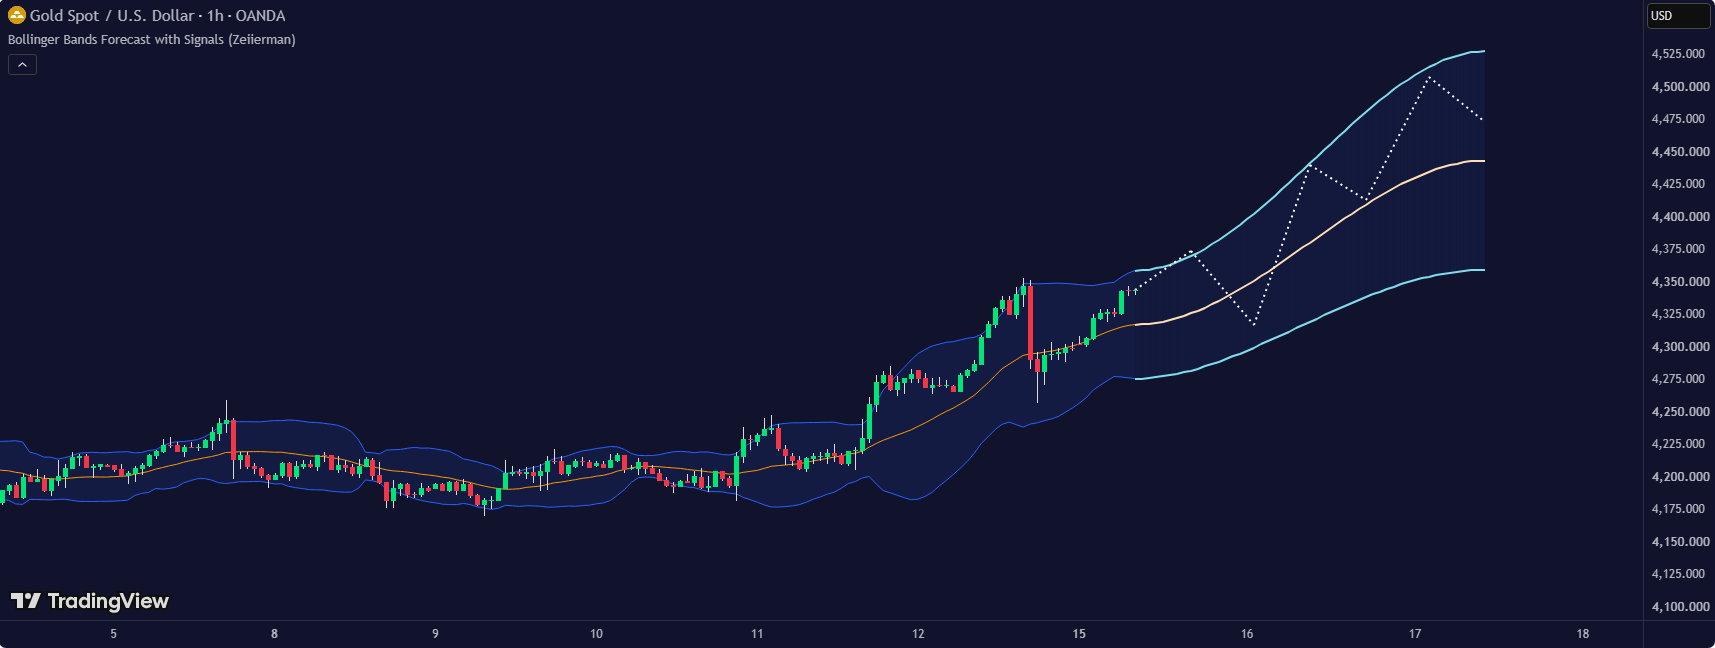
Chỉ Báo Bollinger Bands Forecast with Signals – Bollinger Bands Regression Forecast Strategy

Chỉ báo Bollinger Bands Forecast with Signals: Bollinger Bands tiêu chuẩn cộng thêm một “hình nón dự báo” ngoại suy về phía tương lai.
Read More »
Chỉ báo Swing Failure Signals trên chart TradingView (ảnh 1)

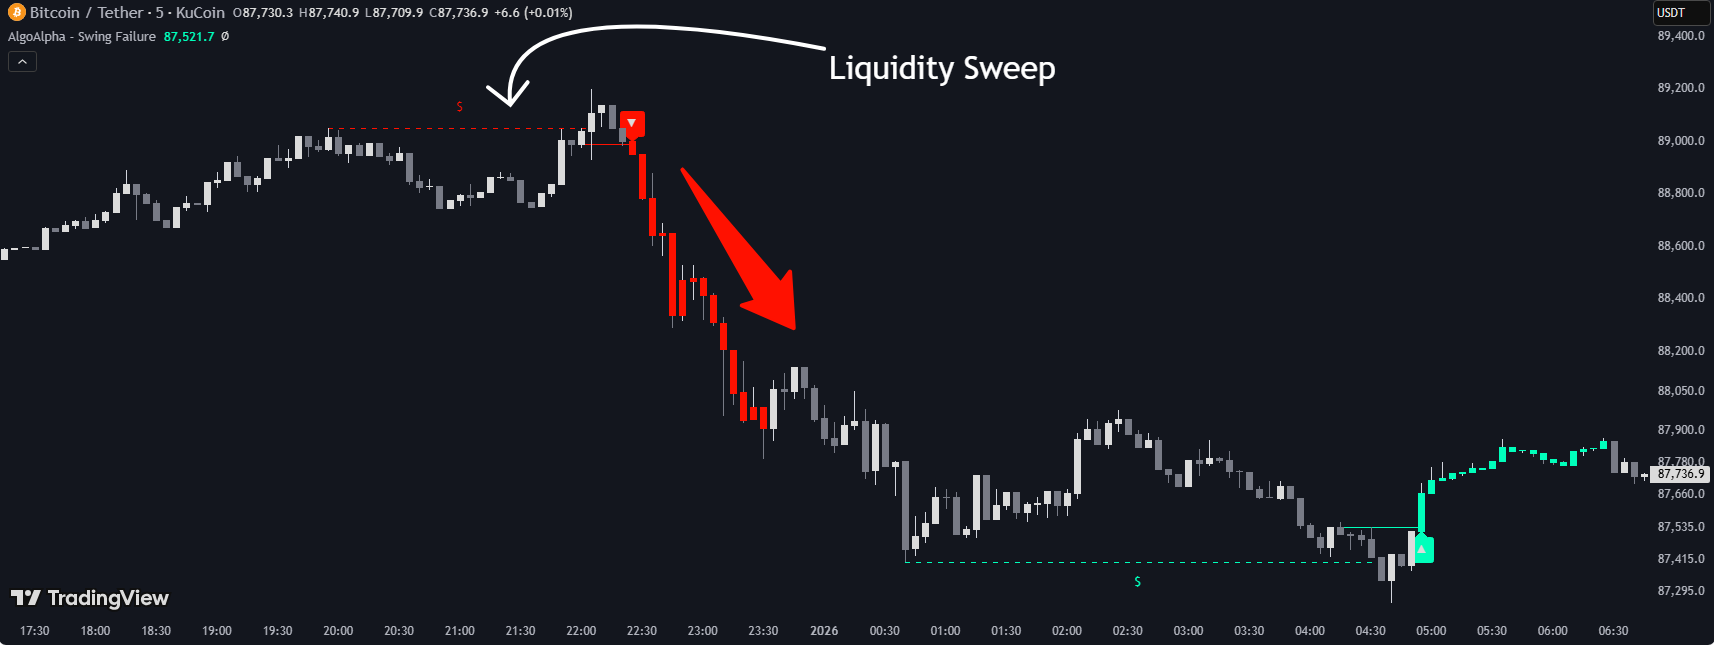
Chỉ Báo Swing Failure Signals – Swing Failure Signals Strategy

Chỉ báo Swing Failure Signals: Chỉ báo phát hiện mẫu hình Swing Failure Pattern — giá quét qua 1 đỉnh/đáy xoay chiều. Cách hoạt động và cài đặt.
Read More »
Chỉ báo Volumetric Order Flow Structure trên chart TradingView (ảnh 1)

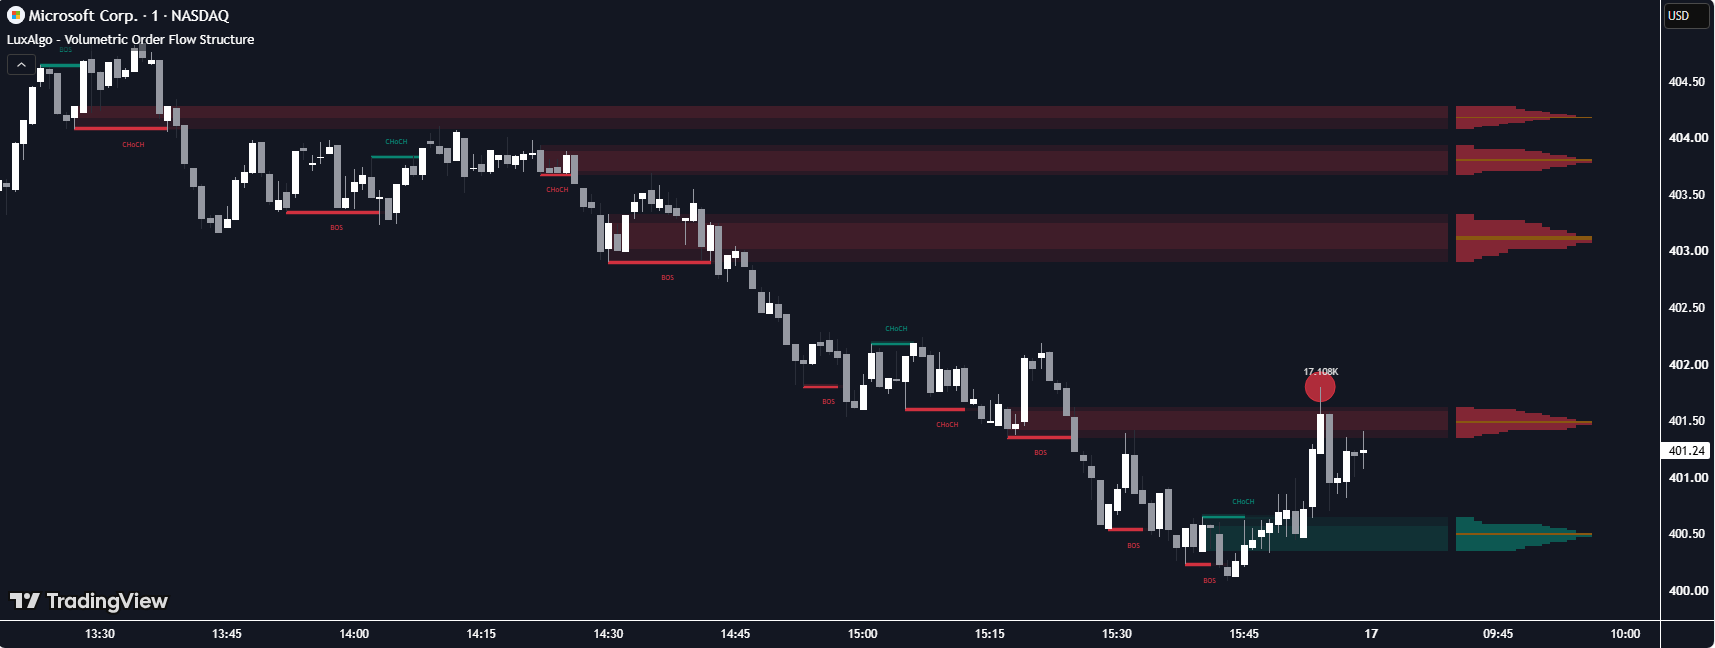
Chỉ Báo Volumetric Order Flow Structure – Volumetric Order Flow Structure Strategy

Chỉ báo Volumetric Order Flow Structure: phát hiện phá vỡ cấu trúc thị trường qua pivot. Cách hoạt động, cài đặt và logic chiến lược.
Read More »
Chỉ báo Dynamic Delta FVG trên chart TradingView (ảnh 1)

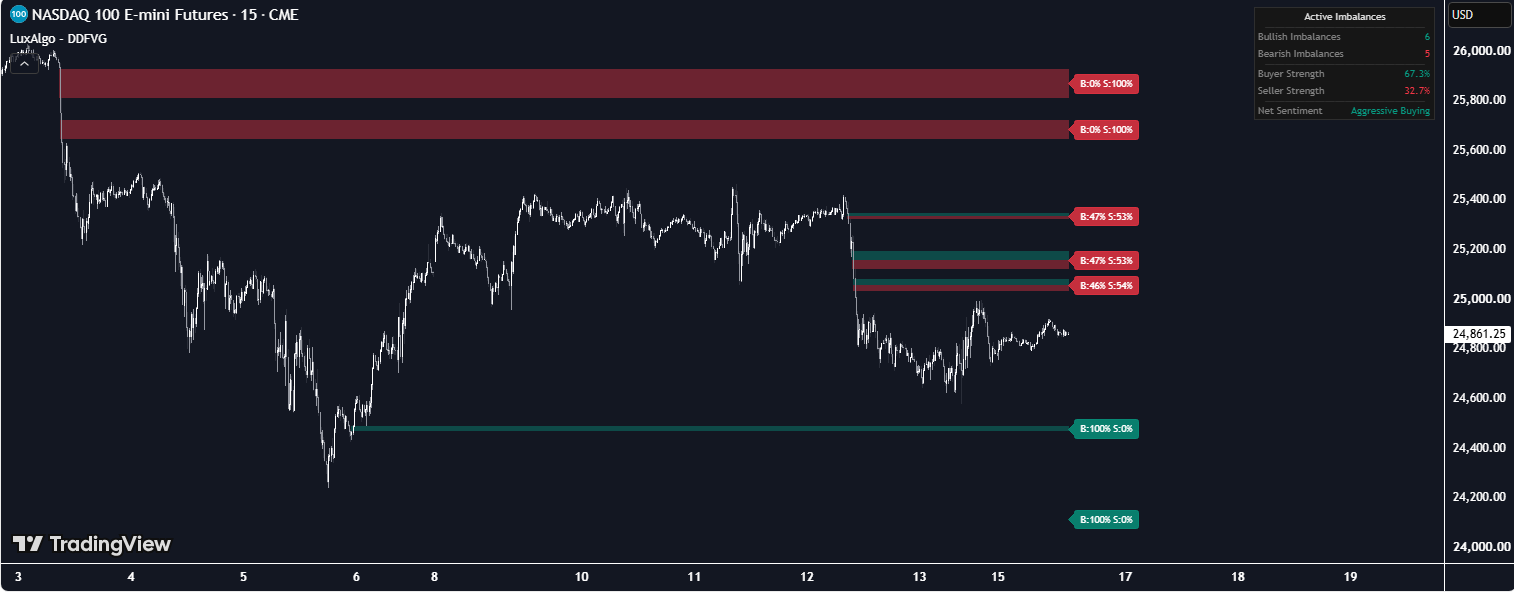
Chỉ Báo Dynamic Delta FVG – Dynamic Delta FVG Strategy

Chỉ báo Dynamic Delta FVG: phát hiện Fair Value Gap 3 nến kinh điển. Cách hoạt động, cài đặt và logic chiến lược.
Read More »
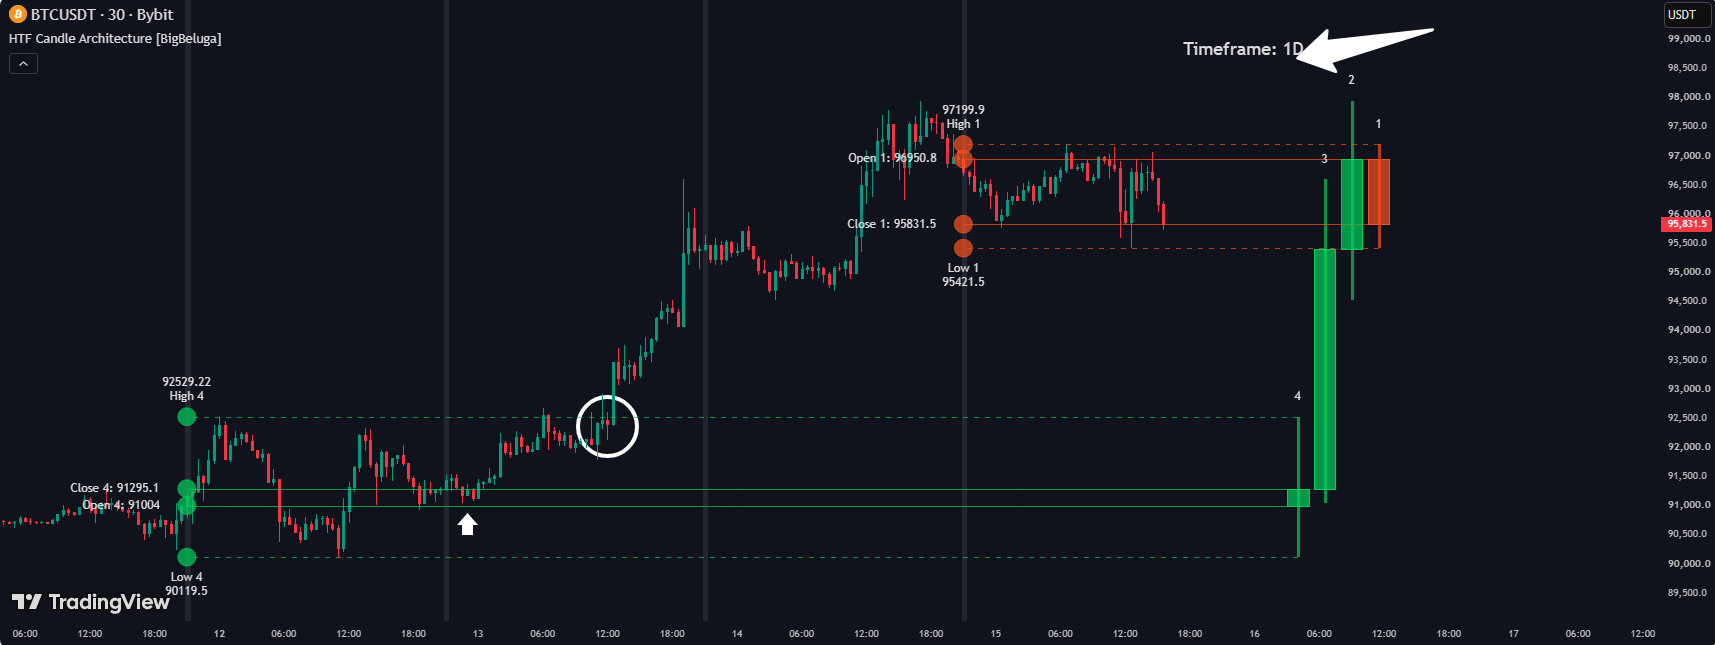
Chỉ báo HTF Candle Architecture trên chart TradingView (ảnh 1)

Chỉ Báo HTF Candle Architecture – HTF Candle Architecture Strategy

Chỉ báo HTF Candle Architecture: Chỉ báo dựng lại tối đa 4 cây nến khung thời gian lớn gần nhất thành mini-candle vẽ ở rìa phải chart.

Read More »
Trang1 Trang2 Trang3 Trang4 Trang5

Code 2 Trade

Facebook Twitter Youtube
Disclaimers

Risk Disclosure: Futures and forex trading contains substantial risk and is not for every investor. An investor could potentially lose all or more than the initial investment. Risk capital is money that can be lost without jeopardizing ones’ financial security or lifestyle. Only risk capital should be used for trading and only those with sufficient risk capital should consider trading. Past performance is not necessarily indicative of future results.


Hypothetical Performance Disclosure: Hypothetical performance results have many inherent limitations, some of which are described below. No representation is being made that any account will or is likely to achieve profits or losses similar to those shown; in fact, there are frequently sharp differences between hypothetical performance results and the actual results subsequently achieved by any particular trading program. One of the limitations of hypothetical performance results is that they are generally prepared with the benefit of hindsight. In addition, hypothetical trading does not involve financial risk, and no hypothetical trading record can completely account for the impact of financial risk of actual trading. for example, the ability to withstand losses or to adhere to a particular trading program in spite of trading losses are material points which can also adversely affect actual trading results. There are numerous other factors related to the markets in general or to the implementation of any specific trading program which cannot be fully accounted for in the preparation of hypothetical performance results and all which can adversely affect trading results.

Live Trade Room Disclosure:  This presentation is for educational purposes only and the opinions expressed are those of the presenter only. All trades presented should be considered hypothetical and should not be expected to be replicated in a live trading account. 


Testimonial Disclosure: Testimonials appearing on this website may not be representative of other clients or customers and is not a guarantee of future performance or success.