1. Scalper Pro Indicator Description
A multi-timeframe trading tool combining Smart Money analysis with classic technicals
1.1 Indicator Concept
Scalper Pro is built on 3 core principles of market trading:
- Sustained trend principle: Markets tend to trend more often than they range. Once a trend forms, it’s more likely to continue than to reverse immediately.
- Smart Money Theory: Large institutions (banks, funds) leave “footprints” on charts via large order zones, inefficient price gaps, and liquidity pools. Retail traders can follow these footprints to align with institutional flow.
- Volatility-based risk management: Stop-loss and take-profit distances should adapt to current market volatility. Higher volatility → wider distances; quieter markets → tighter distances.
What’s special: Rather than a simple bundle of separate indicators, Scalper Pro forms a multi-layer confirmation system. Signals only fire when several components align in the same direction, significantly reducing false signals—the #1 problem in scalping.
Each component covers another’s weakness: SuperTrend defines trend but struggles in ranges → Range Filter reduces noise and confirms → ADX blocks trades in unclear markets → SMC highlights institutional zones → ATR adjusts risk to volatility.
1.2 Indicator Features
A. On-chart components:
- SuperTrend line (green/red): Trails price; green in uptrend, red in downtrend. Primary cue for trade direction.
- Cirrus Cloud (noise-filter cloud): Filled zone between two filters—green in strong uptrends, red in strong downtrends. Expands when trend is clear, contracts when market is choppy.
- Price Bar Color: Bars turn purple when the market is ranging (avoid trading); normal color when trend is clear.
- Order Blocks: Colored boxes marking institutional order zones. Price often reacts strongly when revisiting these areas.
- Fair Value Gaps (FVG): Boxes highlighting imbalances created by fast moves. Price tends to revisit to “fill” these gaps.
- Break of Structure (BOS) & Change of Character (CHoCH): Labels marking breaks of key highs/lows, signaling continuation (BOS) or potential reversal (CHoCH).
- Equal Highs/Lows (EQH/EQL): Marks clusters of near-equal highs/lows—common stop pools likely to be swept before reversal.
- Hull Moving Average Cloud (higher-timeframe trend): Smooth MA helping define broader trend context.
- Premium/Discount/Equilibrium Zones: Horizontal regions dividing price into premium (sell-side), discount (buy-side), and equilibrium.
- Stop Loss & Take Profit labels: Auto-display SL and TP levels (TP1/TP2/TP3) calculated via ATR.
B. Alerts:
- Buy Signal alert: SuperTrend flips green with required confirmations.
- Sell Signal alert: SuperTrend flips red with required confirmations.
- Order Block formed alert: New institutional block detected.
- Fair Value Gap alert: New imbalance detected.
- Structure break alert: BOS or CHoCH appears.
1.3 How to Use the Indicator
A. Long setup (BUY):
- Step 1: Wait for SuperTrend to flip from red to green (price crosses above SuperTrend).
- Step 2: Ensure price bars are NOT purple (market is trending, not ranging).
- Step 3: Confirm Cirrus Cloud is green (both filters agree up).
- Step 4 (boost): Price is in/near a Bullish Order Block (green box) or Bullish FVG.
- Step 5 (boost): A bullish BOS (break of prior high) just occurred, or price just swept an EQL (equal lows).
B. Short setup (SELL):
- Step 1: Wait for SuperTrend to flip from green to red (price crosses below).
- Step 2: Ensure price bars are NOT purple.
- Step 3: Confirm Cirrus Cloud is red.
- Step 4 (boost): Price is in/near a Bearish Order Block (red box) or Bearish FVG.
- Step 5 (boost): A bearish BOS (break of prior low) just occurred, or price just swept an EQH (equal highs).
C. Trade management & take-profits:
- Set Stop Loss: Use the auto SL label (ATR-based).
- Scale out:
- Close 1/3 at TP1 (1:1 R:R).
- Move SL to breakeven.
- Close 1/3 at TP2 (1:2).
- Let final 1/3 run to TP3 (1:3) or trail.
D. Suitable timeframes:
- Scalping (1–5 min): Fast entries/exits; focus on TP1 & TP2.
- Day Trading (15 min – 1 hr): Hold longer; can target TP3.
- Swing Trading (4 hr – Daily): Emphasize larger structures (Swing BOS); wider SL/TP.
E. When NOT to trade:
- Bars are purple (low ADX—ranging market).
- Multiple conflicting signals across timeframes.
- Before/during major news events (rates, NFP, GDP…).
- Price at equilibrium—no clear bias.
- SuperTrend flip-flopping rapidly (whipsaw).
Entry: 1.0510
Stop Loss (ATR-based): 1.0490 (-20 pips)
TP1: 1.0530 (+20 pips – 1:1)
TP2: 1.0550 (+40 pips – 1:2)
TP3: 1.0570 (+60 pips – 1:3)
1.4 How the Indicator Works
A. Inputs and role in the concept
- Close Price: Primary reference for all calculations; reflects the market’s final decision each bar.
- High/Low: Used for True Range and to identify structural swing highs/lows.
- ATR Period (default 10–14): Number of bars for Average True Range—measures average volatility. Shorter = more sensitive.
- SuperTrend Factor (default 7): Distance of SuperTrend from price. Higher = farther (fewer flips but later entries).
- Range Filter periods (default 22 and 15): Bar counts for the two noise-filter layers that form the Cirrus Cloud.
- ADX Threshold (default 15): Separates trending vs non-trending markets. ADX < 15 = weak/ranging.
- Swing Length (default 5–10): Bars before/after to confirm a swing high/low.
- Risk % (default 3%): Percentage used with ATR to size SL/TP distances.
B. Main logic blocks and roles
📊 BLOCK 1: SuperTrend calculation
- Formula:
- ATR = Average True Range
- Upper Band = Price + (Factor × ATR)
- Lower Band = Price - (Factor × ATR)
- Logic: Price crossing above Lower Band → uptrend (green). Crossing below Upper Band → downtrend (red).
- Role: Defines the main trend and gives preliminary buy/sell cues—the system’s backbone.
📊 BLOCK 2: Range Filter (Cirrus Cloud)
- Formula:
- WPER = (Period × 2) − 1 (smoothing window)
- AVRNG = EMA of |Current Price − Previous Price|
- Smooth Range = EMA(AVRNG, WPER) × Multiplier
- Logic: Build two filters with different periods (Layer 1: 22 × 6, Layer 2: 15 × 5). Layer 1 > Layer 2 → uptrend; Layer 1 < Layer 2 → downtrend.
- Role: Removes short-term noise and confirms SuperTrend. Wider cloud = stronger trend; narrower = weaker.
📊 BLOCK 3: ADX (trend strength)
- Formula:
- +DM = Up move (today’s High − yesterday’s High if positive)
- −DM = Down move (yesterday’s Low − today’s Low if positive)
- +DI = 100 × RMA(+DM, 15) / True Range
- −DI = 100 × RMA(−DM, 15) / True Range
- ADX = 100 × RMA(|+DI − −DI| / (+DI + −DI), 15)
- Logic: ADX measures trend strength (direction-agnostic). If ADX < threshold (15) → weak/ranging → bars colored purple.
- Role: Prevents trading in unfavorable (whipsaw) conditions.
📊 BLOCK 4: Order Block detection
- Logic:
- Detect swing highs/lows using configurable pivot length.
- Bullish OB: Last red candle BEFORE a bullish structure break (bullish BOS).
- Bearish OB: Last green candle BEFORE a bearish structure break (bearish BOS).
- Role: Marks zones where institutions placed orders. Price often retests these before continuing.
📊 BLOCK 5: Fair Value Gap detection
- Logic:
- Bullish FVG: Current Low > High from two bars ago.
- Bearish FVG: Current High < Low from two bars ago.
- Filter by minimum delta to keep meaningful gaps.
- Role: Gaps tend to be filled on revisits; used for entries or targets.
📊 BLOCK 6: BOS & CHoCH detection
- Logic:
- BOS: Breaks prior high/low IN the direction of the current trend (continuation).
- CHoCH: Breaks prior high/low AGAINST the current trend (reversal warning).
- Track both Internal (minor) and Swing (major) structures.
- Role: Confirms trend strength and flags early reversal risk.
📊 BLOCK 7: Equal Highs/Lows
- Logic: Multiple highs/lows clustering within an ATR-based threshold.
- Role: Typical stop-loss liquidity zones; often swept before sharp reversals.
📊 BLOCK 8: Stop Loss & Take Profit calculations
- Formula:
- ATR Band = ATR(14) × Risk% (default 3%)
- Stop Loss = Entry − ATR Band (long) or + ATR Band (short)
- R distance = |Entry − SL|
- TP1 = Entry + 1R
- TP2 = Entry + 2R
- TP3 = Entry + 3R
- Role: Auto-sizes SL/TP to current volatility, making risk management objective.
C. Outputs and role in usage
- SuperTrend (green/red): Shows primary trend → trader knows to buy or sell.
- Cirrus Cloud (green/red fill): Confirms trend strength → adds confidence.
- Purple bars: Warn of weak market → avoid trades to reduce whipsaw.
- Order Block boxes: Mark key zones → set pendings or watch reactions.
- FVG boxes: Likely retest areas → use as targets or entries.
- BOS/CHoCH labels: Confirm/flag trend shifts → adjust strategy.
- EQH/EQL labels: Show liquidity pools → wait for sweep before fading.
- SL/TP1/TP2/TP3 labels: Concrete levels → place orders precisely without manual math.
Inputs:
• Price: 1.0500 → 1.0520 → 1.0515• ATR(14) = 0.0015 (15 pips)
• Factor = 7
• ADX = 22 (> 15 → trending)
Processing:
1️⃣ SuperTrend block:• Lower Band = 1.0515 − (7 × 0.0015) = 1.0410
• Price 1.0515 > Lower Band 1.0410 → SuperTrend turns GREEN
2️⃣ Range Filter block:
• Layer 1 at 1.0480, Layer 2 at 1.0470
• Layer 1 > Layer 2 → Cirrus Cloud GREEN (up confirmed)
3️⃣ ADX block:
• ADX = 22 > 15 → trending → bars NOT purple
4️⃣ Order Block block:
• Last red candle at 1.0505–1.0508 before BOS
• Draw Bullish OB box there
5️⃣ BOS block:
• 1.0520 breaks prior high 1.0515 → bullish BOS → label it
6️⃣ SL/TP block:
• Entry: 1.0515
• ATR Band = 0.0015 × 3% ≈ 20 pips
• SL = 1.0515 − 20 = 1.0495
• TP1 = 1.0515 + 20 = 1.0535
• TP2 = 1.0515 + 40 = 1.0555
• TP3 = 1.0515 + 60 = 1.0575
Displayed outputs:
✅ SuperTrend green✅ Cirrus Cloud green
✅ Bars normal (not purple)
✅ Bullish OB at 1.0505–1.0508
✅ BOS label at 1.0520
✅ SL: 1.0495, TP1: 1.0535, TP2: 1.0555, TP3: 1.0575
→ Trader receives a high-probability BUY with full SL/TP context!
Inputs (price & settings) → independent logic blocks → multi-layer confirmation → signal & levels (outputs) → trader makes decisions from a complete system.


Use the analysis above + the code below to instruct AI to modify the indicator and turn it into a trading bot—no coding required!
How to do it here -> 👉ZERO2HERO👈
//@version=5

indicator("Trader DrFXAi", "👑Scalper Pro®👑Pattern Recognition & Price Action"


  , overlay = true
  , max_labels_count = 500
  , max_lines_count = 500
  , max_boxes_count = 500
  , max_bars_back = 500)


//INICIA MODULO SUPERTREND
// Get user input
//INICIA MODULO SUPERTREND
// Get user input


// Instead of inputs, define constants or variables directly
// Instead of inputs, define constants or variables directly

var float nsensitivity = 1


nbuysell   = input.bool(true, 'Buy/Sell Signal', inline = "BSNM",group='BUY/SELL SIGNAL')


// SMA
sma4_strong        = ta.sma(close, 8)
sma5_strong          = ta.sma(close, 9)

// Signal Generation
// Signal Generation Function
supertrend(_src, factor, atrLen) =>
    atr = ta.atr(atrLen)
    upperBand = _src + factor * atr
    lowerBand = _src - factor * atr
    prevLowerBand = nz(lowerBand[1])
    prevUpperBand = nz(upperBand[1])
    lowerBand := lowerBand > prevLowerBand or close[1] < prevLowerBand ? lowerBand : prevLowerBand
    upperBand := upperBand < prevUpperBand or close[1] > prevUpperBand ? upperBand : prevUpperBand
    var int direction = na
    var float superTrend = na
    prevSuperTrend = nz(superTrend[1])

    if na(atr[1])
        direction := 1
    else if prevSuperTrend == prevUpperBand
        direction := close > upperBand ? -1 : 1
    else
        direction := close < lowerBand ? 1 : -1

    superTrend := direction == -1 ? lowerBand : upperBand
    [superTrend, direction]


[supertrend, direction] = supertrend(close, nsensitivity*7,10)
//señales
bull = ta.crossover(close, supertrend)
bear = ta.crossunder(close, supertrend)


//FIN MODULO SUPERTREND


// Risk Management

levels2      = input.bool(true, "Show TP/SL Levels2" , group = "Risk Management" , inline = "MMDB2")

lvlLines    = input.bool(true, "Show Lines ", inline="levels2", group = "Risk Management")
linesStyle  = input.string("SOLID", "", ["SOLID", "DASHED", "DOTTED"], inline="levels2", group = "Risk Management")
lvlDistance = input.int(40, "Distance", 1, inline="levels2", group = "Risk Management")
lvlDecimals = input.int(4, "   Decimals", 1, 8, inline="levels2", group = "Risk Management")
atrRisk     = input.int(3, "Risk % ", 1, group = "Risk Management" , inline="levels3")
atrLen      = input.int(14, "  ATR Length", 1, group = "Risk Management" , inline="levels3")
decimals  = lvlDecimals == 1 ? "#.#" : lvlDecimals == 2 ? "#.##" : lvlDecimals == 3 ? "#.###" : lvlDecimals == 4 ? "#.####" : lvlDecimals == 5 ? "#.#####" : lvlDecimals == 6 ? "#.######" : lvlDecimals == 7 ? "#.#######" : "#.########"
CirrusCloud       = input(true, 'Cirrus Cloud', group='TREND FEATURES')


// Plots

windowsize = 100
offset = 0.9
sigma = 6
//plot(ta.alma(source, windowsize, offset, sigma))


windowsize2 = 310
offset2 = 0.85
sigma2 = 32
//plot(ta.alma(source, windowsize2, offset2, sigma2))


// Chart Features

smoothrng(x, t, m) =>
    wper  = t * 2 - 1
    avrng = ta.ema(math.abs(x - x[1]), t)
    smoothrng = ta.ema(avrng, wper) * m
    smoothrng
smrng     = smoothrng(close, 22, 6)

rngfilt(x, r) =>
    rngfilt = x
    rngfilt := x > nz(rngfilt[1]) ? x - r < nz(rngfilt[1]) ? nz(rngfilt[1]) : x - r : x + r > nz(rngfilt[1]) ? nz(rngfilt[1]) : x + r
    rngfilt
filt = rngfilt(close, smrng)

// ▒▒▒▒▒▒▒▒▒▒▒▒▒▒▒▒▒▒▒▒▒▒▒▒▒▒▒▒▒▒▒▒▒▒▒▒▒▒▒▒▒▒▒▒▒▒▒▒▒▒▒▒▒▒▒▒▒▒▒▒▒▒▒▒▒▒▒▒▒▒▒▒▒▒▒▒▒▒▒▒▒▒▒▒▒▒▒▒▒▒▒▒▒▒▒▒▒▒▒▒▒▒▒▒▒▒▒▒▒▒▒▒▒▒

upward = 0.0
upward := filt > filt[1] ? nz(upward[1]) + 1 : filt < filt[1] ? 0 : nz(upward[1])
downward = 0.0
downward := filt < filt[1] ? nz(downward[1]) + 1 : filt > filt[1] ? 0 : nz(downward[1])


filtcolor = upward > 0 ? color.new(#00e2ff, 50) : downward > 0 ? color.new(#fe0100, 50) : color.new(#56328f, 0)


// Trend Cloud
tclength = 600
hullma = ta.wma(2*ta.wma(close, tclength/2)-ta.wma(close, tclength), math.floor(math.sqrt(tclength)))


// Chart Features

x1 = 22
x2 = 9

x3 = 15
x4 = 5


smoothrngX1(x, t, m) =>
    wper  = t * 2 - 1
    avrng = ta.ema(math.abs(x - x[1]), t)
    smoothrngX1 = ta.ema(avrng, wper) * m
    smoothrngX1
smrngx1x     = smoothrngX1(close, x1, x2)
smrngx1x2     = smoothrngX1(close, x3, x4)

rngfiltx1x1(x, r) =>
    rngfiltx1x1 = x
    rngfiltx1x1 := x > nz(rngfiltx1x1[1]) ? x - r < nz(rngfiltx1x1[1]) ? nz(rngfiltx1x1[1]) : x - r : x + r > nz(rngfiltx1x1[1]) ? nz(rngfiltx1x1[1]) : x + r
    rngfiltx1x1
filtx1 = rngfiltx1x1(close, smrngx1x)
filtx12 = rngfiltx1x1(close, smrngx1x2)

// ▒▒▒▒▒▒▒▒▒▒▒▒▒▒▒▒▒▒▒▒▒▒▒▒▒▒▒▒▒▒▒▒▒▒▒▒▒▒▒▒▒▒▒▒▒▒▒▒▒▒▒▒▒▒▒▒▒▒▒▒▒▒▒▒▒▒▒▒▒▒▒▒▒▒▒▒▒▒▒▒▒▒▒▒▒▒▒▒▒▒▒▒▒▒▒▒▒▒▒▒▒▒▒▒▒▒▒▒▒▒▒▒▒▒

upwardx1 = 0.0
upwardx1 := filtx1 > filtx1[1] ? nz(upwardx1[1]) + 1 : filtx1 < filtx1[1] ? 0 : nz(upwardx1[1])
downwardx1 = 0.0
downwardx1 := filtx1 < filtx1[1] ? nz(downwardx1[1]) + 1 : filtx1 > filtx1[1] ? 0 : nz(downwardx1[1])


filtx1colorx1 = color.rgb(0, 187, 212, 100)
xxx1 = plot(CirrusCloud ? filtx1 : na, color=filtx1colorx1, linewidth=1, title='Trend Tracer', editable = false)
xxx2 = plot(CirrusCloud ? filtx12 : na, color=filtx1colorx1, linewidth=1, title='Trend Tracer', editable = false)

fill(xxx1, xxx2, color= filtx1 > filtx12 ? color.rgb(254, 0, 0, 86) : color.rgb(21, 255, 0, 86))

trigger2 = bull ? 1 : 0
countBull = ta.barssince(bull)
countBear = ta.barssince(bear)
trigger   = nz(countBull, bar_index) < nz(countBear, bar_index) ? 1 : 0
atrBand = ta.atr(atrLen) * atrRisk
atrStop = trigger == 1 ? low - atrBand : high + atrBand


// Colors
green       = #2BBC4D, green2   = color.rgb(0, 221, 0, 27)
red         = #C51D0B, red2     = #c51d0b

adxlen = 15
dilen = 15
dirmov(len) =>
    up = ta.change(high)
    down = -ta.change(low)
    plusDM = na(up) ? na : up > down and up > 0 ? up : 0
    minusDM = na(down) ? na : down > up and down > 0 ? down : 0
    truerange = ta.rma(ta.tr, len)
    plus = fixnan(100 * ta.rma(plusDM, len) / truerange)
    minus = fixnan(100 * ta.rma(minusDM, len) / truerange)
    [plus, minus]
adx(dilen, adxlen) =>
    [plus, minus] = dirmov(dilen)
    sum = plus + minus
    adx = 100 * ta.rma(math.abs(plus - minus) / (sum == 0 ? 1 : sum), adxlen)
    adx
sig = adx(dilen, adxlen)

// range ADX threshold
sidewaysThreshold = input.int(title='ADX Sideways Threshold (10-30)', minval=2, defval=15)

// boolean expression to see if the ADX is below tehe sideways threshold
bool isSideways = sig < sidewaysThreshold


// adding the option to color the bars when in a trading range
useBarColor = true
bColor = isSideways ? #b102fc : na
barcolor(useBarColor ? bColor : na)


barcolor(close > supertrend ? #3cff00 : #fe0100)

percentStop = input.float(1, "Stop Loss % (0 to Disable)", 0, group="BUY & SELL SIGNALS")

srcStop = close


lastTrade(src) => ta.valuewhen(bull or bear, src, 0)
entry_y = lastTrade(srcStop)
stop_y = lastTrade(atrStop)
tp1_y = (entry_y - lastTrade(atrStop)) * 1 + entry_y
tp2_y = (entry_y - lastTrade(atrStop)) * 2 + entry_y
tp3_y = (entry_y - lastTrade(atrStop)) * 3 + entry_y

labelTpSl(y, txt, color) =>
    label labelTpSl = percentStop != 0 ? label.new(bar_index + 1, y, txt, xloc.bar_index, yloc.price, color, label.style_label_left, #000000, size.normal) : na
    label.delete(labelTpSl[1])

if (levels2)
    labelTpSl(entry_y, "Entry --  " + str.tostring(entry_y, decimals), color.rgb(242, 244, 252))
    labelTpSl(stop_y , " Stop Loss --  " + str.tostring(stop_y, decimals), #f90808)
    labelTpSl(tp1_y, " TP 1 --  " + str.tostring(tp1_y, decimals), #00ff08)
    labelTpSl(tp2_y, " TP 2 --  " + str.tostring(tp2_y, decimals), #00ff08)
    labelTpSl(tp3_y, " TP 3 --  " + str.tostring(tp3_y, decimals), #00ff08)

style2 = linesStyle == "SOLID" ? line.style_solid : linesStyle == "DASHED" ? line.style_dashed : line.style_dotted

lineTpSl(y, color) =>
    line lineTpSl = percentStop != 0 ? line.new(bar_index - (trigger ? countBull : countBear) + 4, y, bar_index + 1, y, xloc.bar_index, extend.none, color, style2) : na
    line.delete(lineTpSl[1])

if (lvlLines)
    lineTpSl(entry_y, color.green)
    lineTpSl(stop_y, color.red)
    lineTpSl(tp1_y, color.green)
    lineTpSl(tp2_y, color.green)
    lineTpSl(tp3_y, color.green)


y1 = low - (ta.atr(30) * 2), y1B = low - ta.atr(30)
y2 = high + (ta.atr(30) * 2), y2B = high + ta.atr(30)


buy  =  bull and nbuysell  ? label.new(bar_index, y1, sma4_strong   >= sma5_strong   ? "🚀" : "🚀", xloc.bar_index, yloc.price, color.rgb(10, 247, 18, 60), label.style_label_up, #000000, size.normal) : na
sell =  bear and nbuysell  ? label.new(bar_index, y2, sma4_strong   <= sma5_strong   ? "🐻" : "🐻", xloc.bar_index, yloc.price, color.rgb(239, 12, 12, 66), label.style_label_down, #000000, size.normal) : na


int volSen = 3


plotchar(volSen, "volSen", "", location.top)


// Get Components
ema1        = ta.ema(ohlc4, 5*volSen)
ema2        = ta.ema(ohlc4, 9*volSen)
ema3        = ta.ema(ohlc4, 13*volSen)
ema4        = ta.ema(ohlc4, 34*volSen)
ema5        = ta.ema(ohlc4, 50*volSen)

alertcondition(bull, title='Buy Signal', message = "BUY")
alertcondition(bear, title='sell Signal', message = "BUY")


//-----------------------------------------------------------------------------{
//Constants
//-----------------------------------------------------------------------------{
color TRANSP_CSS = #ffffff00

//Tooltips
string MODE_TOOLTIP          = 'Allows to display historical Structure or only the recent ones'
string STYLE_TOOLTIP         = 'Indicator color theme'
string COLOR_CANDLES_TOOLTIP = 'Display additional candles with a color reflecting the current trend detected by structure'
string SHOW_INTERNAL         = 'Display internal market structure'
string CONFLUENCE_FILTER     = 'Filter non significant internal structure breakouts'
string SHOW_SWING            = 'Display swing market Structure'
string SHOW_SWING_POINTS     = 'Display swing point as labels on the chart'
string SHOW_SWHL_POINTS      = 'Highlight most recent strong and weak high/low points on the chart'
string INTERNAL_OB           = 'Display internal order blocks on the chart\n\nNumber of internal order blocks to display on the chart'
string SWING_OB              = 'Display swing order blocks on the chart\n\nNumber of internal swing blocks to display on the chart'
string FILTER_OB             = 'Method used to filter out volatile order blocks \n\nIt is recommended to use the cumulative mean range method when a low amount of data is available'
string SHOW_EQHL             = 'Display equal highs and equal lows on the chart'
string EQHL_BARS             = 'Number of bars used to confirm equal highs and equal lows'
string EQHL_THRESHOLD        = 'Sensitivity threshold in a range (0, 1) used for the detection of equal highs & lows\n\nLower values will return fewer but more pertinent results'
string SHOW_FVG              = 'Display fair values gaps on the chart'
string AUTO_FVG              = 'Filter out non significant fair value gaps'
string FVG_TF                = 'Fair value gaps timeframe'
string EXTEND_FVG            = 'Determine how many bars to extend the Fair Value Gap boxes on chart'
string PED_ZONES             = 'Display premium, discount, and equilibrium zones on chart'

//-----------------------------------------------------------------------------{
//Settings
//-----------------------------------------------------------------------------{
//General
//----------------------------------------{
mode = input.string('Historical'
  , options = ['Historical', 'Present']
  , group = 'Smart Money Concepts'
  , tooltip = MODE_TOOLTIP)

style = input.string('Colored'
  , options = ['Colored', 'Monochrome']
  , group = 'Smart Money Concepts'
  , tooltip = STYLE_TOOLTIP)

show_trend = input(false, 'Color Candles'
  , group = 'Smart Money Concepts'
  , tooltip = COLOR_CANDLES_TOOLTIP)

//----------------------------------------}
//Internal Structure
//----------------------------------------{
show_internals = input(false, 'Show Internal Structure'
  , group = 'Real Time Internal Structure'
  , tooltip = SHOW_INTERNAL)

show_ibull = input.string('All', 'Bullish Structure'
  , options = ['All', 'BOS', 'CHoCH']
  , inline = 'ibull'
  , group = 'Real Time Internal Structure')

swing_ibull_css = input(#089981, ''
  , inline = 'ibull'
  , group = 'Real Time Internal Structure')

//Bear Structure
show_ibear = input.string('All', 'Bearish Structure'
  , options = ['All', 'BOS', 'CHoCH']
  , inline = 'ibear'
  , group = 'Real Time Internal Structure')

swing_ibear_css = input(#f23645, ''
  , inline = 'ibear'
  , group = 'Real Time Internal Structure')

ifilter_confluence = input(false, 'Confluence Filter'
  , group = 'Real Time Internal Structure'
  , tooltip = CONFLUENCE_FILTER)

internal_structure_size = input.string('Tiny', 'Internal Label Size'
  , options = ['Tiny', 'Small', 'Normal']
  , group = 'Real Time Internal Structure')

//----------------------------------------}
//Swing Structure
//----------------------------------------{
show_Structure = input(true, 'Show Swing Structure'
  , group = 'Real Time Swing Structure'
  , tooltip = SHOW_SWING)

//Bull Structure
show_bull = input.string('All', 'Bullish Structure'
  , options = ['All', 'BOS', 'CHoCH']
  , inline = 'bull'
  , group = 'Real Time Swing Structure')

swing_bull_css = input(color.rgb(0, 0, 0), ''
  , inline = 'bull'
  , group = 'Real Time Swing Structure')

//Bear Structure
show_bear = input.string('All', 'Bearish Structure'
  , options = ['All', 'BOS', 'CHoCH']
  , inline = 'bear'
  , group = 'Real Time Swing Structure')

swing_bear_css = input(#000000, ''
  , inline = 'bear'
  , group = 'Real Time Swing Structure')

swing_structure_size = input.string('Small', 'Swing Label Size'
  , options = ['Tiny', 'Small', 'Normal']
  , group = 'Real Time Swing Structure')

//Swings
show_swings = input(false, 'Show Swings Points'
  , inline = 'swings'
  , group = 'Real Time Swing Structure'
  , tooltip = SHOW_SWING_POINTS)

length = input.int(50, ''
  , minval = 10
  , inline = 'swings'
  , group = 'Real Time Swing Structure')

show_hl_swings = input(true, 'Show Strong/Weak High/Low'
  , group = 'Real Time Swing Structure'
  , tooltip = SHOW_SWHL_POINTS)

//----------------------------------------}
//Order Blocks
//----------------------------------------{
show_iob = input(false, 'Internal Order Blocks'
  , inline = 'iob'
  , group = 'Order Blocks'
  , tooltip = INTERNAL_OB)

iob_showlast = input.int(5, ''
  , minval = 1
  , inline = 'iob'
  , group = 'Order Blocks')

show_ob = input(true, 'Swing Order Blocks'
  , inline = 'ob'
  , group = 'Order Blocks'
  , tooltip = SWING_OB)

ob_showlast = input.int(5, ''
  , minval = 1
  , inline = 'ob'
  , group = 'Order Blocks')

ob_filter = input.string('Atr', 'Order Block Filter'
  , options = ['Atr', 'Cumulative Mean Range']
  , group = 'Order Blocks'
  , tooltip = FILTER_OB)

ibull_ob_css = input.color(#ffdd0033, 'Internal Bullish OB'
  , group = 'Order Blocks')

ibear_ob_css = input.color(#ffdd0033, 'Internal Bearish OB'
  , group = 'Order Blocks')

bull_ob_css = input.color(color.rgb(255, 255, 255, 80), 'Bullish OB'
  , group = 'Order Blocks')

bear_ob_css = input.color(color.rgb(255, 255, 255, 80), 'Bearish OB'
  , group = 'Order Blocks')

//----------------------------------------}
//EQH/EQL
//----------------------------------------{
show_eq = input(false, 'Equal High/Low'
  , group = 'EQH/EQL'
  , tooltip = SHOW_EQHL)

eq_len = input.int(3, 'Bars Confirmation'
  , minval = 1
  , group = 'EQH/EQL'
  , tooltip = EQHL_BARS)

eq_threshold = input.float(0.1, 'Threshold'
  , minval = 0
  , maxval = 0.5
  , step = 0.1
  , group = 'EQH/EQL'
  , tooltip = EQHL_THRESHOLD)

eq_size = input.string('Tiny', 'Label Size'
  , options = ['Tiny', 'Small', 'Normal']
  , group = 'EQH/EQL')

//----------------------------------------}
//Fair Value Gaps
//----------------------------------------{
show_fvg = input(true, 'Fair Value Gaps'
  , group = 'Fair Value Gaps'
  , tooltip = SHOW_FVG)

fvg_auto = input(true, "Auto Threshold"
  , group = 'Fair Value Gaps'
  , tooltip = AUTO_FVG)

fvg_tf = input.timeframe('', "Timeframe"
  , group = 'Fair Value Gaps'
  , tooltip = FVG_TF)

bull_fvg_css = input.color(#ddff006f, 'Bullish FVG'
  , group = 'Fair Value Gaps')

bear_fvg_css = input.color(#f2ff0060, 'Bearish FVG'
  , group = 'Fair Value Gaps')

fvg_extend = input.int(10, "Extend FVG"
  , minval = 0
  , group = 'Fair Value Gaps'
  , tooltip = EXTEND_FVG)

//----------------------------------------}
//Previous day/week high/low
//----------------------------------------{
//Daily
show_pdhl = input(false, 'Daily'
  , inline = 'daily'
  , group = 'Highs & Lows MTF')

pdhl_style = input.string('⎯⎯⎯', ''
  , options = ['⎯⎯⎯', '----', '····']
  , inline = 'daily'
  , group = 'Highs & Lows MTF')

pdhl_css = input(#2157f3, ''
  , inline = 'daily'
  , group = 'Highs & Lows MTF')

//Weekly
show_pwhl = input(false, 'Weekly'
  , inline = 'weekly'
  , group = 'Highs & Lows MTF')

pwhl_style = input.string('⎯⎯⎯', ''
  , options = ['⎯⎯⎯', '----', '····']
  , inline = 'weekly'
  , group = 'Highs & Lows MTF')

pwhl_css = input(#2157f3, ''
  , inline = 'weekly'
  , group = 'Highs & Lows MTF')

//Monthly
show_pmhl = input(false, 'Monthly'
  , inline = 'monthly'
  , group = 'Highs & Lows MTF')

pmhl_style = input.string('⎯⎯⎯', ''
  , options = ['⎯⎯⎯', '----', '····']
  , inline = 'monthly'
  , group = 'Highs & Lows MTF')

pmhl_css = input(#2157f3, ''
  , inline = 'monthly'
  , group = 'Highs & Lows MTF')

//----------------------------------------}
//Premium/Discount zones
//----------------------------------------{
show_sd = input(false, 'Premium/Discount Zones'
  , group = 'Premium & Discount Zones'
  , tooltip = PED_ZONES)

premium_css = input.color(#f23645, 'Premium Zone'
  , group = 'Premium & Discount Zones')

eq_css = input.color(#b2b5be, 'Equilibrium Zone'
  , group = 'Premium & Discount Zones')

discount_css = input.color(#089981, 'Discount Zone'
  , group = 'Premium & Discount Zones')

//-----------------------------------------------------------------------------}
//Functions
//-----------------------------------------------------------------------------{
n = bar_index

atr = ta.atr(200)
cmean_range = ta.cum(high - low) / n

//HL Output function
hl() => [high, low]

//Get ohlc values function
get_ohlc()=> [close[1], open[1], high, low, high[2], low[2]]

//Display Structure function
display_Structure(x, y, txt, css, dashed, down, lbl_size)=>
    structure_line = line.new(x, y, n, y
      , color = css
      , style = dashed ? line.style_dashed : line.style_solid)

    structure_lbl = label.new(int(math.avg(x, n)), y, txt
      , color = TRANSP_CSS
      , textcolor = css
      , style = down ? label.style_label_down : label.style_label_up
      , size = lbl_size)

    if mode == 'Present'
        line.delete(structure_line[1])
        label.delete(structure_lbl[1])

//Swings detection/measurements
swings(len)=>
    var os = 0

    upper = ta.highest(len)
    lower = ta.lowest(len)

    os := high[len] > upper ? 0 : low[len] < lower ? 1 : os[1]

    top = os == 0 and os[1] != 0 ? high[len] : 0
    btm = os == 1 and os[1] != 1 ? low[len] : 0

    [top, btm]

//Order block coordinates function
ob_coord(use_max, loc, target_top, target_btm, target_left, target_type)=>
    min = 99999999.
    max = 0.
    idx = 1

    ob_threshold = ob_filter == 'Atr' ? atr : cmean_range

    //Search for highest/lowest high within the structure interval and get range
    if use_max
        for i = 1 to (n - loc)-1
            if (high[i] - low[i]) < ob_threshold[i] * 2
                max := math.max(high[i], max)
                min := max == high[i] ? low[i] : min
                idx := max == high[i] ? i : idx
    else
        for i = 1 to (n - loc)-1
            if (high[i] - low[i]) < ob_threshold[i] * 2
                min := math.min(low[i], min)
                max := min == low[i] ? high[i] : max
                idx := min == low[i] ? i : idx

    array.unshift(target_top, max)
    array.unshift(target_btm, min)
    array.unshift(target_left, time[idx])
    array.unshift(target_type, use_max ? -1 : 1)

//Set order blocks
display_ob(boxes, target_top, target_btm, target_left, target_type, show_last, swing, size)=>
    for i = 0 to math.min(show_last-1, size-1)
        get_box = array.get(boxes, i)

        box.set_lefttop(get_box, array.get(target_left, i), array.get(target_top, i))
        box.set_rightbottom(get_box, array.get(target_left, i), array.get(target_btm, i))
        box.set_extend(get_box, extend.right)

        color css = na

        if swing
            if style == 'Monochrome'
                css := array.get(target_type, i) == 1 ? color.new(#b2b5be, 80) : color.new(#5d606b, 80)
                border_css = array.get(target_type, i) == 1 ? #b2b5be : #5d606b
                box.set_border_color(get_box, border_css)
            else
                css := array.get(target_type, i) == 1 ? bull_ob_css : bear_ob_css
                box.set_border_color(get_box, css)

            box.set_bgcolor(get_box, css)
        else
            if style == 'Monochrome'
                css := array.get(target_type, i) == 1 ? color.new(#b2b5be, 80) : color.new(#5d606b, 80)
            else
                css := array.get(target_type, i) == 1 ? ibull_ob_css : ibear_ob_css

            box.set_border_color(get_box, css)
            box.set_bgcolor(get_box, css)

//Line Style function
get_line_style(style) =>
    out = switch style
        '⎯⎯⎯'  => line.style_solid
        '----' => line.style_dashed
        '····' => line.style_dotted

//Set line/labels function for previous high/lows
phl(h, l, tf, css)=>
    var line high_line = line.new(na,na,na,na
      , xloc = xloc.bar_time
      , color = css
      , style = get_line_style(pdhl_style))

    var label high_lbl = label.new(na,na
      , xloc = xloc.bar_time
      , text = str.format('P{0}H', tf)
      , color = TRANSP_CSS
      , textcolor = css
      , size = size.small
      , style = label.style_label_left)

    var line low_line = line.new(na,na,na,na
      , xloc = xloc.bar_time
      , color = css
      , style = get_line_style(pdhl_style))

    var label low_lbl = label.new(na,na
      , xloc = xloc.bar_time
      , text = str.format('P{0}L', tf)
      , color = TRANSP_CSS
      , textcolor = css
      , size = size.small
      , style = label.style_label_left)

    hy = ta.valuewhen(h != h[1], h, 1)
    hx = ta.valuewhen(h == high, time, 1)

    ly = ta.valuewhen(l != l[1], l, 1)
    lx = ta.valuewhen(l == low, time, 1)

    if barstate.islast
        ext = time + (time - time[1])*20

        //High
        line.set_xy1(high_line, hx, hy)
        line.set_xy2(high_line, ext, hy)

        label.set_xy(high_lbl, ext, hy)

        //Low
        line.set_xy1(low_line, lx, ly)
        line.set_xy2(low_line, ext, ly)

        label.set_xy(low_lbl, ext, ly)

//-----------------------------------------------------------------------------}
//Global variables
//-----------------------------------------------------------------------------{
var trend = 0, var itrend = 0

var top_y = 0., var top_x = 0
var btm_y = 0., var btm_x = 0

var itop_y = 0., var itop_x = 0
var ibtm_y = 0., var ibtm_x = 0

var trail_up = high, var trail_dn = low
var trail_up_x = 0,  var trail_dn_x = 0

var top_cross = true,  var btm_cross = true
var itop_cross = true, var ibtm_cross = true

var txt_top = '',  var txt_btm = ''

//Alerts
bull_choch_alert = false
bull_bos_alert   = false

bear_choch_alert = false
bear_bos_alert   = false

bull_ichoch_alert = false
bull_ibos_alert   = false

bear_ichoch_alert = false
bear_ibos_alert   = false

bull_iob_break = false
bear_iob_break = false

bull_ob_break = false
bear_ob_break = false

eqh_alert = false
eql_alert = false

//Structure colors
var bull_css = style == 'Monochrome' ? #b2b5be
  : swing_bull_css

var bear_css = style == 'Monochrome' ? #b2b5be
  : swing_bear_css

var ibull_css = style == 'Monochrome' ? #b2b5be
  : swing_ibull_css

var ibear_css = style == 'Monochrome' ? #b2b5be
  : swing_ibear_css

//Labels size
var internal_structure_lbl_size = internal_structure_size == 'Tiny'
  ? size.tiny
  : internal_structure_size == 'Small'
  ? size.small
  : size.normal

var swing_structure_lbl_size = swing_structure_size == 'Tiny'
  ? size.tiny
  : swing_structure_size == 'Small'
  ? size.small
  : size.normal

var eqhl_lbl_size = eq_size == 'Tiny'
  ? size.tiny
  : eq_size == 'Small'
  ? size.small
  : size.normal

//Swings
[top, btm] = swings(length)

[itop, ibtm] = swings(5)

//-----------------------------------------------------------------------------}
//Pivot High
//-----------------------------------------------------------------------------{
var line extend_top = na

var label extend_top_lbl = label.new(na, na
  , color = TRANSP_CSS
  , textcolor = bear_css
  , style = label.style_label_down
  , size = size.tiny)

if top
    top_cross := true
    txt_top := top > top_y ? 'HH' : 'LH'

    if show_swings
        top_lbl = label.new(n-length, top, txt_top
          , color = TRANSP_CSS
          , textcolor = bear_css
          , style = label.style_label_down
          , size = swing_structure_lbl_size)

        if mode == 'Present'
            label.delete(top_lbl[1])

    //Extend recent top to last bar
    line.delete(extend_top[1])
    extend_top := line.new(n-length, top, n, top
      , color = bear_css)

    top_y := top
    top_x := n - length

    trail_up := top
    trail_up_x := n - length

if itop
    itop_cross := true

    itop_y := itop
    itop_x := n - 5

//Trailing maximum
trail_up := math.max(high, trail_up)
trail_up_x := trail_up == high ? n : trail_up_x

//Set top extension label/line
if barstate.islast and show_hl_swings
    line.set_xy1(extend_top, trail_up_x, trail_up)
    line.set_xy2(extend_top, n + 20, trail_up)

    label.set_x(extend_top_lbl, n + 20)
    label.set_y(extend_top_lbl, trail_up)
    label.set_text(extend_top_lbl, trend < 0 ? 'Strong High' : 'Weak High')

//-----------------------------------------------------------------------------}
//Pivot Low
//-----------------------------------------------------------------------------{
var line extend_btm = na

var label extend_btm_lbl = label.new(na, na
  , color = TRANSP_CSS
  , textcolor = bull_css
  , style = label.style_label_up
  , size = size.tiny)

if btm
    btm_cross := true
    txt_btm := btm < btm_y ? 'LL' : 'HL'

    if show_swings
        btm_lbl = label.new(n - length, btm, txt_btm
          , color = TRANSP_CSS
          , textcolor = bull_css
          , style = label.style_label_up
          , size = swing_structure_lbl_size)

        if mode == 'Present'
            label.delete(btm_lbl[1])

    //Extend recent btm to last bar
    line.delete(extend_btm[1])
    extend_btm := line.new(n - length, btm, n, btm
      , color = bull_css)

    btm_y := btm
    btm_x := n-length

    trail_dn := btm
    trail_dn_x := n-length

if ibtm
    ibtm_cross := true

    ibtm_y := ibtm
    ibtm_x := n - 5

//Trailing minimum
trail_dn := math.min(low, trail_dn)
trail_dn_x := trail_dn == low ? n : trail_dn_x

//Set btm extension label/line
if barstate.islast and show_hl_swings
    line.set_xy1(extend_btm, trail_dn_x, trail_dn)
    line.set_xy2(extend_btm, n + 20, trail_dn)

    label.set_x(extend_btm_lbl, n + 20)
    label.set_y(extend_btm_lbl, trail_dn)
    label.set_text(extend_btm_lbl, trend > 0 ? 'Strong Low' : 'Weak Low')

//-----------------------------------------------------------------------------}
//Order Blocks Arrays
//-----------------------------------------------------------------------------{
var iob_top = array.new_float(0)
var iob_btm = array.new_float(0)
var iob_left = array.new_int(0)
var iob_type = array.new_int(0)

var ob_top = array.new_float(0)
var ob_btm = array.new_float(0)
var ob_left = array.new_int(0)
var ob_type = array.new_int(0)

//-----------------------------------------------------------------------------}
//Pivot High BOS/CHoCH
//-----------------------------------------------------------------------------{
//Filtering
var bull_concordant = true

if ifilter_confluence
    bull_concordant := high - math.max(close, open) > math.min(close, open - low)

//Detect internal bullish Structure
if ta.crossover(close, itop_y) and itop_cross and top_y != itop_y and bull_concordant
    bool choch = na

    if itrend < 0
        choch := true
        bull_ichoch_alert := true
    else
        bull_ibos_alert := true

    txt = choch ? 'CHoCH' : 'BOS'

    if show_internals
        if show_ibull == 'All' or (show_ibull == 'BOS' and not choch) or (show_ibull == 'CHoCH' and choch)
            display_Structure(itop_x, itop_y, txt, ibull_css, true, true, internal_structure_lbl_size)

    itop_cross := false
    itrend := 1

    //Internal Order Block
    if show_iob
        ob_coord(false, itop_x, iob_top, iob_btm, iob_left, iob_type)

//Detect bullish Structure
if ta.crossover(close, top_y) and top_cross
    bool choch = na

    if trend < 0
        choch := true
        bull_choch_alert := true
    else
        bull_bos_alert := true

    txt = choch ? 'CHoCH' : 'BOS'

    if show_Structure
        if show_bull == 'All' or (show_bull == 'BOS' and not choch) or (show_bull == 'CHoCH' and choch)
            display_Structure(top_x, top_y, txt, bull_css, false, true, swing_structure_lbl_size)

    //Order Block
    if show_ob
        ob_coord(false, top_x, ob_top, ob_btm, ob_left, ob_type)

    top_cross := false
    trend := 1

//-----------------------------------------------------------------------------}
//Pivot Low BOS/CHoCH
//-----------------------------------------------------------------------------{
var bear_concordant = true

if ifilter_confluence
    bear_concordant := high - math.max(close, open) < math.min(close, open - low)

//Detect internal bearish Structure
if ta.crossunder(close, ibtm_y) and ibtm_cross and btm_y != ibtm_y and bear_concordant
    bool choch = false

    if itrend > 0
        choch := true
        bear_ichoch_alert := true
    else
        bear_ibos_alert := true

    txt = choch ? 'CHoCH' : 'BOS'

    if show_internals
        if show_ibear == 'All' or (show_ibear == 'BOS' and not choch) or (show_ibear == 'CHoCH' and choch)
            display_Structure(ibtm_x, ibtm_y, txt, ibear_css, true, false, internal_structure_lbl_size)

    ibtm_cross := false
    itrend := -1

    //Internal Order Block
    if show_iob
        ob_coord(true, ibtm_x, iob_top, iob_btm, iob_left, iob_type)

//Detect bearish Structure
if ta.crossunder(close, btm_y) and btm_cross
    bool choch = na

    if trend > 0
        choch := true
        bear_choch_alert := true
    else
        bear_bos_alert := true

    txt = choch ? 'CHoCH' : 'BOS'

    if show_Structure
        if show_bear == 'All' or (show_bear == 'BOS' and not choch) or (show_bear == 'CHoCH' and choch)
            display_Structure(btm_x, btm_y, txt, bear_css, false, false, swing_structure_lbl_size)

    //Order Block
    if show_ob
        ob_coord(true, btm_x, ob_top, ob_btm, ob_left, ob_type)

    btm_cross := false
    trend := -1

//-----------------------------------------------------------------------------}
//Order Blocks
//-----------------------------------------------------------------------------{
//Set order blocks
var iob_boxes = array.new_box(0)
var ob_boxes = array.new_box(0)

//Delete internal order blocks box coordinates if top/bottom is broken
for element in iob_type
    index = array.indexof(iob_type, element)

    if close < array.get(iob_btm, index) and element == 1
        array.remove(iob_top, index)
        array.remove(iob_btm, index)
        array.remove(iob_left, index)
        array.remove(iob_type, index)
        bull_iob_break := true

    else if close > array.get(iob_top, index) and element == -1
        array.remove(iob_top, index)
        array.remove(iob_btm, index)
        array.remove(iob_left, index)
        array.remove(iob_type, index)
        bear_iob_break := true

//Delete internal order blocks box coordinates if top/bottom is broken
for element in ob_type
    index = array.indexof(ob_type, element)

    if close < array.get(ob_btm, index) and element == 1
        array.remove(ob_top, index)
        array.remove(ob_btm, index)
        array.remove(ob_left, index)
        array.remove(ob_type, index)
        bull_ob_break := true

    else if close > array.get(ob_top, index) and element == -1
        array.remove(ob_top, index)
        array.remove(ob_btm, index)
        array.remove(ob_left, index)
        array.remove(ob_type, index)
        bear_ob_break := true

iob_size = array.size(iob_type)
ob_size = array.size(ob_type)

if barstate.isfirst
    if show_iob
        for i = 0 to iob_showlast-1
            array.push(iob_boxes, box.new(na,na,na,na, xloc = xloc.bar_time))
    if show_ob
        for i = 0 to ob_showlast-1
            array.push(ob_boxes, box.new(na,na,na,na, xloc = xloc.bar_time))

if iob_size > 0
    if barstate.islast
        display_ob(iob_boxes, iob_top, iob_btm, iob_left, iob_type, iob_showlast, false, iob_size)

if ob_size > 0
    if barstate.islast
        display_ob(ob_boxes, ob_top, ob_btm, ob_left, ob_type, ob_showlast, true, ob_size)

//-----------------------------------------------------------------------------}
//EQH/EQL
//-----------------------------------------------------------------------------{
var eq_prev_top = 0.
var eq_top_x = 0

var eq_prev_btm = 0.
var eq_btm_x = 0

if show_eq
    eq_top = ta.pivothigh(eq_len, eq_len)
    eq_btm = ta.pivotlow(eq_len, eq_len)

    if eq_top
        max = math.max(eq_top, eq_prev_top)
        min = math.min(eq_top, eq_prev_top)

        if max < min + atr * eq_threshold
            eqh_line = line.new(eq_top_x, eq_prev_top, n-eq_len, eq_top
              , color = bear_css
              , style = line.style_dotted)

            eqh_lbl = label.new(int(math.avg(n-eq_len, eq_top_x)), eq_top, 'EQH'
              , color = #00000000
              , textcolor = bear_css
              , style = label.style_label_down
              , size = eqhl_lbl_size)

            if mode == 'Present'
                line.delete(eqh_line[1])
                label.delete(eqh_lbl[1])

            eqh_alert := true

        eq_prev_top := eq_top
        eq_top_x := n-eq_len

    if eq_btm
        max = math.max(eq_btm, eq_prev_btm)
        min = math.min(eq_btm, eq_prev_btm)

        if min > max - atr * eq_threshold
            eql_line = line.new(eq_btm_x, eq_prev_btm, n-eq_len, eq_btm
              , color = bull_css
              , style = line.style_dotted)

            eql_lbl = label.new(int(math.avg(n-eq_len, eq_btm_x)), eq_btm, 'EQL'
              , color = #00000000
              , textcolor = bull_css
              , style = label.style_label_up
              , size = eqhl_lbl_size)

            eql_alert := true

            if mode == 'Present'
                line.delete(eql_line[1])
                label.delete(eql_lbl[1])

        eq_prev_btm := eq_btm
        eq_btm_x := n-eq_len

//-----------------------------------------------------------------------------}
//Fair Value Gaps
//-----------------------------------------------------------------------------{
var bullish_fvg_max = array.new_box(0)
var bullish_fvg_min = array.new_box(0)

var bearish_fvg_max = array.new_box(0)
var bearish_fvg_min = array.new_box(0)

float bullish_fvg_avg = na
float bearish_fvg_avg = na

bullish_fvg_cnd = false
bearish_fvg_cnd = false

[src_c1, src_o1, src_h, src_l, src_h2, src_l2] =
  request.security(syminfo.tickerid, fvg_tf, get_ohlc())

if show_fvg
    delta_per = (src_c1 - src_o1) / src_o1 * 100

    change_tf = timeframe.change(fvg_tf)

    threshold = fvg_auto ? ta.cum(math.abs(change_tf ? delta_per : 0)) / n * 2
      : 0

    //FVG conditions
    bullish_fvg_cnd := src_l > src_h2
      and src_c1 > src_h2
      and delta_per > threshold
      and change_tf

    bearish_fvg_cnd := src_h < src_l2
      and src_c1 < src_l2
      and -delta_per > threshold
      and change_tf

    //FVG Areas
    if bullish_fvg_cnd
        array.unshift(bullish_fvg_max, box.new(n-1, src_l, n + fvg_extend, math.avg(src_l, src_h2)
          , border_color = bull_fvg_css
          , bgcolor = bull_fvg_css))

        array.unshift(bullish_fvg_min, box.new(n-1, math.avg(src_l, src_h2), n + fvg_extend, src_h2
          , border_color = bull_fvg_css
          , bgcolor = bull_fvg_css))

    if bearish_fvg_cnd
        array.unshift(bearish_fvg_max, box.new(n-1, src_h, n + fvg_extend, math.avg(src_h, src_l2)
          , border_color = bear_fvg_css
          , bgcolor = bear_fvg_css))

        array.unshift(bearish_fvg_min, box.new(n-1, math.avg(src_h, src_l2), n + fvg_extend, src_l2
          , border_color = bear_fvg_css
          , bgcolor = bear_fvg_css))

    for bx in bullish_fvg_min
        if low < box.get_bottom(bx)
            box.delete(bx)
            box.delete(array.get(bullish_fvg_max, array.indexof(bullish_fvg_min, bx)))

    for bx in bearish_fvg_max
        if high > box.get_top(bx)
            box.delete(bx)
            box.delete(array.get(bearish_fvg_min, array.indexof(bearish_fvg_max, bx)))

//-----------------------------------------------------------------------------}
//Previous day/week high/lows
//-----------------------------------------------------------------------------{
//Daily high/low
[pdh, pdl] = request.security(syminfo.tickerid, 'D', hl()
  , lookahead = barmerge.lookahead_on)

//Weekly high/low
[pwh, pwl] = request.security(syminfo.tickerid, 'W', hl()
  , lookahead = barmerge.lookahead_on)

//Monthly high/low
[pmh, pml] = request.security(syminfo.tickerid, 'M', hl()
  , lookahead = barmerge.lookahead_on)

//Display Daily
if show_pdhl
    phl(pdh, pdl, 'D', pdhl_css)

//Display Weekly
if show_pwhl
    phl(pwh, pwl, 'W', pwhl_css)

//Display Monthly
if show_pmhl
    phl(pmh, pml, 'M', pmhl_css)

//-----------------------------------------------------------------------------}
//Premium/Discount/Equilibrium zones
//-----------------------------------------------------------------------------{
var premium = box.new(na, na, na, na
  , bgcolor = color.new(premium_css, 80)
  , border_color = na)

var premium_lbl = label.new(na, na
  , text = 'Premium'
  , color = TRANSP_CSS
  , textcolor = premium_css
  , style = label.style_label_down
  , size = size.small)

var eq = box.new(na, na, na, na
  , bgcolor = color.rgb(120, 123, 134, 80)
  , border_color = na)

var eq_lbl = label.new(na, na
  , text = 'Equilibrium'
  , color = TRANSP_CSS
  , textcolor = eq_css
  , style = label.style_label_left
  , size = size.small)

var discount = box.new(na, na, na, na
  , bgcolor = color.new(discount_css, 80)
  , border_color = na)

var discount_lbl = label.new(na, na
  , text = 'Discount'
  , color = TRANSP_CSS
  , textcolor = discount_css
  , style = label.style_label_up
  , size = size.small)

//Show Premium/Discount Areas
if barstate.islast and show_sd
    avg = math.avg(trail_up, trail_dn)

    box.set_lefttop(premium, math.max(top_x, btm_x), trail_up)
    box.set_rightbottom(premium, n, .95 * trail_up + .05 * trail_dn)

    label.set_xy(premium_lbl, int(math.avg(math.max(top_x, btm_x), n)), trail_up)

    box.set_lefttop(eq, math.max(top_x, btm_x), .525 * trail_up + .475*trail_dn)
    box.set_rightbottom(eq, n, .525 * trail_dn + .475 * trail_up)

    label.set_xy(eq_lbl, n, avg)

    box.set_lefttop(discount, math.max(top_x, btm_x), .95 * trail_dn + .05 * trail_up)
    box.set_rightbottom(discount, n, trail_dn)
    label.set_xy(discount_lbl, int(math.avg(math.max(top_x, btm_x), n)), trail_dn)

//-----------------------------------------------------------------------------}
//Trend
//-----------------------------------------------------------------------------{
var color trend_css = na

if show_trend
    if style == 'Colored'
        trend_css := itrend == 1 ? bull_css : bear_css
    else if style == 'Monochrome'
        trend_css := itrend == 1 ? #b2b5be : #5d606b

plotcandle(open, high, low, close
  , color = trend_css
  , wickcolor = trend_css
  , bordercolor = trend_css
  , editable = false)

//-----------------------------------------------------------------------------}
//Alerts
//-----------------------------------------------------------------------------{
//Internal Structure
alertcondition(bull_ibos_alert, 'Internal Bullish BOS', 'Internal Bullish BOS formed')
alertcondition(bull_ichoch_alert, 'Internal Bullish CHoCH', 'Internal Bullish CHoCH formed')

alertcondition(bear_ibos_alert, 'Internal Bearish BOS', 'Internal Bearish BOS formed')
alertcondition(bear_ichoch_alert, 'Internal Bearish CHoCH', 'Internal Bearish CHoCH formed')

//Swing Structure
alertcondition(bull_bos_alert, 'Bullish BOS', 'Internal Bullish BOS formed')
alertcondition(bull_choch_alert, 'Bullish CHoCH', 'Internal Bullish CHoCH formed')

alertcondition(bear_bos_alert, 'Bearish BOS', 'Bearish BOS formed')
alertcondition(bear_choch_alert, 'Bearish CHoCH', 'Bearish CHoCH formed')

//order Blocks
alertcondition(bull_iob_break, 'Bullish Internal OB Breakout', 'Price broke bullish internal OB')
alertcondition(bear_iob_break, 'Bearish Internal OB Breakout', 'Price broke bearish internal OB')

alertcondition(bull_ob_break, 'Bullish Swing OB Breakout', 'Price broke bullish swing OB')
alertcondition(bear_ob_break, 'Bearish Swing OB Breakout', 'Price broke bearish swing OB')

//EQH/EQL
alertcondition(eqh_alert, 'Equal Highs', 'Equal highs detected')
alertcondition(eql_alert, 'Equal Lows', 'Equal lows detected')

//FVG
alertcondition(bullish_fvg_cnd, 'Bullish FVG', 'Bullish FVG formed')
alertcondition(bearish_fvg_cnd, 'Bearish FVG', 'Bearish FVG formed')

//-----------------------------------------------------------------------------}
Các chỉ báo khác
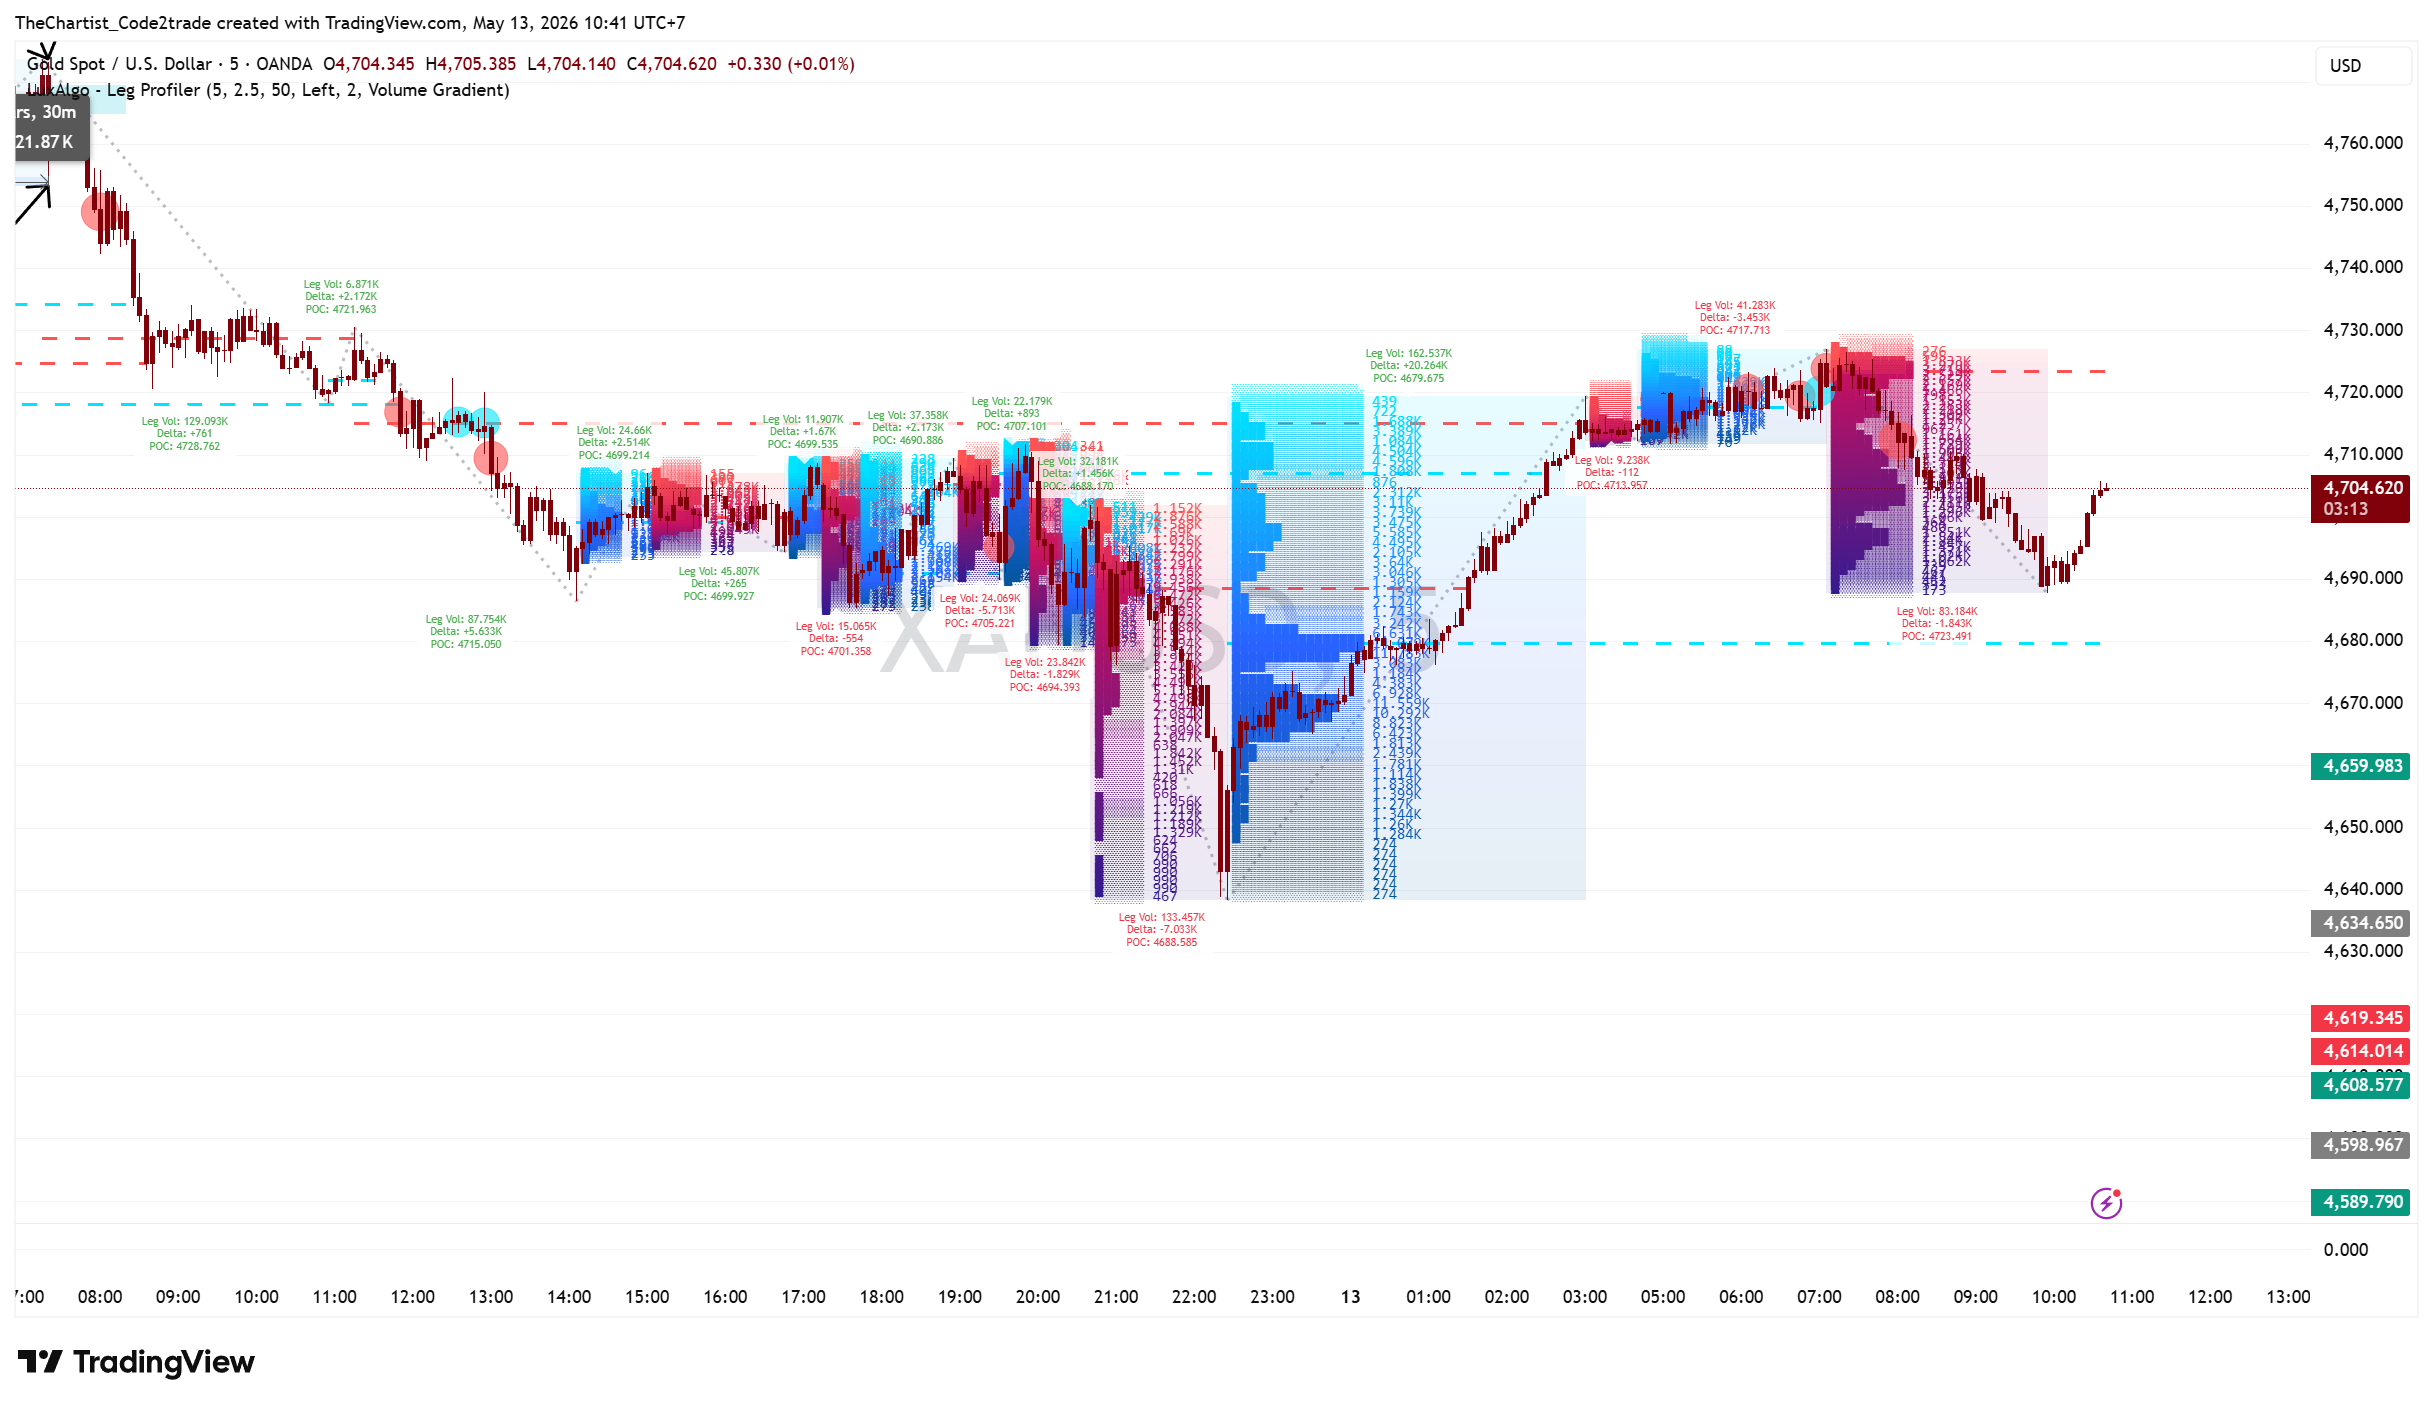
04 Structural Leg Profiler [LuxAlgo]
Isolated Scroll Container 1. Cup & Handle Indicator Description (Zeiierman) An indicator that automatically detects the Cup & Handle pattern – one of the most classic chart patterns in technical analysis 1.1 Indicator Concept The Cup & Handle indicator is based on the theory of market psychology patterns discovered by
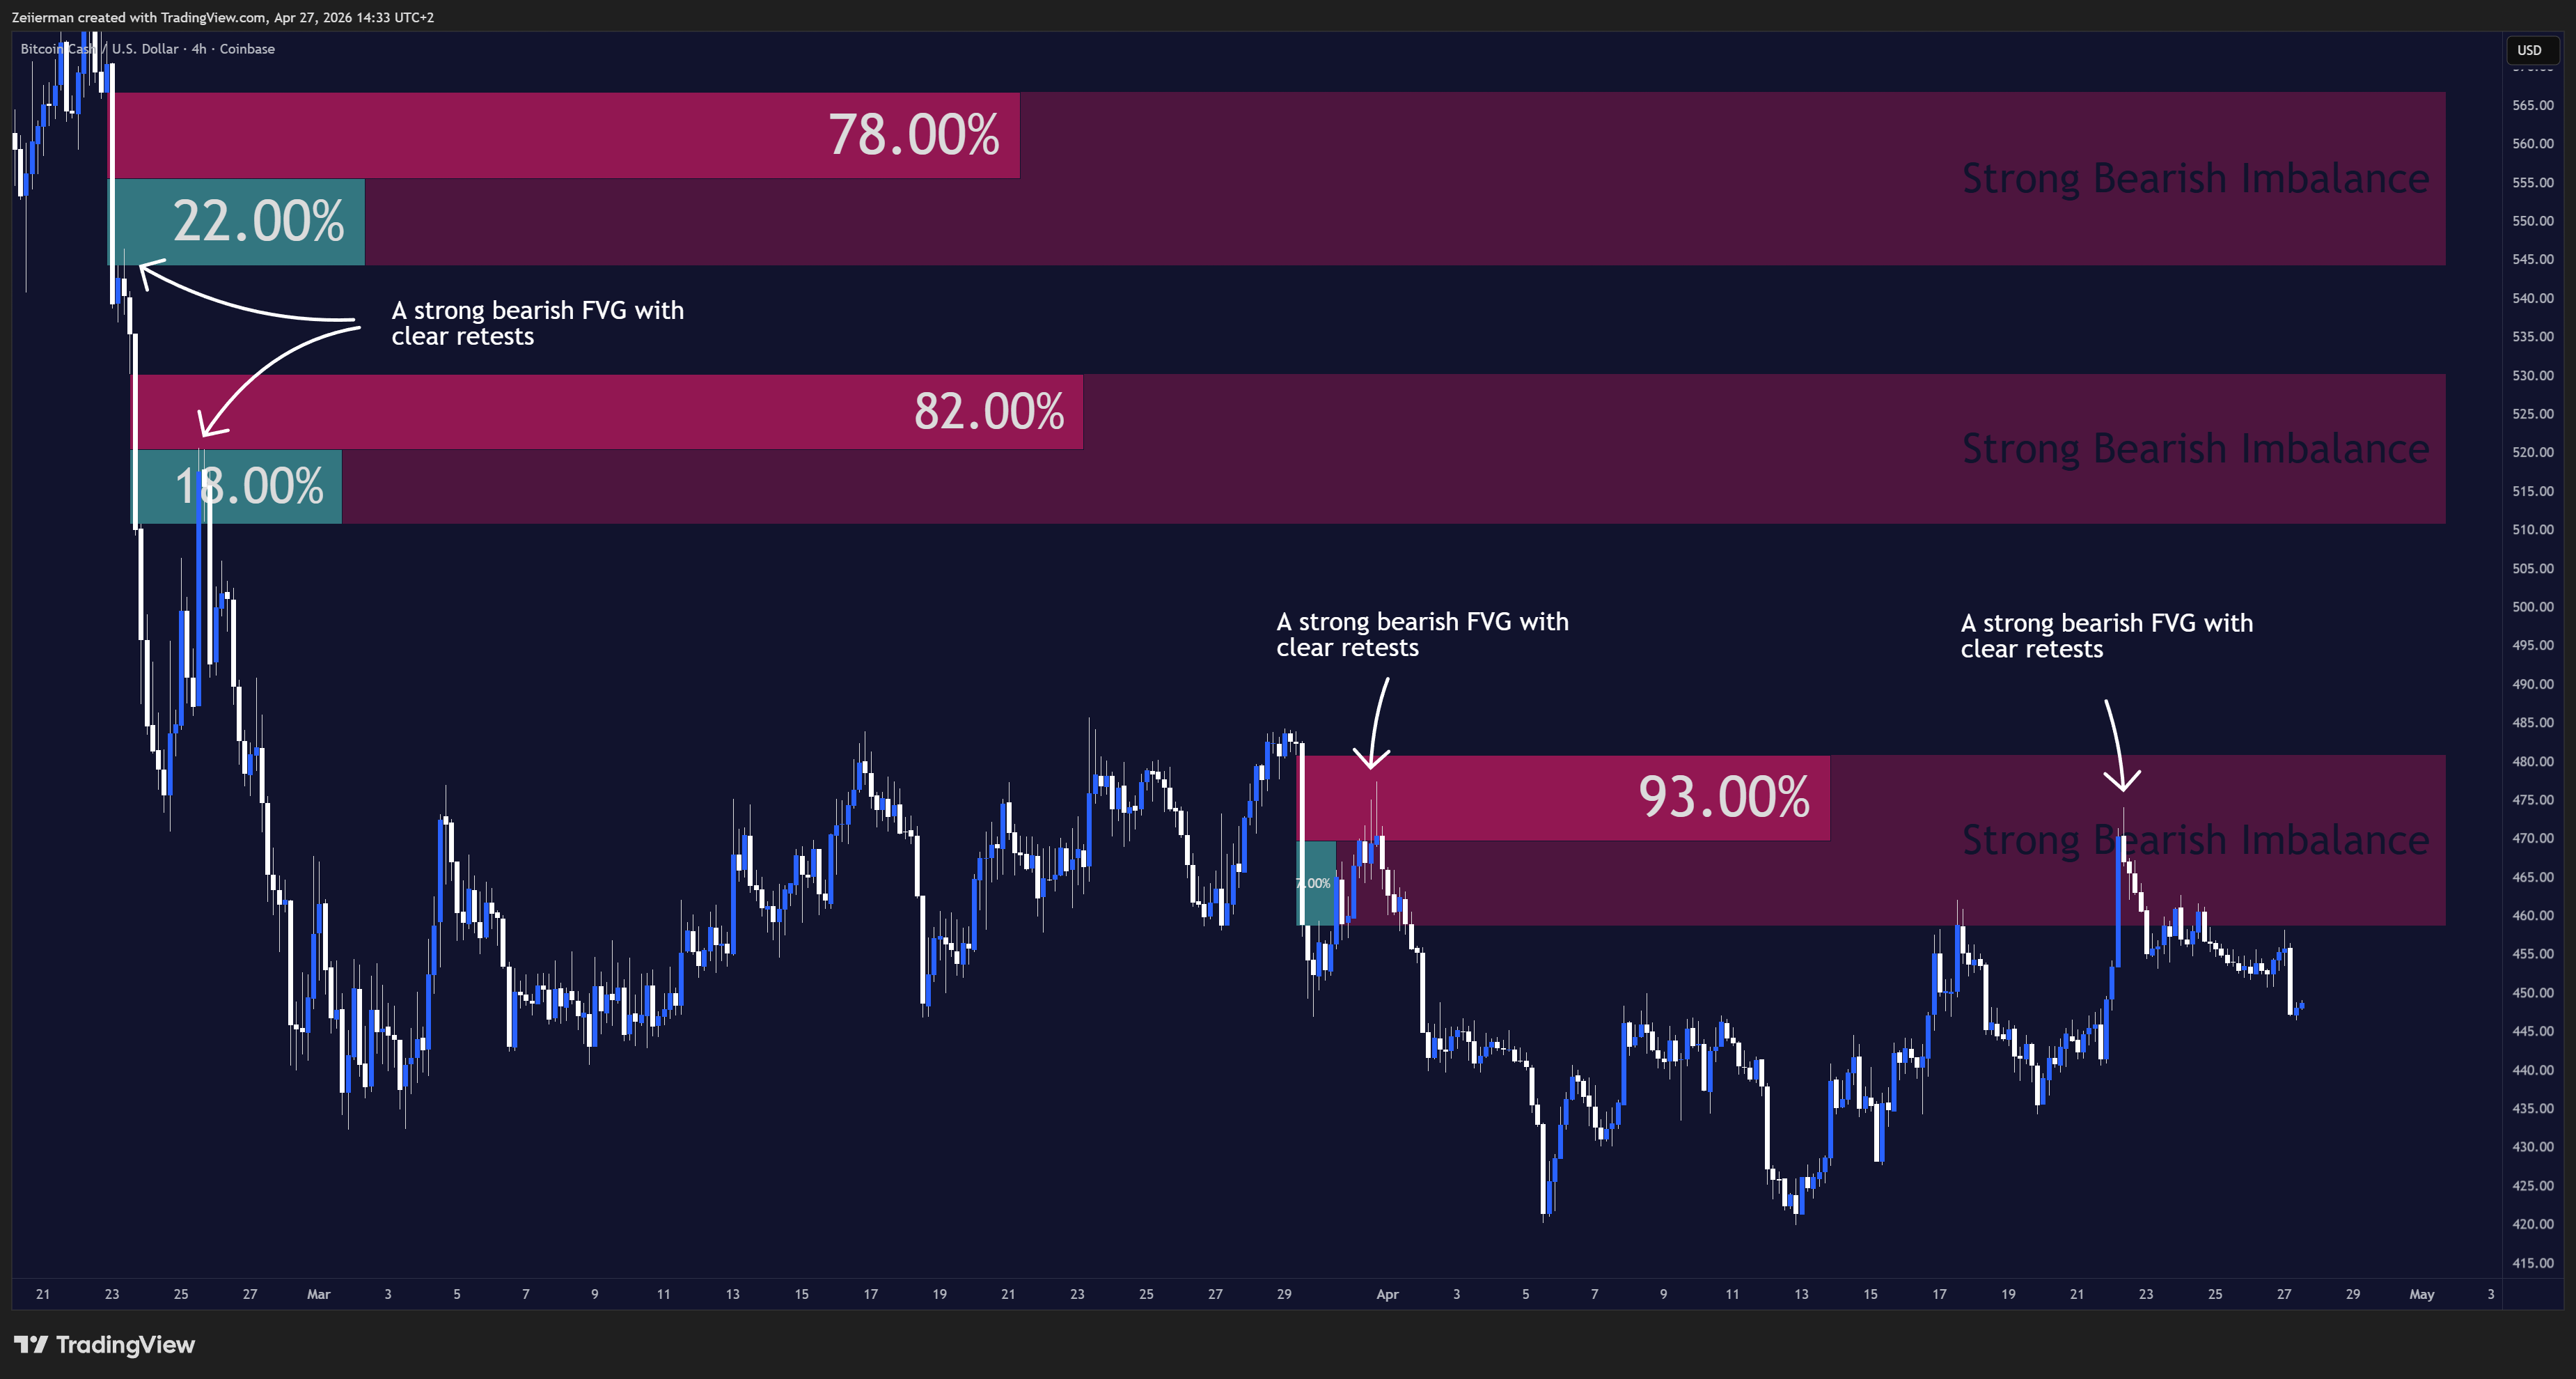
03 Ranked FVG
Isolated Scroll Container 1. Indicator Description – Ranked FVG Imbalance Zones (Zeiierman) Detects, ranks, and displays the highest-quality Fair Value Gap zones on the chart using a dynamic scoring system 1.1 Indicator Concept A Fair Value Gap (FVG) — also called a price imbalance — is a concept rooted in

Volume Divergence is fucking Trash!!
This isn’t just another lagging indicator. This strategy is a “Financial X-Ray” that combines Volume Delta with the precision of Trading Hub 3.0 to catch market reversals before they even hit the news