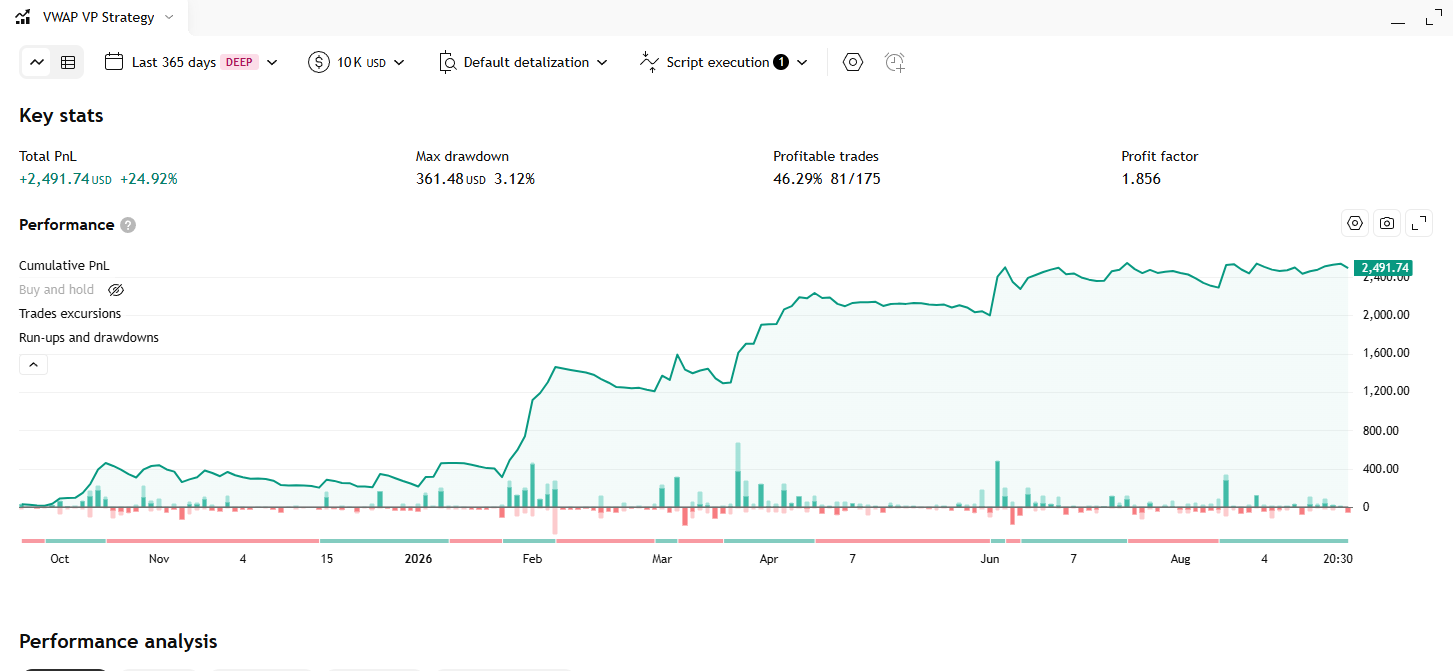
VWAP Volume Profile Indicator – Strategy

Một hồ sơ khối lượng hai chiều dựng trên đường VWAP thay vì trên giá: khối lượng của mỗi nến được gắn dấu cộng hoặc trừ tuỳ VWAP đang lên hay xuống, rồi gom lại thành biểu đồ cột nằm ngang chìa ra cả hai phía ở mép phải chart.
Read More »

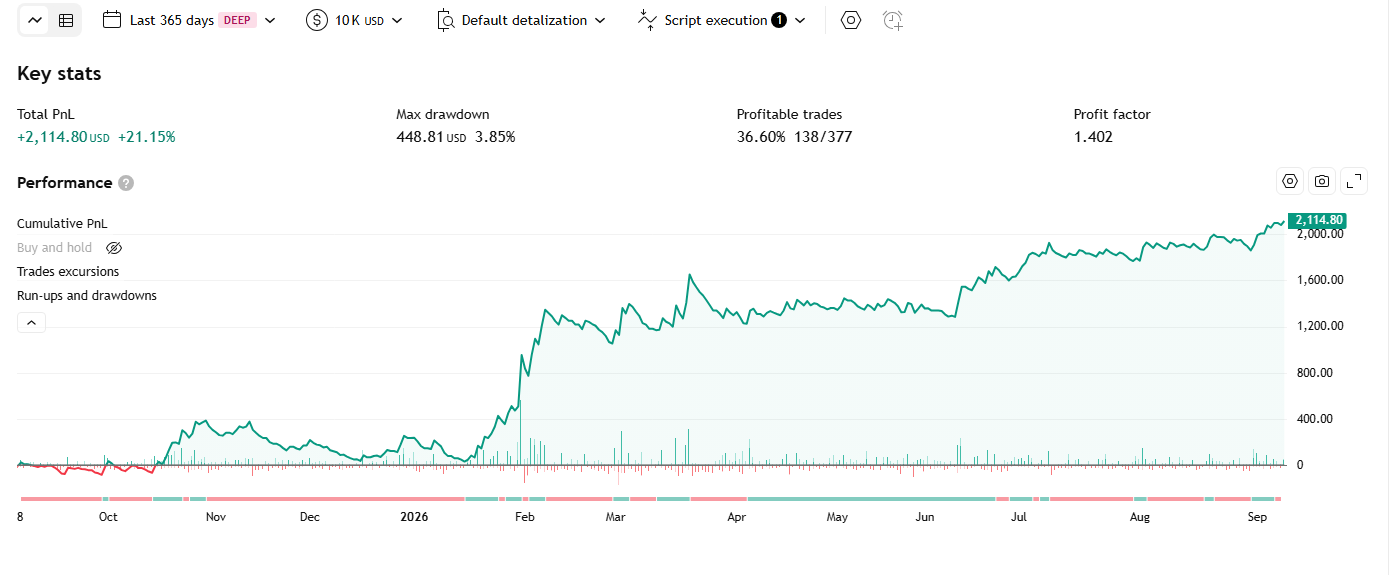
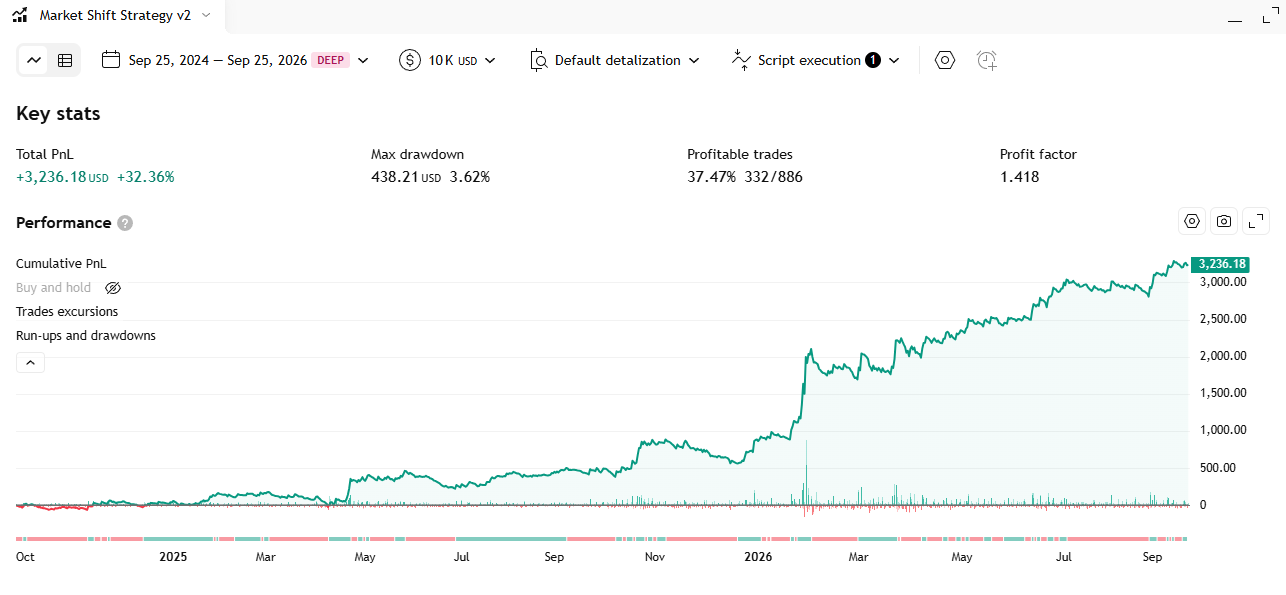
Market Shift Levels Indicator – Strategy

Every time the HMA moving average flips its slope, the indicator locks in the high or the low of that exact candle as a “boundary level”, colors every candle relative to it, and flags the moments price pokes through the level and immediately fails.

Read More »

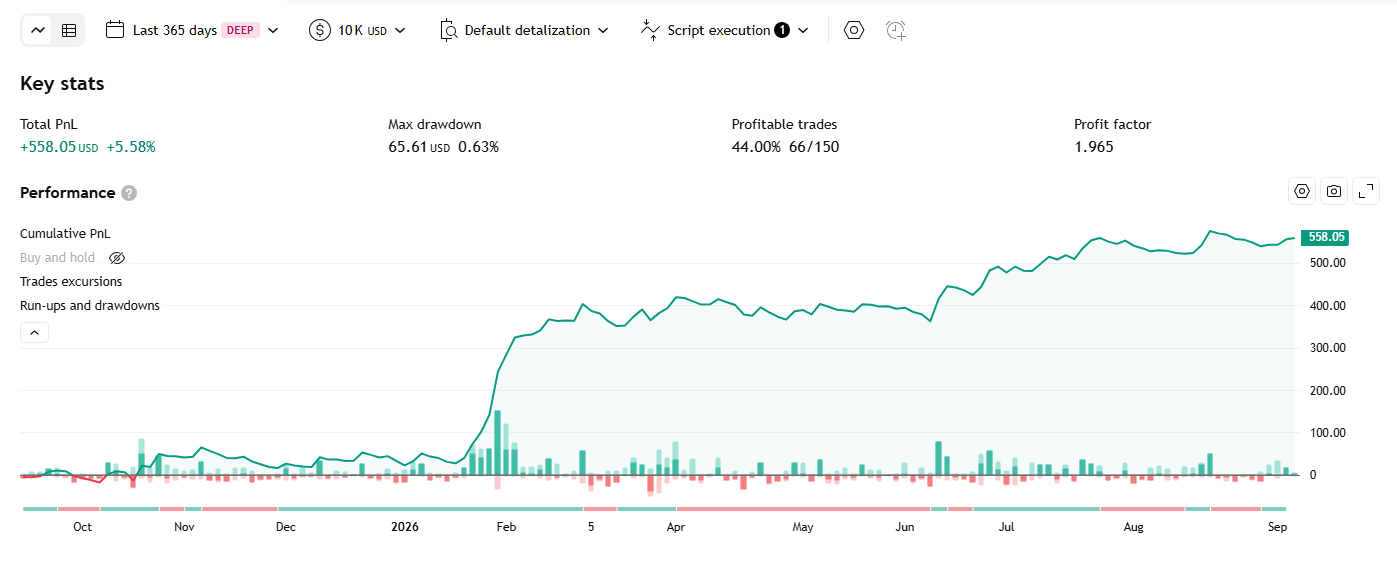
TP RSI Indicator – Strategy

An extended RSI: an adaptive neutral zone based on the RSI’s own volatility, a 5-layer EMA ribbon drawn on top of RSI itself, a Regular/Hidden divergence detector, and a second, fully independent Bollinger Bands overlay for visual reference.

Read More »

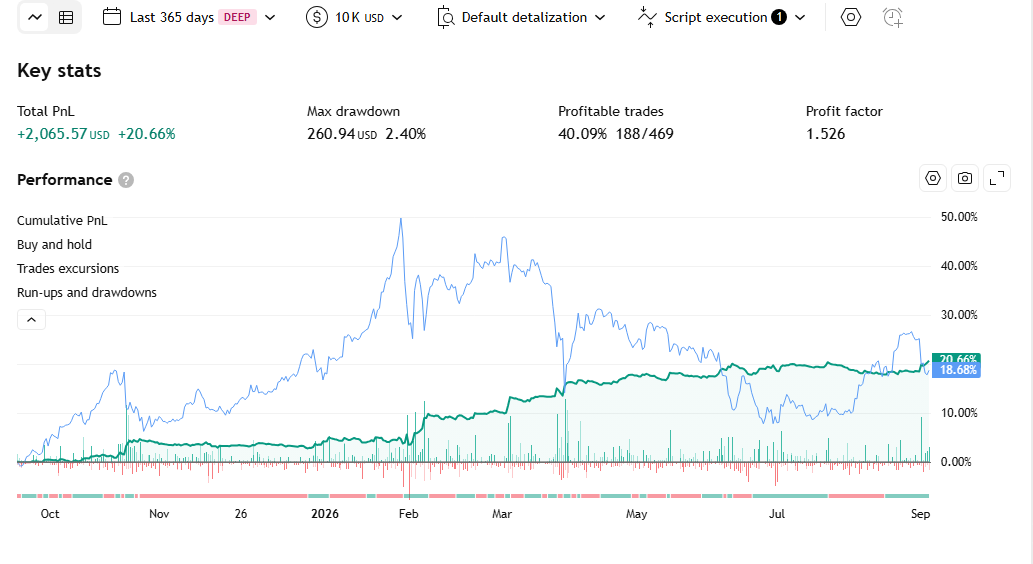
Trend Duration Forecast Indicator – Strategy

Determines trend direction from the slope of a Hull Moving Average (HMA), measures each trend’s actual duration, stores a rolling history of durations per direction, then uses that historical average to “forecast” how much longer the current trend might run.

Read More »