1. PRO Scalper Indicator Overview
An intraday analysis tool combining 5 key components to help scalpers see where the “real money flow” is moving.
1.1 Indicator Concept
PRO Scalper believes price doesn’t move purely by technicals; it also reflects where real order flow and liquidity concentrate.
Instead of relying only on moving averages or candlestick patterns, this indicator combines five core building blocks:
- Session VWAP — a daily “fair value anchor” where significant volume transacts
- Opening Range — the session’s first minutes shape an initial “balance frame,” often the launchpad of breakouts or fakeouts
- Trend Filter — uses fast/slow EMAs and optional ADX from a higher timeframe to detect strong trend vs. range
- Two independent Supply/Demand Zone pairs — zones drawn from swing pivots, each with a midline and touch counter to gauge reliability
- Order Flow Visuals — including:
- Delta Bubbles: green/red dots showing unusual buy/sell pressure using a safe delta proxy (no external data needed)
- Liquidity Densities: faint rectangular bands marking clusters of activity that act like “magnets” or “barriers,” and disappear once “eaten through” by strong volume
1.2 Indicator Features
Charted components:
- Thick yellow VWAP line — the session’s central anchor to judge “cheap” vs. “expensive” relative to fair value. Reversions to VWAP often offer entries.
- Two orange Opening Range lines — OR High and OR Low. Breaking out with strong volume often signals the day’s trend.
- Two EMA lines (teal and orange) — optional fast/slow EMAs from a higher timeframe to confirm overall trend: fast EMA > slow EMA = uptrend.
- Supply/Demand zone boxes:
- Light red box = Supply Zone — potential resistance where selling pressure may appear
- Light green box = Demand Zone — potential support where buying pressure may appear
- Gray dashed midline in each zone — balance point where reactions often confirm
- Label shows zone name (A/B) and touch count, e.g., Supply A (3) = Zone A has been tested 3 times
- Delta Bubbles:
- Green dot = unusually strong buying pressure (bullish)
- Red dot = unusually strong selling pressure (bearish)
- Dot size reflects intensity: larger = stronger pressure
- Placement: at candle low for strong buys; at candle high for strong sells
- Liquidity Densities:
- Faint rectangular bands in light green (demand side) or light red (supply side)
- Mark areas of unusually concentrated trading activity
- Optional gray dashed midline
- Bands auto-delete when price breaks through with high volume (i.e., “consumed”)
1.3 How to Use the Indicator
🎯 Scalping setup:
- Recommended timeframes: 1–5 minutes for the main chart; 15-minute or 1-hour for the trend filter (higher TF)
- Suitable markets: Crypto, index futures, and highly liquid forex pairs
📋 Concrete trading scenarios:
Scenario 1: Trend-Continuation Pullback Scalp
- Condition: Enable “Only in trend zones” (show only zones aligned with trend)
- Long setup (uptrend):
- Confirm uptrend: fast EMA > slow EMA, ADX > threshold (if used)
- Wait for pullback into a Demand Zone near VWAP or just below the Opening Range midline
- Look for green bubbles near the zone’s bottom or a liquidity density below price
- Enter LONG when a candle closes back above the zone’s midline
- Stop-loss: below the zone’s bottom or 1–1.5× ATR
- Take-profit: prior swing high, OR High, VWAP, or R:R targets (1:2, 1:3)
- Short setup (downtrend): mirror logic with Supply Zones, red bubbles, and density above price
Scenario 2: Fade the Sweep (reversal after liquidity grab)
- Condition: Neutral trend or allow counter-trend trades
- Setup:
- Price wicks beyond a zone boundary or OR line but the candle closes back inside
- Bubble color often flips (absorption): bullish wick but red bubble appears
- Enter toward the inside of the zone (fade the move)
- Stop-loss: beyond the sweep wick
- Take-profit: zone midline, then opposite boundary or VWAP
Scenario 3: Opening Range Breakout & Retest
- Setup:
- Wait for the Opening Range to complete
- Price breaks OR High or OR Low with a large bubble (strong intent)
- Wait for a retest of the OR boundary or a nearby zone confluent with VWAP
- Enter with confirmation (closing candle or same-direction bubble)
- Target: next zone or session extremities
Scenario 4: Density “Eaten” Continuation
- Setup:
- Monitor liquidity density bands
- When a band disappears abruptly on high volume = resting liquidity has been consumed
- Trade in the breakout direction, targeting the next opposite zone
1.4 How the Indicator Works
📥 Inputs & roles:
- ATR Length (atrLen = 14): lookback to compute Average True Range, used as a market volatility gauge. ATR sets zone and density depth for auto-adapting to each asset.
- Show VWAP / Show Opening Range (showVWAP, showOR): toggle VWAP and Opening Range display.
- Opening Range Settings:
- orMode: “Auto” (automatic = K × chart timeframe minutes) or “Manual” (fixed minutes)
- orAutoK = 3.0: multiplier with the chart timeframe
- orMin = 30: fixed minutes if Manual mode is used
- Trend Filter Settings:
- trendMode: “Off” / “EMA” / “EMA+ADX” — trend filter strictness
- useHTF: use a higher timeframe for trend
- tfHTF = “60”: higher timeframe (default 1 hour)
- emaFastLen = 34, emaSlowLen = 89: fast/slow EMA periods
- adxLen = 14, adxThr = 18: ADX length and threshold for strong trend
- Zone Settings:
- L1, R1 = 10, 10: left/right bars for pair A pivots (larger structure)
- L2, R2 = 5, 5: left/right bars for pair B pivots (smaller, intraday)
- zDepth = 0.6: zone depth = 0.6 × ATR
- zExtend = 120: forward bar extension for zones
- showZoneMid: show midline
- onlyTrendZone: show only trend-aligned zones
- Bubble Settings:
- deltaMode: “RangeWeighted” / “CloseVsPrev” / “CloseVsOpen” — proxy delta method
- qbLen = 200: lookback for percentile
- qbPct = 85%: draw bubbles only if delta exceeds the 85th percentile of the last 200 bars
- Density Settings:
- denMetricSrc: “AbsDelta” or “Volume” — metric for density
- qLen = 200, qPct = 92%: percentile filter
- denDepth = 0.45: density depth = 0.45 × ATR
- mergeX = 0.30: merge nearby densities if distance < 0.3 × ATR
- volLen = 20, breakMult = 1.2: delete density if volume > 1.2 × MA(20)
⚙️ Main logic blocks & roles:
- 1. Session-anchored VWAP:
- Formula: VWAP = cumulative (Typical Price × Volume) ÷ cumulative Volume
- Resets daily when a new session starts (ta.change(time("D")))
- Role: the day’s “center of mass,” where large volume has traded
- 2. Drawing the Opening Range:
- Compute OR bar count based on orMode
- While OR forms: track highest high and lowest low
- Plot two horizontal lines for OR High and OR Low
- Role: defines the initial “balance frame”—breaks often set the day’s trend
- 3. Trend Filter:
- Use higher-timeframe close if useHTF = true
- Compute fast and slow EMAs
- Compute Wilder’s ADX (manual, to avoid repaint):
- Compute +DM and -DM
- Compute True Range (TR)
- Smooth via RMA (Running Moving Average)
- Compute +DI and -DI, then DX, finally smooth DX to get ADX
- Determine longOK and shortOK based on:
- “Off”: both allowed
- “EMA”: fast EMA > slow EMA
- “EMA+ADX”: additionally ADX ≥ threshold
- Role: trade only trend-aligned zones; avoid chop
- 4. Delta Proxy:
- RangeWeighted (default): delta = volume × (close - open) / range
- CloseVsOpen: if close ≥ open, delta = +volume; else = -volume
- CloseVsPrev: compare close to close[1]
- Role: gauge buy/sell pressure without actual exchange order-flow data
- 5. Drawing Bubbles (Delta Bubbles):
- Absolute delta: absDel = |delta|
- Percentile threshold: thrBub = percentile(absDel, qbLen, qbPct)
- Draw only when absDel ≥ thrBub
- Color: delta ≥ 0 → green (buy); otherwise → red (sell)
- Bubble size scales with ratio = absDel / thrBub
- Role: highlight bars with unusual “effort,” hinting at liquidity bursts
- 6. Pivot Detection & Zone Drawing:
- Use ta.pivothigh() and ta.pivotlow() with left/right params to detect swing highs/lows
- Run two pivot pairs (A and B) with different periods
- On pivot high → create Supply Zone (red box):
- Top = pivot high
- Bottom = pivot high - (zDepth × ATR)
- On pivot low → create Demand Zone (green box):
- Bottom = pivot low
- Top = pivot low + (zDepth × ATR)
- Optional midline at zone center
- Count zone touches (touch counter) and display in the label
- If onlyTrendZone = true: hide counter-trend zones by setting color = transparent
- Role: objective S/R derived from actual price structure
- 7. Drawing Densities (Liquidity Densities):
- Select metric: AbsDelta or Volume
- Percentile threshold: denThr = percentile(denMetric, qLen, qPct)
- When metric ≥ denThr:
- Create a rectangular band around close
- Top = close + (denDepth × ATR)
- Bottom = close - (denDepth × ATR)
- Band color: green if delta ≥ 0 (demand), red if delta < 0 (supply)
- Merge nearby bands if distance < mergeX × ATR
- Deletion rules:
- Price breaks through the band (uptrend through demand band or downtrend through supply band)
- Volume > volMA × breakMult
- Or the band has existed too long (exceeds denExtend bars)
- Role: mark clustered liquidity; when “eaten,” continuations often follow
📤 Outputs & how to use them:
- Yellow VWAP → judge “fair value,” scalp on reversion or expansion from VWAP
- Opening Range (2 orange lines) → identify early-session breakout/fakeout
- EMA lines (optional) → HTF trend visual confirmation
- Supply/Demand zones (red/green boxes) → scalp entries, especially when confluenced with VWAP or OR
- Zone midlines → reaction confirmation inside zones
- Touch-counter labels → reliability gauge: many touches can weaken a zone
- Delta Bubbles (green/red dots) → confirm effort; combine with zones/VWAP for entries
- Density bands (faint) → anticipate magnets/halts or continuation once bands vanish
📊 Practical price-flow example:
Processing flow:
- Inputs: On each new bar, the indicator receives high, low, close, open, volume. Current ATR = 150 USDT (from the last 14 bars).
- VWAP logic: Accumulated from session open → current VWAP = 49,950 USDT → Price is a bit above VWAP.
- Opening Range logic: OR period finished; OR High = 50,200, OR Low = 49,800. Price is inside the OR.
- Trend Filter logic: HTF 1h: EMA(34) = 49,500, EMA(89) = 48,800 → uptrend. ADX = 25 > 18 → strong trend → longOK = true, shortOK = false
- Zone logic:
- Pair A (10L10R) detected a pivot low at 49,850 (5 bars ago) → Create Demand Zone A:
- Bottom = 49,850
- Top = 49,850 + (0.6 × 150) = 49,940
- Midline = (49,850 + 49,940) / 2 = 49,895
- This zone is trend-aligned (longOK = true) → display in stronger green
- Current price 50,000 is above this zone
- Pair A (10L10R) detected a pivot low at 49,850 (5 bars ago) → Create Demand Zone A:
- Delta logic: Last bar: close = 50,000, open = 49,980, high = 50,020, low = 49,970, volume = 100 BTC
- Range = 50,020 − 49,970 = 50
- Delta (RangeWeighted) = 100 × (50,000 − 49,980) / 50 = 100 × 20 / 50 = 40 BTC
- AbsDelta = 40 BTC
- Bubble threshold (85th percentile of last 200 bars) = 25 BTC
- 40 > 25 → draw a small green bubble at 49,970 (ratio = 40/25 = 1.6)
- Density logic: Metric = AbsDelta = 40 BTC; density threshold (92nd percentile) = 50 BTC
- 40 < 50 → no new density band this bar
- Existing densities monitored: delete if price breaks through with volume > 1.2 × MA(20)
- Rendered output:
- VWAP at 49,950
- OR High at 50,200, OR Low at 49,800
- Demand Zone A (green): 49,850 → 49,940, midline 49,895, label “Demand A (2)” = tested twice
- Small green bubble at 49,970 on the last candle
- Trader signal: Price is pulling back toward Demand Zone A. If price tags the zone and a green bubble appears, or a candle closes back above the 49,895 midline → valid long per Trend-Pullback scenario. Entry ~49,900, Stop ~49,820, Target ~50,200 (OR High).


Use the analysis above + the code below to instruct AI to modify the indicator and turn it into a trading bot—no coding required!
How to do it here -> 👉ZERO2HERO👈
					//@version=6
indicator("PRO Scalper",
     overlay=true, max_bars_back=1000, max_lines_count=500, max_labels_count=500, max_boxes_count=500)

// ═════════ Core
groupCore = "Core"
atrLen    = input.int(14, "ATR Len", minval=1, group=groupCore)
atr       = ta.atr(atrLen)

showVWAP  = input.bool(true, "Show Session VWAP", group=groupCore)
showOR    = input.bool(true,  "Show Opening Range", group=groupCore)
orAutoK   = input.float(3.0, "OR: Auto K × TF minutes", step=0.5, group=groupCore)
orMin     = input.int(30,    "OR: Manual minutes", minval=1, group=groupCore)
orMode    = input.string("Auto", "", options=["Auto","Manual"], group=groupCore)

tf_minutes() =>
    float m = na
    if timeframe.isseconds
        m := math.max(1.0, timeframe.multiplier) / 60.0
    else if timeframe.isminutes
        m := timeframe.multiplier
    else if timeframe.isdaily
        m := 1440.0 * timeframe.multiplier
    else if timeframe.isweekly
        m := 10080.0 * timeframe.multiplier
    else
        m := 43200.0 * timeframe.multiplier
    m

float tfMin = tf_minutes()

// ── Session-anchored VWAP (дневной якорь)
var float cumPV = na
var float cumV  = na
var bool  newSess = false
newSess := ta.change(time("D")) != 0

if newSess or na(cumPV)
    cumPV := 0
    cumV  := 0
cumPV += hlc3 * volume
cumV  += volume
vwap = cumV > 0 ? cumPV / cumV : na

// ── Opening Range
float orLenMin = orMode=="Auto" ? orAutoK*tfMin : orMin
int   orBars   = math.max(1, int(math.ceil(orLenMin / math.max(tfMin, 1))))

var float orH = na
var float orL = na
var int   bfo = 0

if newSess
    orH := na
    orL := na
    bfo := 0

if bfo < orBars
    orH := na(orH) ? high : math.max(orH, high)
    orL := na(orL) ? low  : math.min(orL, low)
    bfo += 1

plot(showVWAP ? vwap : na, "VWAP", color=color.new(color.yellow, 0), linewidth=2)
plot(showOR and bfo>0 ? orH : na, "OR High", color=color.new(color.orange, 0), linewidth=2, style=plot.style_linebr)
plot(showOR and bfo>0 ? orL : na, "OR Low",  color=color.new(color.orange, 0), linewidth=2, style=plot.style_linebr)

// ═════════ Trend Filter (EMA / EMA+ADX, HTF опционально)
groupTrend  = "Trend Filter"
trendMode   = input.string("Off", "Mode", options=["Off","EMA","EMA+ADX"], group=groupTrend)
useHTF      = input.bool(true, "Use HTF for filter", group=groupTrend)
tfHTF       = input.timeframe("60", "HTF timeframe", group=groupTrend)
emaFastLen  = input.int(34, "EMA Fast", minval=1, group=groupTrend)
emaSlowLen  = input.int(89, "EMA Slow", minval=2, group=groupTrend)
adxLen      = input.int(14, "ADX Len", minval=1, group=groupTrend)
adxThr      = input.float(18, "ADX ≥", step=0.5, group=groupTrend)
showTrendPl = input.bool(false, "Plot EMA filter", group=groupTrend)

// — безопасный ADX (Wilder), без ta.adx/ta.dx
adxCalc(_len) =>
    upMove   = high - high[1]
    downMove = low[1] - low
    plusDM   = (upMove > downMove and upMove > 0) ? upMove : 0.0
    minusDM  = (downMove > upMove and downMove > 0) ? downMove : 0.0
    tr   = math.max(high - low, math.max(math.abs(high - close[1]), math.abs(low - close[1])))
    smTR = ta.rma(tr, _len)
    smP  = ta.rma(plusDM, _len)
    smM  = ta.rma(minusDM, _len)
    plusDI  = smTR != 0 ? 100.0 * smP / smTR : 0.0
    minusDI = smTR != 0 ? 100.0 * smM / smTR : 0.0
    dx = (plusDI + minusDI != 0) ? 100.0 * math.abs(plusDI - minusDI) / (plusDI + minusDI) : 0.0
    ta.rma(dx, _len)

srcClose = useHTF ? request.security(syminfo.tickerid, tfHTF, close) : close
emaF     = ta.ema(srcClose, emaFastLen)
emaS     = ta.ema(srcClose, emaSlowLen)
trendUp  = emaF > emaS
adxTF    = useHTF ? request.security(syminfo.tickerid, tfHTF, adxCalc(adxLen)) : adxCalc(adxLen)

longOK  = trendMode=="Off" ? true : trendMode=="EMA" ? trendUp : (trendUp and adxTF >= adxThr)
shortOK = trendMode=="Off" ? true : trendMode=="EMA" ? not trendUp : ((not trendUp) and adxTF >= adxThr)

plot(showTrendPl ? emaF : na, "EMA F", color=color.new(color.teal, 0))
plot(showTrendPl ? emaS : na, "EMA S", color=color.new(color.orange, 0))

// ═════════ Delta proxy (для пузырьков/плотностей)
groupDelta = "Delta / Volume"
deltaMode  = input.string("RangeWeighted", "Delta proxy", options=["RangeWeighted","CloseVsPrev","CloseVsOpen"], group=groupDelta)

rng = math.max(high - low, syminfo.mintick)
dRW = rng > 0 ? volume * (close - open) / rng : 0
dCP = close >= close[1] ? volume : -volume
dCO = close >= open     ? volume : -volume
delta = deltaMode=="RangeWeighted" ? dRW : deltaMode=="CloseVsOpen" ? dCO : dCP

// ═════════ Bubbles
groupBub = "Bubbles"
showBub  = input.bool(true, "Show Bubbles (abs delta)", group=groupBub)
qbLen    = input.int(200, "Quantile lookback", minval=50, group=groupBub)
qbPct    = input.float(85,  "Quantile %", step=0.5, minval=50, maxval=99.9, group=groupBub)

absDel = math.abs(delta)
thrBub = ta.percentile_linear_interpolation(absDel, qbLen, qbPct)

bubbleSize(r)=>
    s = size.tiny
    if r >= 3
        s := size.huge
    else if r >= 2.25
        s := size.large
    else if r >= 1.6
        s := size.normal
    else if r >= 1.1
        s := size.small
    s

if showBub and absDel >= math.max(thrBub, 1)
    ratio = absDel / math.max(thrBub, 1)
    y  = delta>=0 ? low : high
    c0 = delta>=0 ? color.lime : color.red
    c  = color.new(c0, 85 - int(math.min(60.0, (ratio-1.0)*30.0)))
    label.new(bar_index, y, "", xloc=xloc.bar_index, yloc=yloc.price, style=label.style_circle, color=c, textcolor=c, size=bubbleSize(ratio))

// ═════════ Zones x2 (midline + only-in-trend)
groupZ = "Zones (AI-style, 2 pairs)"
showZones = input.bool(true, "Show Zones", group=groupZ)
zDepth    = input.float(0.6, "Zone depth × ATR", step=0.05, group=groupZ)
zExtend   = input.int(120, "Extend (bars)", minval=10, group=groupZ)
L1 = input.int(10, "Pivot A Left",  minval=2, group=groupZ)
R1 = input.int(10, "Pivot A Right", minval=2, group=groupZ)
L2 = input.int(5,  "Pivot B Left",  minval=2, group=groupZ)
R2 = input.int(5,  "Pivot B Right", minval=2, group=groupZ)
showZoneMid   = input.bool(true,  "Show zone midline", group=groupZ)
onlyTrendZone = input.bool(false, "Show only in-trend zones", group=groupZ)
labSize = input.string("Small", "Label size", options=["Tiny","Small","Normal"], group=groupZ)
_lsize  = labSize=="Tiny" ? size.tiny : labSize=="Small" ? size.small : size.normal

colSupIn  = color.new(#E57373, 76)
colSupOut = color.new(#E57373, 96)
colSupBrI = color.new(#E57373, 25)
colSupBrO = color.new(#E57373, 90)
colDemIn  = color.new(#81C784, 76)
colDemOut = color.new(#81C784, 96)
colDemBrI = color.new(#81C784, 25)
colDemBrO = color.new(#81C784, 90)
colHide   = color.new(color.white, 100)
midCol    = color.new(color.gray, 50)

mkZone(_left, _top, _bot, isSupply, _right, inTrend) =>
    color fill = isSupply ? (inTrend ? colSupIn : colSupOut) : (inTrend ? colDemIn : colDemOut)
    color brd  = isSupply ? (inTrend ? colSupBrI : colSupBrO) : (inTrend ? colDemBrI : colDemBrO)
    box.new(_left, _top, _right, _bot, xloc=xloc.bar_index, bgcolor=fill, border_color=brd)

type PairState
    box   sup
    float supTop
    float supBot
    line  supMid
    box   dem
    float demTop
    float demBot
    line  demMid
    int   supTouches
    int   demTouches
    bool  inSupPrev
    bool  inDemPrev
    label labSup
    label labDem

makeMidline(x0, mid) =>
    line.new(x0, mid, x0 + zExtend, mid, xloc=xloc.bar_index, extend=extend.none, style=line.style_dashed, color=midCol, width=1)

updatePair(ph, pl, R, PairState s, string tag) =>
    box supRet = s.sup
    float sTop = s.supTop
    float sBot = s.supBot
    line sMidL = s.supMid
    box demRet = s.dem
    float dTop = s.demTop
    float dBot = s.demBot
    line dMidL = s.demMid
    int  supT  = s.supTouches
    int  demT  = s.demTouches
    bool wasS  = s.inSupPrev
    bool wasD  = s.inDemPrev
    label lSup = s.labSup
    label lDem = s.labDem

    if showZones and not na(ph)
        sTop := ph
        sBot := ph - zDepth * atr
        int x0 = bar_index - R
        if not na(supRet)
            box.delete(supRet)
        if not na(sMidL)
            line.delete(sMidL)
        supRet := mkZone(x0, sTop, sBot, true, bar_index + zExtend, shortOK)
        if showZoneMid
            sMidL := makeMidline(x0, (sTop + sBot) * 0.5)
        supT := 0
        wasS := false
        if not na(lSup)
            label.delete(lSup)
        lSup := label.new(x0, sTop, "Supply " + tag + " (0)", xloc=xloc.bar_index, yloc=yloc.price, style=label.style_label_left, size=_lsize, color=color.new(color.black, 100), textcolor=color.white)

    if showZones and not na(pl)
        dBot := pl
        dTop := pl + zDepth * atr
        int x1 = bar_index - R
        if not na(demRet)
            box.delete(demRet)
        if not na(dMidL)
            line.delete(dMidL)
        demRet := mkZone(x1, dTop, dBot, false, bar_index + zExtend, longOK)
        if showZoneMid
            dMidL := makeMidline(x1, (dTop + dBot) * 0.5)
        demT := 0
        wasD := false
        if not na(lDem)
            label.delete(lDem)
        lDem := label.new(x1, dBot, "Demand " + tag + " (0)", xloc=xloc.bar_index, yloc=yloc.price, style=label.style_label_left, size=_lsize, color=color.new(color.black, 100), textcolor=color.white)

    bool supInTrend = shortOK
    bool demInTrend = longOK

    if not na(supRet)
        if onlyTrendZone and not supInTrend
            box.set_bgcolor(supRet, colHide), box.set_border_color(supRet, colHide)
            if not na(lSup)
                label.delete(lSup), lSup := na
            if not na(sMidL)
                line.delete(sMidL), sMidL := na
        else
            box.set_bgcolor(supRet, supInTrend ? colSupIn : colSupOut)
            box.set_border_color(supRet, supInTrend ? colSupBrI : colSupBrO)
            if showZoneMid and na(sMidL)
                sMidL := makeMidline(box.get_left(supRet), (sTop + sBot) * 0.5)
            if na(lSup)
                lSup := label.new(box.get_left(supRet), sTop, "Supply " + tag + " (" + str.tostring(supT) + ")", xloc=xloc.bar_index, yloc=yloc.price, style=label.style_label_left, size=_lsize, color=color.new(color.black, 100), textcolor=color.white)

    if not na(demRet)
        if onlyTrendZone and not demInTrend
            box.set_bgcolor(demRet, colHide), box.set_border_color(demRet, colHide)
            if not na(lDem)
                label.delete(lDem), lDem := na
            if not na(dMidL)
                line.delete(dMidL), dMidL := na
        else
            box.set_bgcolor(demRet, demInTrend ? colDemIn : colDemOut)
            box.set_border_color(demRet, demInTrend ? colDemBrI : colDemBrO)
            if showZoneMid and na(dMidL)
                dMidL := makeMidline(box.get_left(demRet), (dTop + dBot) * 0.5)
            if na(lDem)
                lDem := label.new(box.get_left(demRet), dBot, "Demand " + tag + " (" + str.tostring(demT) + ")", xloc=xloc.bar_index, yloc=yloc.price, style=label.style_label_left, size=_lsize, color=color.new(color.black, 100), textcolor=color.white)

    bool inS = not na(sTop) and not na(sBot) and high >= sBot and low <= sTop
    bool inD = not na(dTop) and not na(dBot) and high >= dBot and low <= dTop
    if inS and not wasS
        supT += 1
    wasS := inS
    if inD and not wasD
        demT += 1
    wasD := inD

    if not na(lSup)
        label.set_x(lSup, not na(supRet) ? box.get_left(supRet) : bar_index)
        label.set_y(lSup, sTop)
        label.set_text(lSup, "Supply " + tag + " (" + str.tostring(supT) + ")")
    if not na(lDem)
        label.set_x(lDem, not na(demRet) ? box.get_left(demRet) : bar_index)
        label.set_y(lDem, dBot)
        label.set_text(lDem, "Demand " + tag + " (" + str.tostring(demT) + ")")

    PairState.new(supRet, sTop, sBot, sMidL, demRet, dTop, dBot, dMidL, supT, demT, wasS, wasD, lSup, lDem)

// Глобальные состояния пар
var PairState pairA = PairState.new(na, na, na, na, na, na, na, na, 0, 0, false, false, na, na)
var PairState pairB = PairState.new(na, na, na, na, na, na, na, na, 0, 0, false, false, na, na)

// Обновление пар
phA = ta.pivothigh(high, L1, R1)
plA = ta.pivotlow(low,  L1, R1)
pairA := updatePair(phA, plA, R1, pairA, "A")

phB = ta.pivothigh(high, L2, R2)
plB = ta.pivotlow(low,  L2, R2)
pairB := updatePair(phB, plB, R2, pairB, "B")

// Продление вправо (боксы + midlines)
extendBox(_b) =>
    if not na(_b)
        box.set_right(_b, bar_index + zExtend)
extendLine(_l, y) =>
    if not na(_l)
        line.set_x2(_l, bar_index + zExtend)
        if not na(y)
            line.set_y1(_l, y), line.set_y2(_l, y)

extendBox(pairA.sup), extendBox(pairA.dem), extendBox(pairB.sup), extendBox(pairB.dem)
extendLine(pairA.supMid, na(pairA.supTop) or na(pairA.supBot) ? na : (pairA.supTop + pairA.supBot)*0.5)
extendLine(pairA.demMid, na(pairA.demTop) or na(pairA.demBot) ? na : (pairA.demTop + pairA.demBot)*0.5)
extendLine(pairB.supMid, na(pairB.supTop) or na(pairB.supBot) ? na : (pairB.supTop + pairB.supBot)*0.5)
extendLine(pairB.demMid, na(pairB.demTop) or na(pairB.demBot) ? na : (pairB.demTop + pairB.demBot)*0.5)

// ═════════ Subtle Densities
groupDen     = "Densities (Subtle)"
showDen      = input.bool(true, "Show Densities", group=groupDen)
denMetricSrc = input.string("AbsDelta", "Metric", options=["AbsDelta","Volume"], group=groupDen)
qLen         = input.int(200, "Quantile lookback", minval=50, group=groupDen)
qPct         = input.float(92, "Quantile %", step=0.5, minval=60, maxval=99.9, group=groupDen)
denDepth     = input.float(0.45, "Depth × ATR", step=0.05, group=groupDen)
denExtend    = input.int(150, "Extend (bars)", minval=10, group=groupDen)
mergeX       = input.float(0.30, "Merge if |Δprice| < ×ATR", step=0.05, group=groupDen)
volLen       = input.int(20, "Volume MA", group=groupDen)
breakMult    = input.float(1.2, "Delete if break vol > MA×", step=0.1, group=groupDen)
showMidLineD = input.bool(true, "Midline (dashed)", group=groupDen)

denMetric = denMetricSrc=="AbsDelta" ? math.abs(delta) : volume
denThr    = ta.percentile_linear_interpolation(denMetric, qLen, qPct)
volMA     = ta.sma(volume, volLen)

var box[]  dBoxes = array.new_box()
var line[] dLines = array.new_line()
var float[] dTop  = array.new_float()
var float[] dBot  = array.new_float()
var float[] dMid  = array.new_float()
var int[]   dEnd  = array.new_int()
var int[]   dDir  = array.new_int()

newDensity(mid, isDemand) =>
    float half = atr * denDepth
    float top  = mid + half
    float bot  = mid - half
    color fillCol = isDemand ? color.new(#4CAF50, 90) : color.new(#F44336, 90)
    color brdCol  = isDemand ? color.new(#4CAF50, 60) : color.new(#F44336, 60)
    box b = box.new(bar_index, top, bar_index, bot, xloc=xloc.bar_index, bgcolor=fillCol, border_color=brdCol)
    line ln = na
    if showMidLineD
        ln := line.new(bar_index, mid, bar_index, mid, xloc=xloc.bar_index, extend=extend.right, color=color.new(color.gray, 50), style=line.style_dashed, width=1)
    array.push(dBoxes, b), array.push(dLines, ln), array.push(dTop, top), array.push(dBot, bot), array.push(dMid, mid)
    array.push(dEnd, bar_index + denExtend), array.push(dDir, isDemand ? 1 : -1)

if showDen and denMetric >= denThr
    mid = close
    bool merged = false
    sz = array.size(dBoxes)
    if sz > 0
        for i=0 to sz-1
            if not merged and math.abs(mid - array.get(dMid, i)) <= atr*mergeX
                array.set(dEnd, i, bar_index + denExtend)
                merged := true
    if not merged
        newDensity(mid, delta>=0)

sz2 = array.size(dBoxes)
if sz2 > 0
    for i = sz2-1 to 0
        b   = array.get(dBoxes, i)
        ln  = array.get(dLines, i)
        top = array.get(dTop, i)
        bot = array.get(dBot, i)
        mid = array.get(dMid, i)
        right = math.min(bar_index + 1, array.get(dEnd, i))
        box.set_right(b, right)
        if not na(ln)
            line.set_x2(ln, right)
            line.set_y1(ln, mid)
            line.set_y2(ln, mid)
        dir = array.get(dDir, i)
        bool breakUp   = close > top and volume > volMA*breakMult
        bool breakDown = close < bot and volume > volMA*breakMult
        bool eaten = (dir==1 and breakDown) or (dir==-1 and breakUp)
        if eaten or bar_index >= array.get(dEnd, i)
            box.delete(b)
            if not na(ln)
                line.delete(ln)
            array.remove(dBoxes, i), array.remove(dLines, i), array.remove(dTop, i), array.remove(dBot, i), array.remove(dMid, i), array.remove(dEnd, i), array.remove(dDir, i)
Indicator Insider
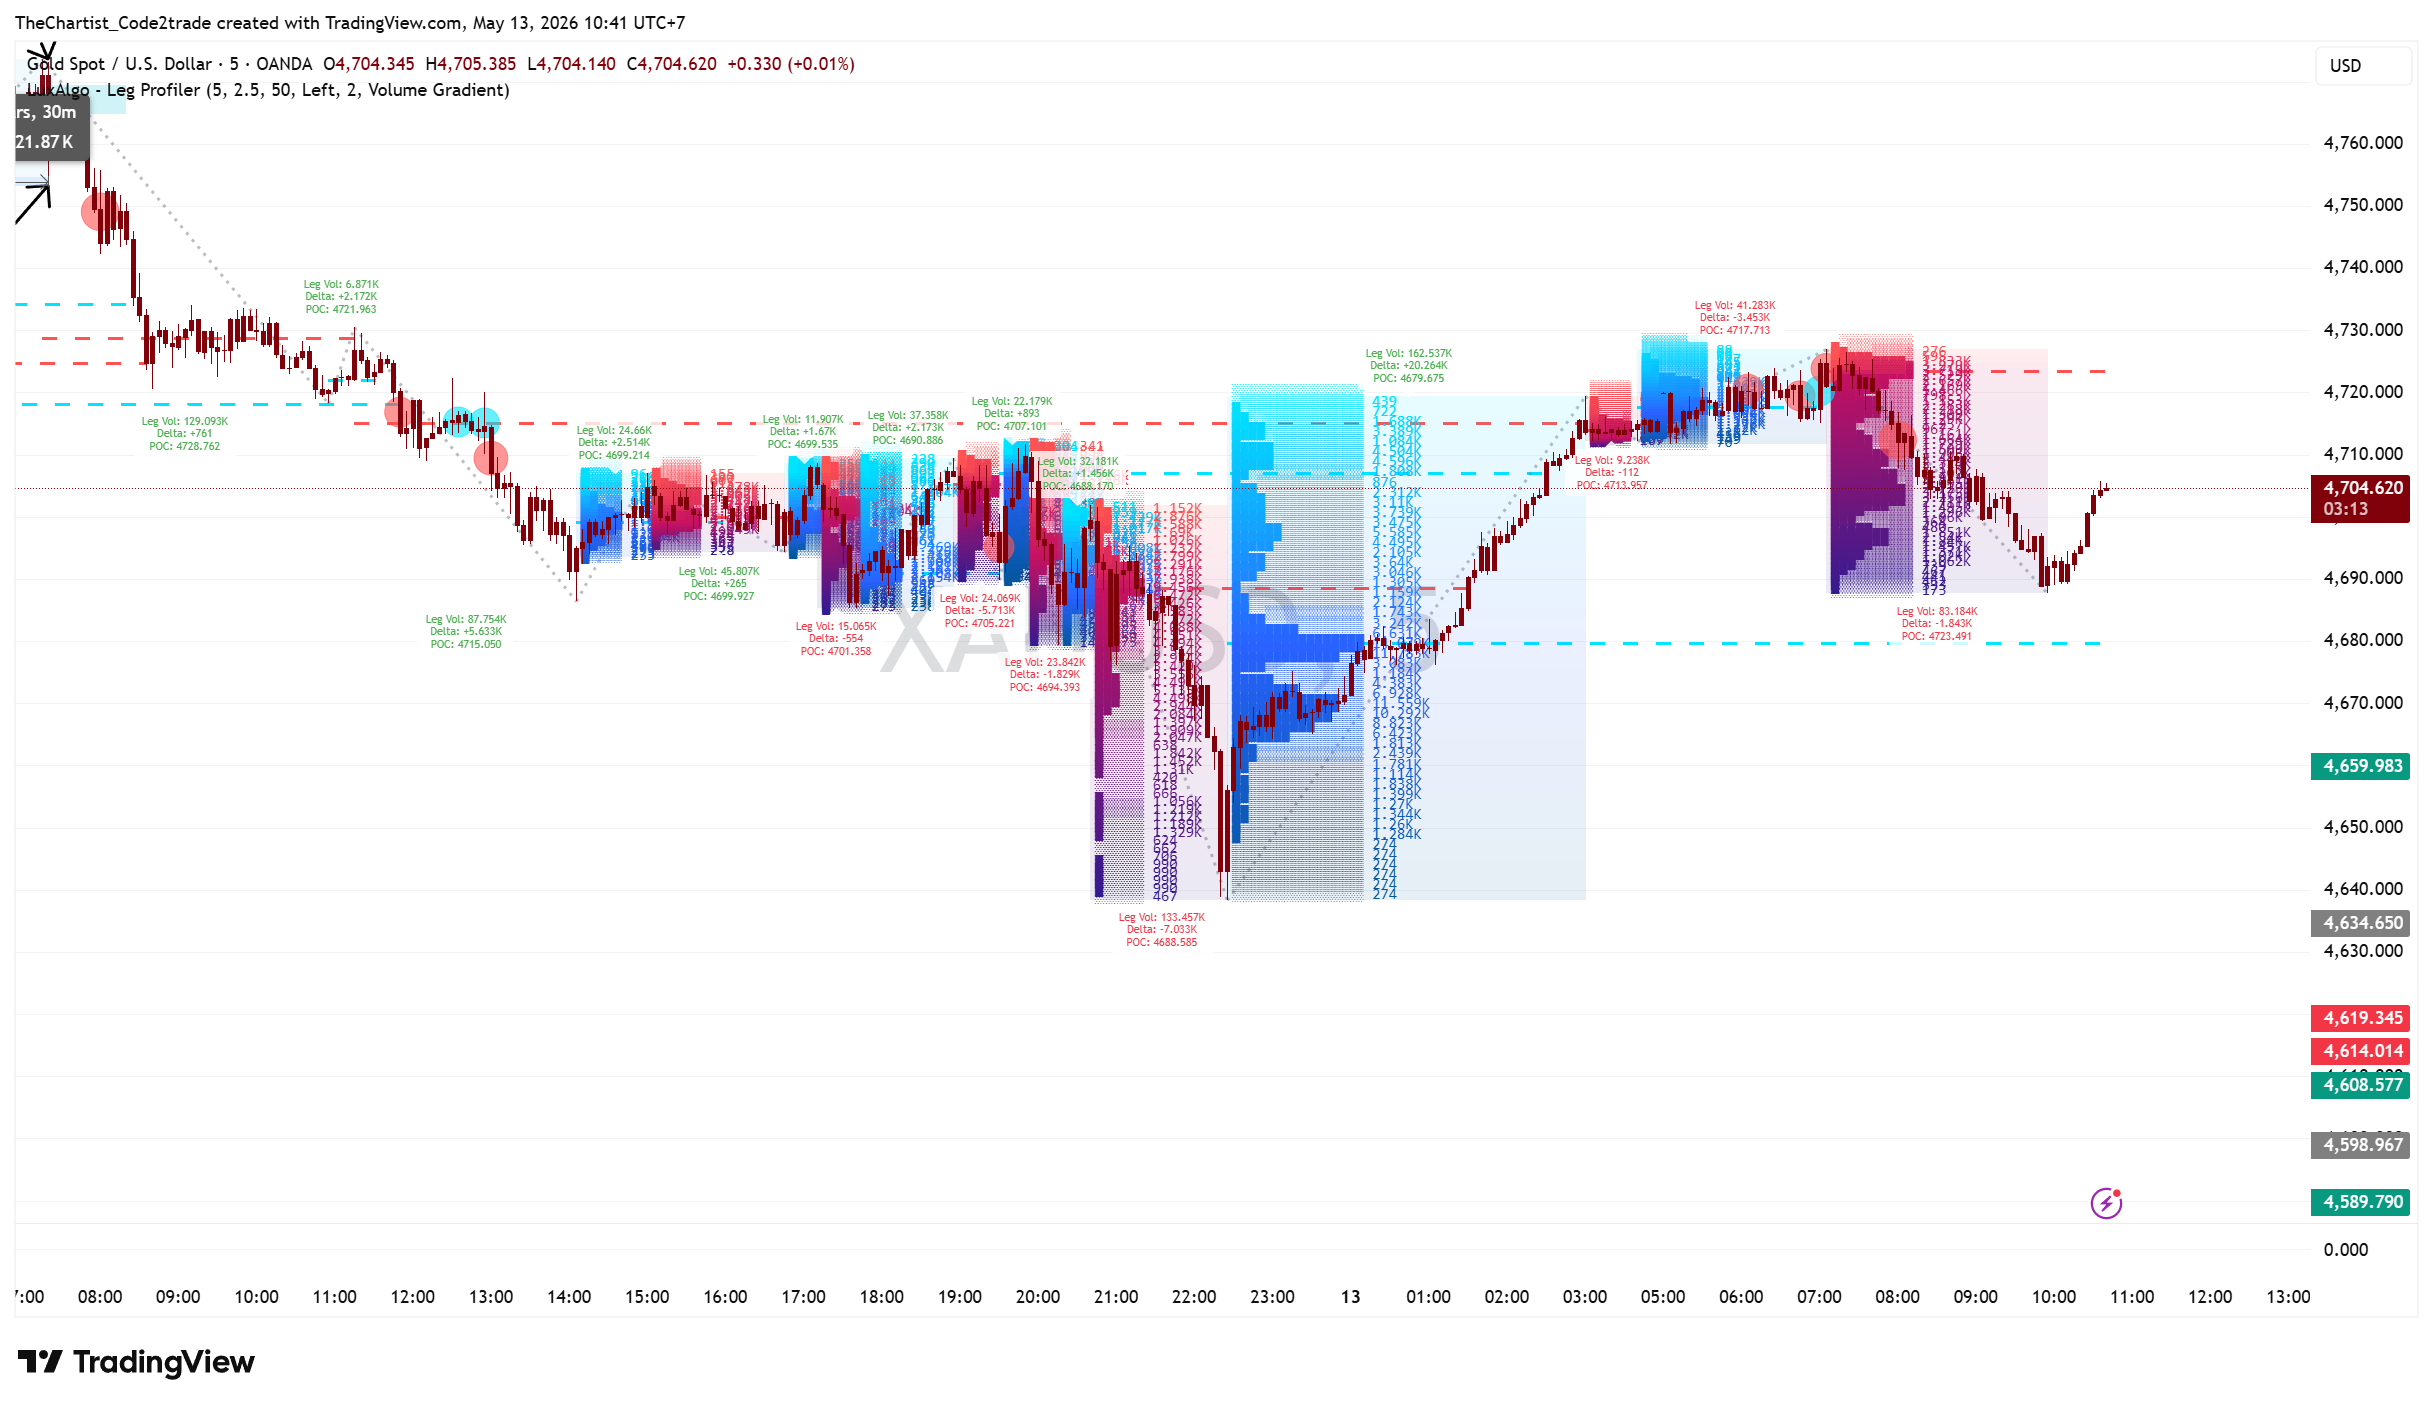
04 Structural Leg Profiler [LuxAlgo]
Isolated Scroll Container 1. Cup & Handle Indicator Description (Zeiierman) An indicator that automatically detects the Cup & Handle pattern – one of the most classic chart patterns in technical analysis 1.1 Indicator Concept The Cup & Handle indicator is based on the theory of market psychology patterns discovered by
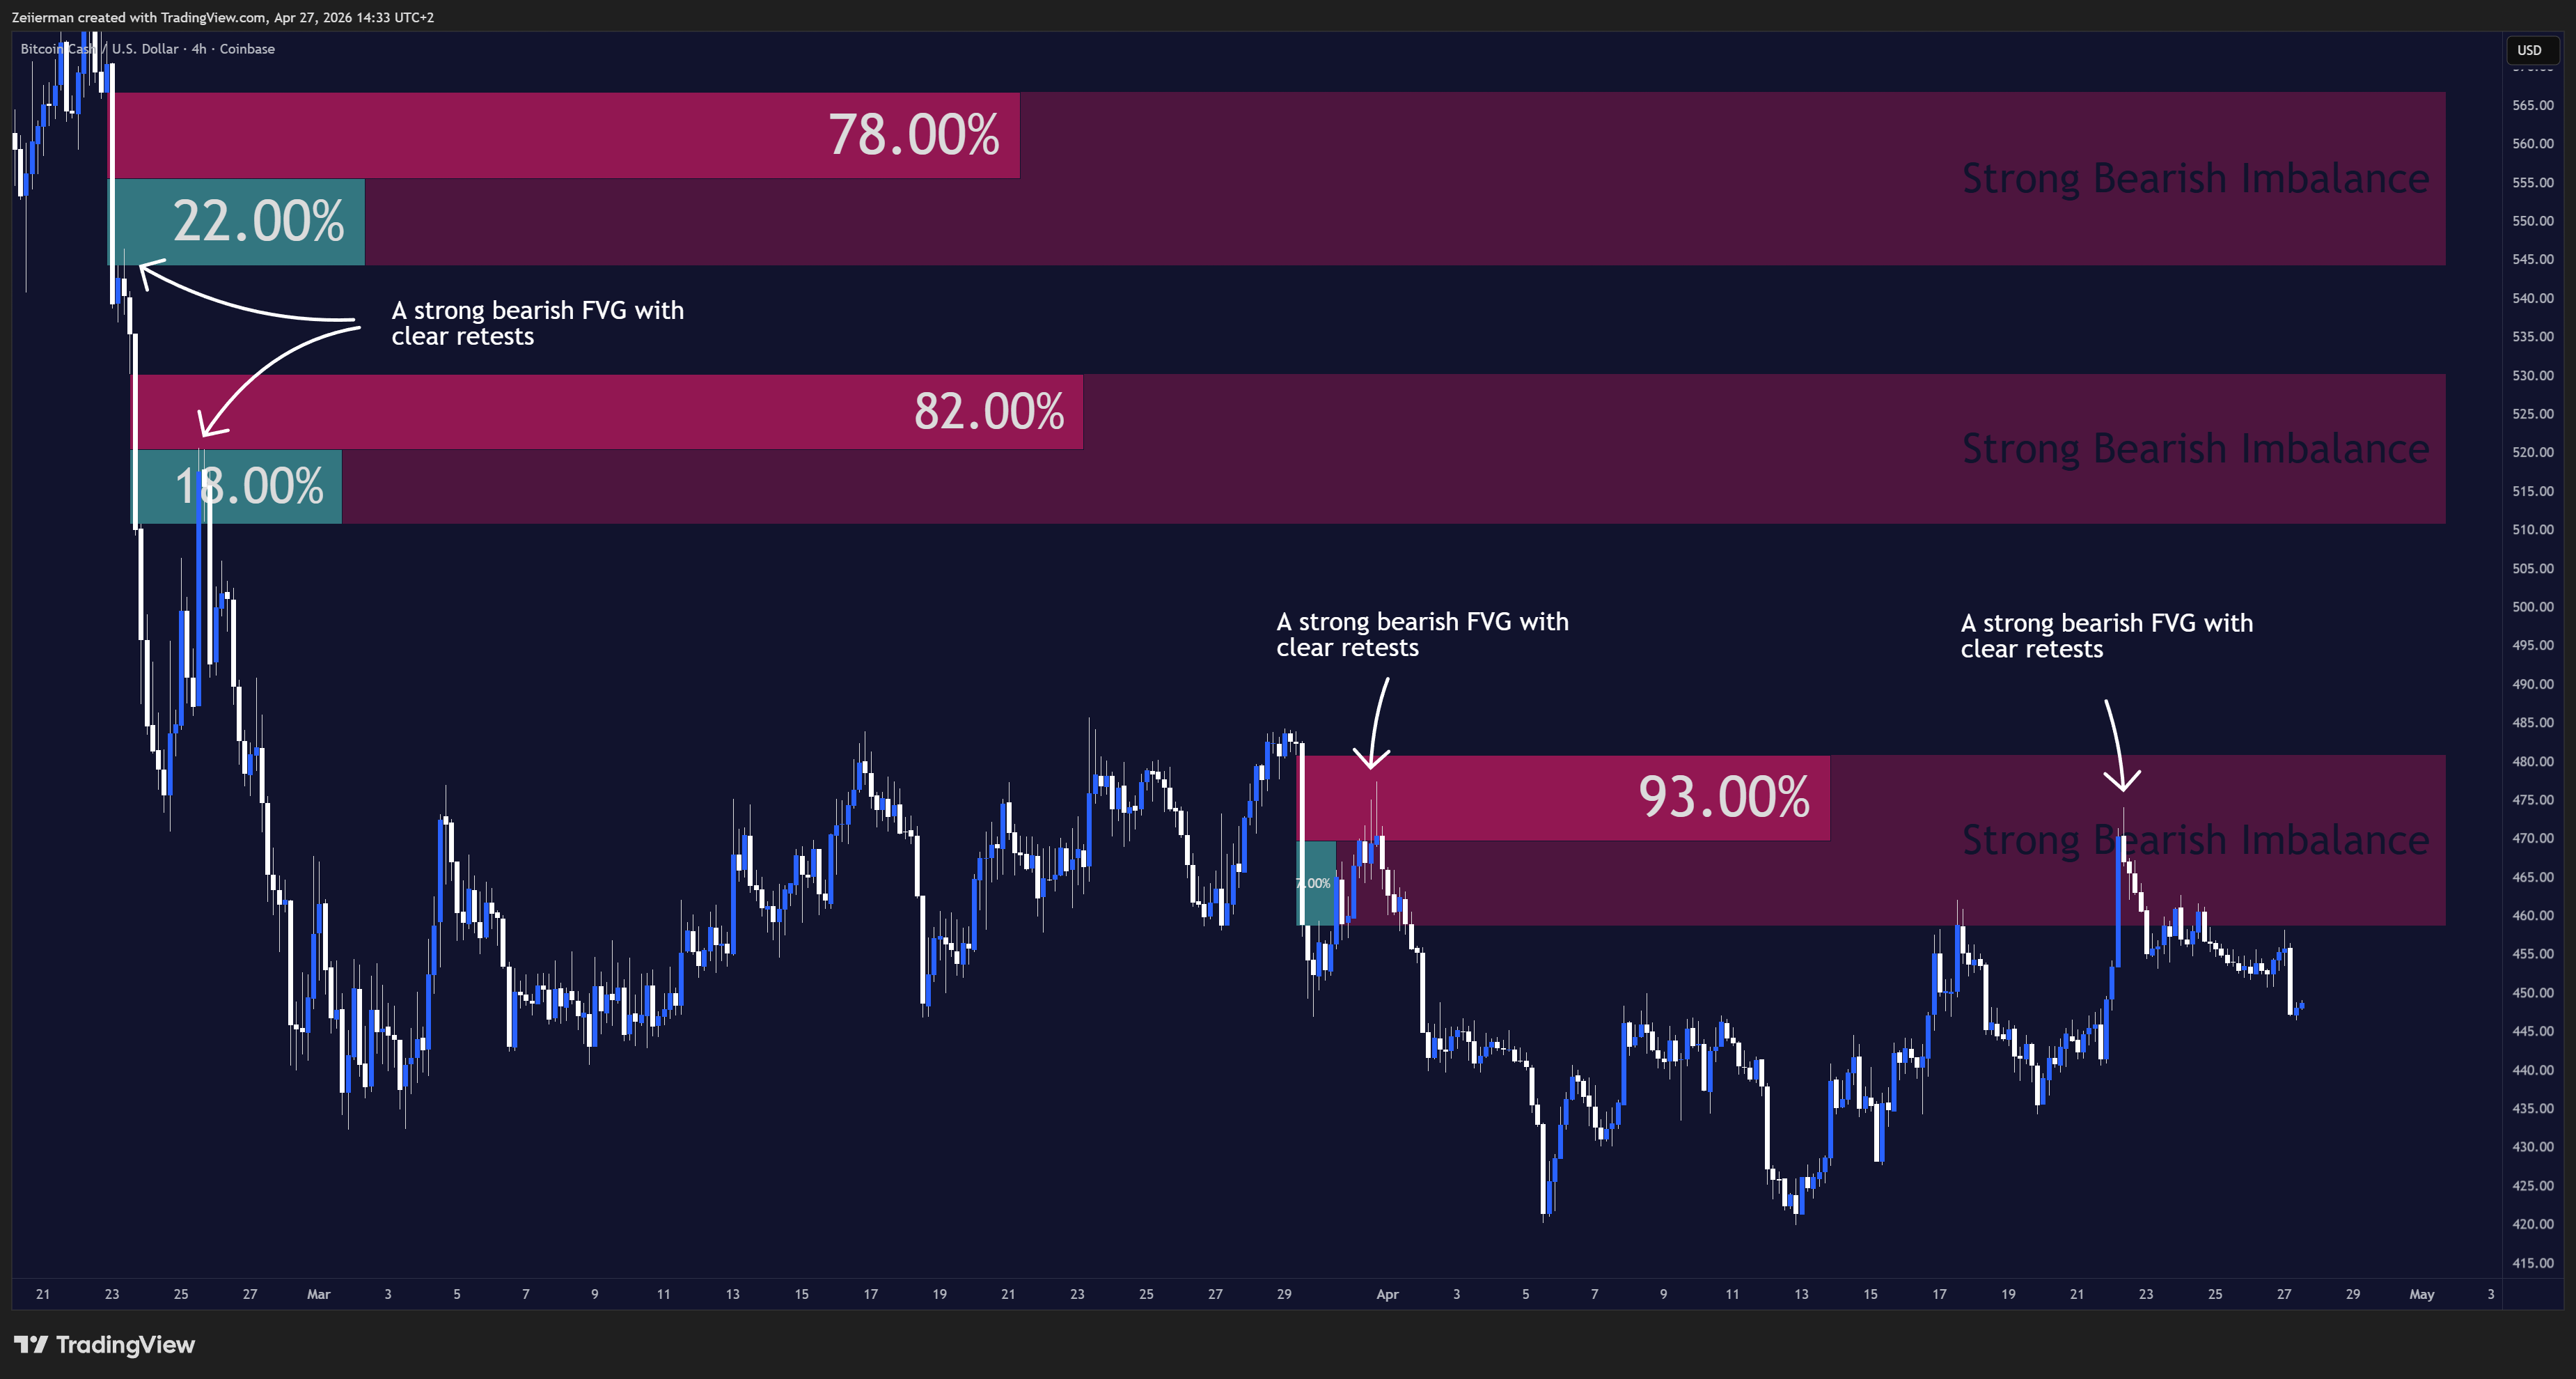
03 Ranked FVG
Isolated Scroll Container 1. Indicator Description – Ranked FVG Imbalance Zones (Zeiierman) Detects, ranks, and displays the highest-quality Fair Value Gap zones on the chart using a dynamic scoring system 1.1 Indicator Concept A Fair Value Gap (FVG) — also called a price imbalance — is a concept rooted in

Volume Divergence is fucking Trash!!
This isn’t just another lagging indicator. This strategy is a “Financial X-Ray” that combines Volume Delta with the precision of Trading Hub 3.0 to catch market reversals before they even hit the news