1. Cup & Handle Indicator Description (Zeiierman)
An indicator that automatically detects the Cup & Handle pattern - one of the most classic chart patterns in technical analysis
1.1 Indicator Concept
The Cup & Handle indicator is based on the theory of market psychology patterns discovered by William O'Neil. This pattern believes that:
- Cup Phase: Represents the process where price gradually declines, forms a bottom, then recovers back to the initial level. This is the market "consolidation" phase after a previous uptrend, where weak sellers exit and strong buyers accumulate.
- Handle Phase: After the cup forms, price has a small pullback creating the handle. This is the final "test" before the breakout.
- Breakout: When price breaks above the cup's rim, this signals a strong uptrend is about to occur, with a price target equal to the cup's depth.
This indicator automatically detects both bullish patterns (Cup & Handle) and bearish patterns (Inverted Cup & Handle) based on price pivot points (swing highs/lows).
1.2 Indicator Features
-
Display Cup & Handle Pattern:
- Cup Curve: Drawn with curved polyline connecting 3 points: left rim → cup bottom → right rim. Green for bullish pattern, red for bearish pattern.
- Handle Curve: Drawn from right rim → handle low → projected breakout point. Same color as cup.
- Filled Area: Light color fill inside cup and handle for easy identification.
- Pattern Label: Displays "Cup+Handle" or "Inv Cup+Handle" text at cup center.
- Target Line: Horizontal line showing price target after breakout, calculated as: Rim Price ± (Cup Depth × Target Multiplier)
-
Alerts:
- "Cup & Handle (Brewed)": Triggers when valid bullish pattern is detected.
- "Inverted Cup & Handle (Brewed)": Triggers when valid bearish pattern is detected.
1.3 How to Use the Indicator
- Identify Entry Opportunities: When the indicator draws a Cup & Handle pattern and price breaks out from the rim (if "Require breakout confirmation" is enabled), this is a signal to enter BUY (bullish pattern) or SELL (bearish pattern).
- Set Take Profit Target: Use the Target Line as the profit-taking level. Default is 0.5× cup depth, adjustable via "Target multiplier".
- Set Stop Loss: Place SL below the "Invalidation" level (default 61.8% of handle depth from rim). If price touches this level, the pattern is invalidated.
- Filter Quality Signals: Adjust parameters like "Rim similarity tolerance", "Handle retrace min/max" to filter more accurate patterns and reduce noise.
- Combine with Larger Timeframes: Cup & Handle pattern works best on H4, Daily, Weekly timeframes. Avoid using on very small timeframes (M1, M5) due to noise.
1.4 How the Indicator Works
Inputs & Roles
- pivotSpan (Integer, default: 10): Number of bars needed to confirm a swing high/low (pivot). For example, pivotSpan=10 means 10 bars on the left and 10 bars on the right must all be lower (for high) or higher (for low) to confirm a pivot. Increase pivotSpan → fewer but stronger pivots, fewer patterns but higher quality. Decrease pivotSpan → more pivots, more signals but more noise.
- rimTolPct (Integer %, default: 18%): Allowed deviation between left rim and right rim of the cup. For example, if left rim is at $100, right rim at $110, deviation = 10%. If rimTolPct=18%, it's accepted; if rimTolPct=5%, it's rejected. Decrease rimTolPct → cup must be more balanced, fewer patterns but more accurate. Increase rimTolPct → accept more unbalanced cups, more patterns.
- hMin (Float, default: 0.12): Minimum depth of handle relative to cup depth. For example, if cup is $100 deep, handle must be at least $12 deep (0.12×100). Too small → handle too shallow, insufficient "test", weak signal.
- hMax (Float, default: 0.55): Maximum depth of handle. For example, if cup is $100 deep, handle cannot be deeper than $55. Too large → handle too deep, messy pattern, no longer a standard Cup & Handle.
- killAtFib (Float, default: 61.8%): Pattern "invalidation" level. If price drops below 61.8% of handle depth (from rim), pattern is broken. This is the safe Stop Loss level. Decrease → tighter SL, less risk but easier to stop out early. Increase → looser SL, accept larger swings.
- needConfirm (Boolean, default: false): Whether to require price breakout past rim. false → early detection as soon as pattern forms. true → only triggers when price has broken past rim, higher quality signal but later.
- targetMult (Float, default: 0.5): Multiplier to calculate price target. For example, cup depth $100, rim at $200, target = 200 + (100×0.5) = $250. Increase → farther target, larger profit but harder to reach. Decrease → closer target, easier to reach but smaller profit.
- showName, bgBull, lnBull, bgBear, lnBear, wOk, stOk, showTarget, targetWidth, targetStyle: Display options (show/hide label, colors, line width, line style). Don't affect detection logic, only visual appearance.
Main Logic Blocks
🎯 Flow 1: Cup & Handle Pattern Detection
-
Step 1 - Collect Pivots (Swing Highs/Lows):
- The indicator uses ta.pivothigh() and ta.pivotlow() functions to find swing highs and lows based on pivotSpan.
- Each time a pivot is found, it's saved to a "pivot list" (array) with 3 pieces of information: price (p), bar position (i), direction (d) (+1 = high, -1 = low).
- This list only keeps the most recent 12 pivots (if more than 12, the oldest pivot is deleted).
- Example: If pivotSpan=10, price makes a high at bar 100 with price $50, and 10 bars before + 10 bars after are all below $50, then this pivot is saved: {p: 50, i: 100, d: +1}.
-
Step 2 - Identify Valid 4-Pivot Sequence:
- The indicator takes the 4 most recent pivots from the list: s0, s1, s2, s3.
- Bullish pattern (Cup & Handle): Sequence must be: High → Low → High → Low (s0.d=+1, s1.d=-1, s2.d=+1, s3.d=-1).
- Bearish pattern (Inverted Cup & Handle): Sequence must be: Low → High → Low → High (s0.d=-1, s1.d=+1, s2.d=-1, s3.d=+1).
- Bullish pattern example: s0 = high $100 (left rim), s1 = low $80 (cup bottom), s2 = high $98 (right rim), s3 = low $92 (handle low).
-
Step 3 - Validate Cup Conditions:
- Rim similarity: Compare prices of s0 (left rim) and s2 (right rim). If deviation ≤ rimTolPct%, it's valid.
- Example: s0=$100, s2=$110, deviation = |100-110|/100 = 10%. If rimTolPct=18% → valid. If rimTolPct=5% → rejected.
- Calculate cup depth: depth = |rimPrice - Bp|, where rimPrice = min(s0, s2) for bullish pattern, or max(s0, s2) for bearish pattern.
- Bullish pattern example: s0=$100, s2=$98, s1=$80 → rimPrice=$98 (take lower), depth=|98-80|=$18.
-
Step 4 - Validate Handle Conditions:
- Calculate handle depth (hRet): hRet = |rimPrice - Hp| / depth, where Hp is the price of s3 (handle low).
- Example: rimPrice=$98, Hp=$92, depth=$18 → hRet = |98-92|/18 = 6/18 = 0.33 (33%).
- Check hRet is within [hMin, hMax]: If hMin=0.12, hMax=0.55, then 0.33 is within range → valid.
- Check handle position: For bullish pattern, Hp must be < rimPrice (handle must be below cup rim). For bearish pattern, Hp must be> rimPrice.
-
Step 5 - Check Breakout (if needConfirm enabled):
- If needConfirm=true, indicator only triggers when closing price (close) breaks past rimPrice.
- Bullish pattern: close > rimPrice.
- Bearish pattern: close < rimPrice.
- If needConfirm=false, skip this step, trigger as soon as pattern forms.
-
Step 6 - Remove Duplicates:
- Check if new pattern duplicates a previous pattern (based on rim position and rim price).
- If duplicate (deviation < 0.15%), skip to avoid drawing multiple times.
🎨 Flow 2: Draw Pattern on Chart
-
Draw Cup Curve:
- Create 3 points: point 1 (Li, rimPrice), point 2 (midBar, Bp), point 3 (Ri, rimPrice).
- Use polyline.new() function with curved=true parameter to draw curved line connecting these 3 points.
- Line color and fill color chosen based on bullish/bearish pattern (bgBull/lnBull or bgBear/lnBear).
-
Draw Handle Curve:
- Create 3 points: point 1 (Ri, rimPrice), point 2 (Hi, Hp), point 3 (projBar, rimPrice).
- projBar = Hi + (Hi - Ri), meaning extend handle forward to create complete handle shape.
- Draw similar to cup, using curved polyline.
-
Draw Target Line:
- If showTarget=true, draw horizontal line from Ri to Hi+25 bars, at price level tgtPrice.
- tgtPrice = Rp + (depth × targetMult) for bullish pattern, or Rp - (depth × targetMult) for bearish pattern.
- Example: Rp=$98, depth=$18, targetMult=0.5 → tgtPrice = 98 + (18×0.5) = $107.
-
Draw Pattern Label:
- If showName=true, draw label "Cup+Handle" or "Inv Cup+Handle" at cup center (midBar, rimPrice).
🔔 Flow 3: Trigger Alerts
- When a valid pattern is detected, variable newSignal = true and newSide = +1 (bullish) or -1 (bearish).
- Function alertcondition() checks this condition and triggers corresponding alert.
- Alert "Cup & Handle (Brewed)": Triggers when newSignal=true and newSide=+1.
- Alert "Inverted Cup & Handle (Brewed)": Triggers when newSignal=true and newSide=-1.
Outputs & Usage Roles
- Cup & Handle Curves: Help traders visually identify the pattern on chart, determine accumulation zone and potential breakout point.
- Target Line: Shows price target for profit-taking, based on cup depth theory.
- Invalidation Level (invPrice): Price level where if touched, pattern is broken. Used to set Stop Loss. Example: invPrice = Rp - (depth × 0.618) for bullish pattern.
- Alerts: Timely notifications when pattern appears, helping traders not miss opportunities.

					// This Pine Script® code is subject to the terms of the Mozilla Public License 2.0 at https://mozilla.org/MPL/2.0/
// © LuxAlgo

//@version=6
indicator("Structural Leg Profiler [LuxAlgo]", "LuxAlgo - Leg Profiler", overlay=true, max_boxes_count=500, max_lines_count=500, max_labels_count=500)

//---------------------------------------------------------------------------------------------------------------------}
// Inputs
//---------------------------------------------------------------------------------------------------------------------{
string GRP_SWING   = "Swing Detection"
int    atrPeriod   = input.int(5, "ATR Period", group=GRP_SWING)
float  swingMult   = input.float(2.5, "Swing Multiplier (ATR)", step=0.1, group=GRP_SWING, tooltip="Higher values create larger structural legs. Lower values capture micro-swings.")

string GRP_PROFILE = "Profile Settings"
int    maxBoxes    = input.int(50, "Max Profile Boxes", minval=10, maxval=150, group=GRP_PROFILE)
string alignMode   = input.string("Left", "Profile Alignment", options=["Left", "Right", "Center"], group=GRP_PROFILE)
bool   showBoxVol  = input.bool(true, "Show Volume Value Inside Boxes", group=GRP_PROFILE)
bool   extendPoc   = input.bool(true, "Extend Untested POCs", group=GRP_PROFILE, tooltip="Extends the Point of Control line forward until price touches and tests it.")

string GRP_BUBBLES = "Volume Anomalies"
bool   showBubbles = input.bool(true, "Show Volume Bubbles", group=GRP_BUBBLES)
float  bubbleMult  = input.float(2.0, "Spike Threshold (x SMA)", step=0.1, group=GRP_BUBBLES, tooltip="Highlights candles where volume is X times greater than the 20-period average.")

string GRP_COLORS  = "Style & Colors"
string colorMode   = input.string("Volume Gradient", "Box Color Mode", options=["Volume Gradient", "Delta (Buy vs Sell)"], group=GRP_COLORS)

color  upStartC    = input.color(color.new(#01579B, 0), "Up Leg (Low Vol)", group=GRP_COLORS, inline="up")
color  upMidC      = input.color(color.new(#2962FF, 0), "Up Leg (Mid Vol)", group=GRP_COLORS, inline="up")
color  upEndC      = input.color(color.new(#00E5FF, 0), "Up Leg (High Vol)", group=GRP_COLORS, inline="up")

color  dnStartC    = input.color(color.new(#311B92, 0), "Down Leg (Low Vol)", group=GRP_COLORS, inline="dn")
color  dnMidC      = input.color(color.new(#C51162, 0), "Down Leg (Mid Vol)", group=GRP_COLORS, inline="dn")
color  dnEndC      = input.color(color.new(#FF5252, 0), "Down Leg (High Vol)", group=GRP_COLORS, inline="dn")

//---------------------------------------------------------------------------------------------------------------------}
// Types
//---------------------------------------------------------------------------------------------------------------------{
type LTFBar
    int chartBar
    float h
    float l
    float v
    float buyV
    float sellV

type CandleProfile
    float profileHigh
    float profileLow
    int   numBoxes
    float boxHeight
    array<float> volumeDistribution
    array<float> deltaDistribution
    float maxVolumeInProfile
    int   maxVolumeIndex
    float pocPrice

type UntestedPOC
    line  pocLine
    float price
    bool  isBull
    int   endBar

//---------------------------------------------------------------------------------------------------------------------}
// State Variables
//---------------------------------------------------------------------------------------------------------------------{
var array<LTFBar>      ltfHistory   = array.new<LTFBar>()
var array<UntestedPOC> untestedPocs = array.new<UntestedPOC>()

var int   zzDir          = 1
var float zzHigh         = high
var int   zzHighBar      = bar_index
var float zzLow          = low
var int   zzLowBar       = bar_index
var int   lastPivotBar   = bar_index
var float lastPivotPrice = close

//---------------------------------------------------------------------------------------------------------------------}
// Methods / Functions
//---------------------------------------------------------------------------------------------------------------------{
f_buildVolumeBar(int filledBlocks, int totalBlocks) =>
    string result = ""
    for i = 1 to totalBlocks
        result += i <= filledBlocks ? "█" : "░"
    result

f_createProfile(float legHigh, float legLow, float targetBoxHeight, array<LTFBar> legBars) =>
    float barRange = legHigh - legLow
    int numBoxes = math.max(1, int(math.round(barRange / targetBoxHeight)))
    float adjustedBoxHeight = barRange / numBoxes
    array<float> volDist = array.new_float(numBoxes, 0.0)
    array<float> deltaDist = array.new_float(numBoxes, 0.0)

    for i = 0 to legBars.size() - 1
        LTFBar b = legBars.get(i)
        float ltfBarRange = math.max(b.h - b.l, syminfo.mintick)

        for boxIndex = 0 to numBoxes - 1
            float boxBottom = legLow + (boxIndex * adjustedBoxHeight)
            float boxTop = boxBottom + adjustedBoxHeight
            float overlapHeight = math.max(0, math.min(boxTop, b.h) - math.max(boxBottom, b.l))

            if overlapHeight > 0
                float overlapRatio = overlapHeight / ltfBarRange
                float volContrib = b.v * overlapRatio
                float buyContrib = b.buyV * overlapRatio
                float sellContrib = b.sellV * overlapRatio

                volDist.set(boxIndex, volDist.get(boxIndex) + volContrib)
                deltaDist.set(boxIndex, deltaDist.get(boxIndex) + (buyContrib - sellContrib))

    float maxVolume = volDist.max()
    int maxVolIdx = volDist.indexof(maxVolume)
    float pocPrice = legLow + (maxVolIdx * adjustedBoxHeight) + (adjustedBoxHeight / 2)

    CandleProfile.new(legHigh, legLow, numBoxes, adjustedBoxHeight, volDist, deltaDist, maxVolume, maxVolIdx, pocPrice)

method draw(CandleProfile this, int startBar, int endBar, bool isUpLeg, float totalBuyVol, float totalSellVol) =>
    int bLeft = startBar
    int bRight = math.max(startBar + 1, endBar)
    int totalBlocks = math.max(5, math.min(30, int(15 * ((bRight - bLeft) / 50.0))))

    color startC = isUpLeg ? upStartC : dnStartC
    color midC   = isUpLeg ? upMidC : dnMidC
    color endC   = isUpLeg ? upEndC : dnEndC

    string parsedAlign = alignMode == "Left" ? text.align_left : alignMode == "Right" ? text.align_right : text.align_center

    for i = 0 to this.numBoxes - 1
        float boxBottom = this.profileLow + (i * this.boxHeight)
        float boxTop = boxBottom + this.boxHeight
        float currentBoxVolume = this.volumeDistribution.get(i)
        float currentBoxDelta = this.deltaDistribution.get(i)

        if currentBoxVolume > 0
            int filledBlocks = this.maxVolumeInProfile > 0 ? int(math.round((currentBoxVolume / this.maxVolumeInProfile) * totalBlocks)) : 0
            string boxText = f_buildVolumeBar(filledBlocks, totalBlocks)
            if showBoxVol
                boxText += " " + str.tostring(currentBoxVolume, format.volume)

            color textColor = na

            if colorMode == "Delta (Buy vs Sell)"
                if currentBoxDelta > 0
                    textColor := color.from_gradient(currentBoxDelta, 0, this.maxVolumeInProfile, color.new(color.green, 60), color.new(color.green, 0))
                else if currentBoxDelta < 0
                    textColor := color.from_gradient(math.abs(currentBoxDelta), 0, this.maxVolumeInProfile, color.new(color.red, 60), color.new(color.red, 0))
                else
                    textColor := color.gray
            else
                if i < this.maxVolumeIndex
                    textColor := color.from_gradient(i, 0, this.maxVolumeIndex, startC, midC)
                else if i > this.maxVolumeIndex
                    textColor := color.from_gradient(i, this.maxVolumeIndex, this.numBoxes - 1, midC, endC)
                else
                    textColor := midC

            color bgC = color.new(textColor, 90)
            box.new(left=bLeft, top=boxTop, right=bRight, bottom=boxBottom, border_color=color(na), bgcolor=bgC, text=boxText, text_size=size.small, text_color=textColor, text_halign=parsedAlign, text_valign=text.align_center, text_wrap=text.wrap_none, text_font_family=font.family_monospace)

    line pocL = line.new(startBar, this.pocPrice, endBar, this.pocPrice, color=color.new(endC, 0), style=line.style_dashed, width=2)
    if extendPoc
        untestedPocs.push(UntestedPOC.new(pocL, this.pocPrice, isUpLeg, endBar))

    float delta = totalBuyVol - totalSellVol
    color deltaColor = delta > 0 ? color.green : color.red
    string deltaSign = delta > 0 ? "+" : ""

    string summaryText = "Leg Vol: " + str.tostring(totalBuyVol + totalSellVol, format.volume) + "\n" +
                         "Delta: " + deltaSign + str.tostring(delta, format.volume) + "\n" +
                         "POC: " + str.tostring(this.pocPrice, format.mintick)

    int midBar = int(math.round((startBar + endBar) / 2))
    float summaryY = isUpLeg ? this.profileHigh : this.profileLow
    label.new(midBar, summaryY, text=summaryText, color=color.new(chart.bg_color, 20), style=isUpLeg ? label.style_label_down : label.style_label_up, textcolor=deltaColor, size=size.tiny)

f_processLeg(int startBar, int endBar, float startPrice, float endPrice, bool isUpLeg, array<LTFBar> history, float baseBoxHeight) =>
    line.new(startBar, startPrice, endBar, endPrice, color=color.new(color.gray, 50), width=2, style=line.style_dotted)

    array<LTFBar> legBars = array.new<LTFBar>()
    float totalBuy = 0.0
    float totalSell = 0.0
    float maxH = -1.0
    float minL = 99999999.0

    for i = 0 to history.size() - 1
        LTFBar b = history.get(i)
        if b.chartBar >= startBar and b.chartBar <= endBar
            legBars.push(b)
            totalBuy += b.buyV
            totalSell += b.sellV
            maxH := math.max(maxH, b.h)
            minL := math.min(minL, b.l)

    if legBars.size() > 0
        float groupRange = maxH - minL
        float targetBoxHeight = (groupRange / baseBoxHeight) > maxBoxes ? groupRange / maxBoxes : baseBoxHeight

        CandleProfile profile = f_createProfile(maxH, minL, targetBoxHeight, legBars)
        profile.draw(startBar, endBar, isUpLeg, totalBuy, totalSell)

    array<LTFBar> newHistory = array.new<LTFBar>()
    for i = 0 to history.size() - 1
        if history.get(i).chartBar >= endBar
            newHistory.push(history.get(i))
    newHistory

//---------------------------------------------------------------------------------------------------------------------}
// Data Retrieval & Accumulation
//---------------------------------------------------------------------------------------------------------------------{
[ltfOpens, ltfHighs, ltfLows, ltfCloses, ltfVolumes] = request.security_lower_tf(syminfo.tickerid, "1", [open, high, low, close, volume])

if ltfHighs.size() > 0
    for i = 0 to ltfHighs.size() - 1
        float h = ltfHighs.get(i)
        float l = ltfLows.get(i)
        float c = ltfCloses.get(i)
        float v = ltfVolumes.get(i)

        float rng = math.max(h - l, syminfo.mintick)
        float buyVol = v * (c - l) / rng
        float sellVol = v * (h - c) / rng

        ltfHistory.push(LTFBar.new(bar_index, h, l, v, buyVol, sellVol))
else
    float rng = math.max(high - low, syminfo.mintick)
    float buyVol = volume * (close - low) / rng
    float sellVol = volume * (high - close) / rng
    ltfHistory.push(LTFBar.new(bar_index, high, low, volume, buyVol, sellVol))

if ltfHistory.size() > 90000
    ltfHistory.shift()

//---------------------------------------------------------------------------------------------------------------------}
// Swing Logic & Profiling
//---------------------------------------------------------------------------------------------------------------------{
float globalAtr = ta.atr(atrPeriod)
float globalAtr14 = ta.atr(14)
float revAmount = globalAtr * swingMult

bool isSwingHigh = false
bool isSwingLow = false

if zzDir == 1
    if high > zzHigh
        zzHigh := high
        zzHighBar := bar_index
    if low < zzHigh - revAmount
        zzDir := -1
        zzLow := low
        zzLowBar := bar_index
        isSwingHigh := true
else
    if low < zzLow
        zzLow := low
        zzLowBar := bar_index
    if high > zzLow + revAmount
        zzDir := 1
        zzHigh := high
        zzHighBar := bar_index
        isSwingLow := true

if isSwingHigh
    float boxHeightLimit = globalAtr14 / 10
    ltfHistory := f_processLeg(lastPivotBar, zzHighBar, lastPivotPrice, zzHigh, true, ltfHistory, boxHeightLimit)
    lastPivotBar := zzHighBar
    lastPivotPrice := zzHigh

if isSwingLow
    float boxHeightLimit = globalAtr14 / 10
    ltfHistory := f_processLeg(lastPivotBar, zzLowBar, lastPivotPrice, zzLow, false, ltfHistory, boxHeightLimit)
    lastPivotBar := zzLowBar
    lastPivotPrice := zzLow

//---------------------------------------------------------------------------------------------------------------------}
// Untested POC Extensions
//---------------------------------------------------------------------------------------------------------------------{
if untestedPocs.size() > 0
    for i = untestedPocs.size() - 1 to 0
        UntestedPOC p = untestedPocs.get(i)
        bool isTested = high >= p.price and low <= p.price

        if isTested
            p.pocLine.set_x2(bar_index)
            untestedPocs.remove(i)
        else
            p.pocLine.set_x2(bar_index)

    if untestedPocs.size() > 0
        int bullCount = 0
        int bearCount = 0
        for i = untestedPocs.size() - 1 to 0
            UntestedPOC p = untestedPocs.get(i)
            if p.isBull
                bullCount += 1
                if bullCount > 2
                    p.pocLine.set_x2(p.endBar)
                    untestedPocs.remove(i)
            else
                bearCount += 1
                if bearCount > 2
                    p.pocLine.set_x2(p.endBar)
                    untestedPocs.remove(i)

//---------------------------------------------------------------------------------------------------------------------}
// Volume Anomalies
//---------------------------------------------------------------------------------------------------------------------{
if showBubbles
    float volSma = ta.sma(volume, 20)
    if volSma > 0
        float volRatio = volume / volSma
        if volRatio >= bubbleMult
            bool isBull = close >= open
            color bubColor = isBull ? color.new(upEndC, 40) : color.new(dnEndC, 40)
            int dynSize = int(math.max(6, math.min(volRatio * 4, 20)))
            string bubText = volRatio >= (bubbleMult * 1.5) ? str.tostring(volume, format.volume) : ""
            label.new(bar_index, hl2, text=bubText, color=bubColor, style=label.style_circle, textcolor=color.white, size=dynSize, tooltip="Volume: " + str.tostring(volume, format.volume) + "\nSpike: " + str.tostring(volRatio, "#.##") + "x Average")

//---------------------------------------------------------------------------------------------------------------------}
Indicator Insider
04 Structural Leg Profiler [LuxAlgo]
Isolated Scroll Container 1. Cup & Handle Indicator Description (Zeiierman) An indicator that automatically detects the Cup & Handle pattern – one of the most classic chart patterns in technical analysis 1.1 Indicator Concept The Cup & Handle indicator is based on the theory of market psychology patterns discovered by
03 Ranked FVG
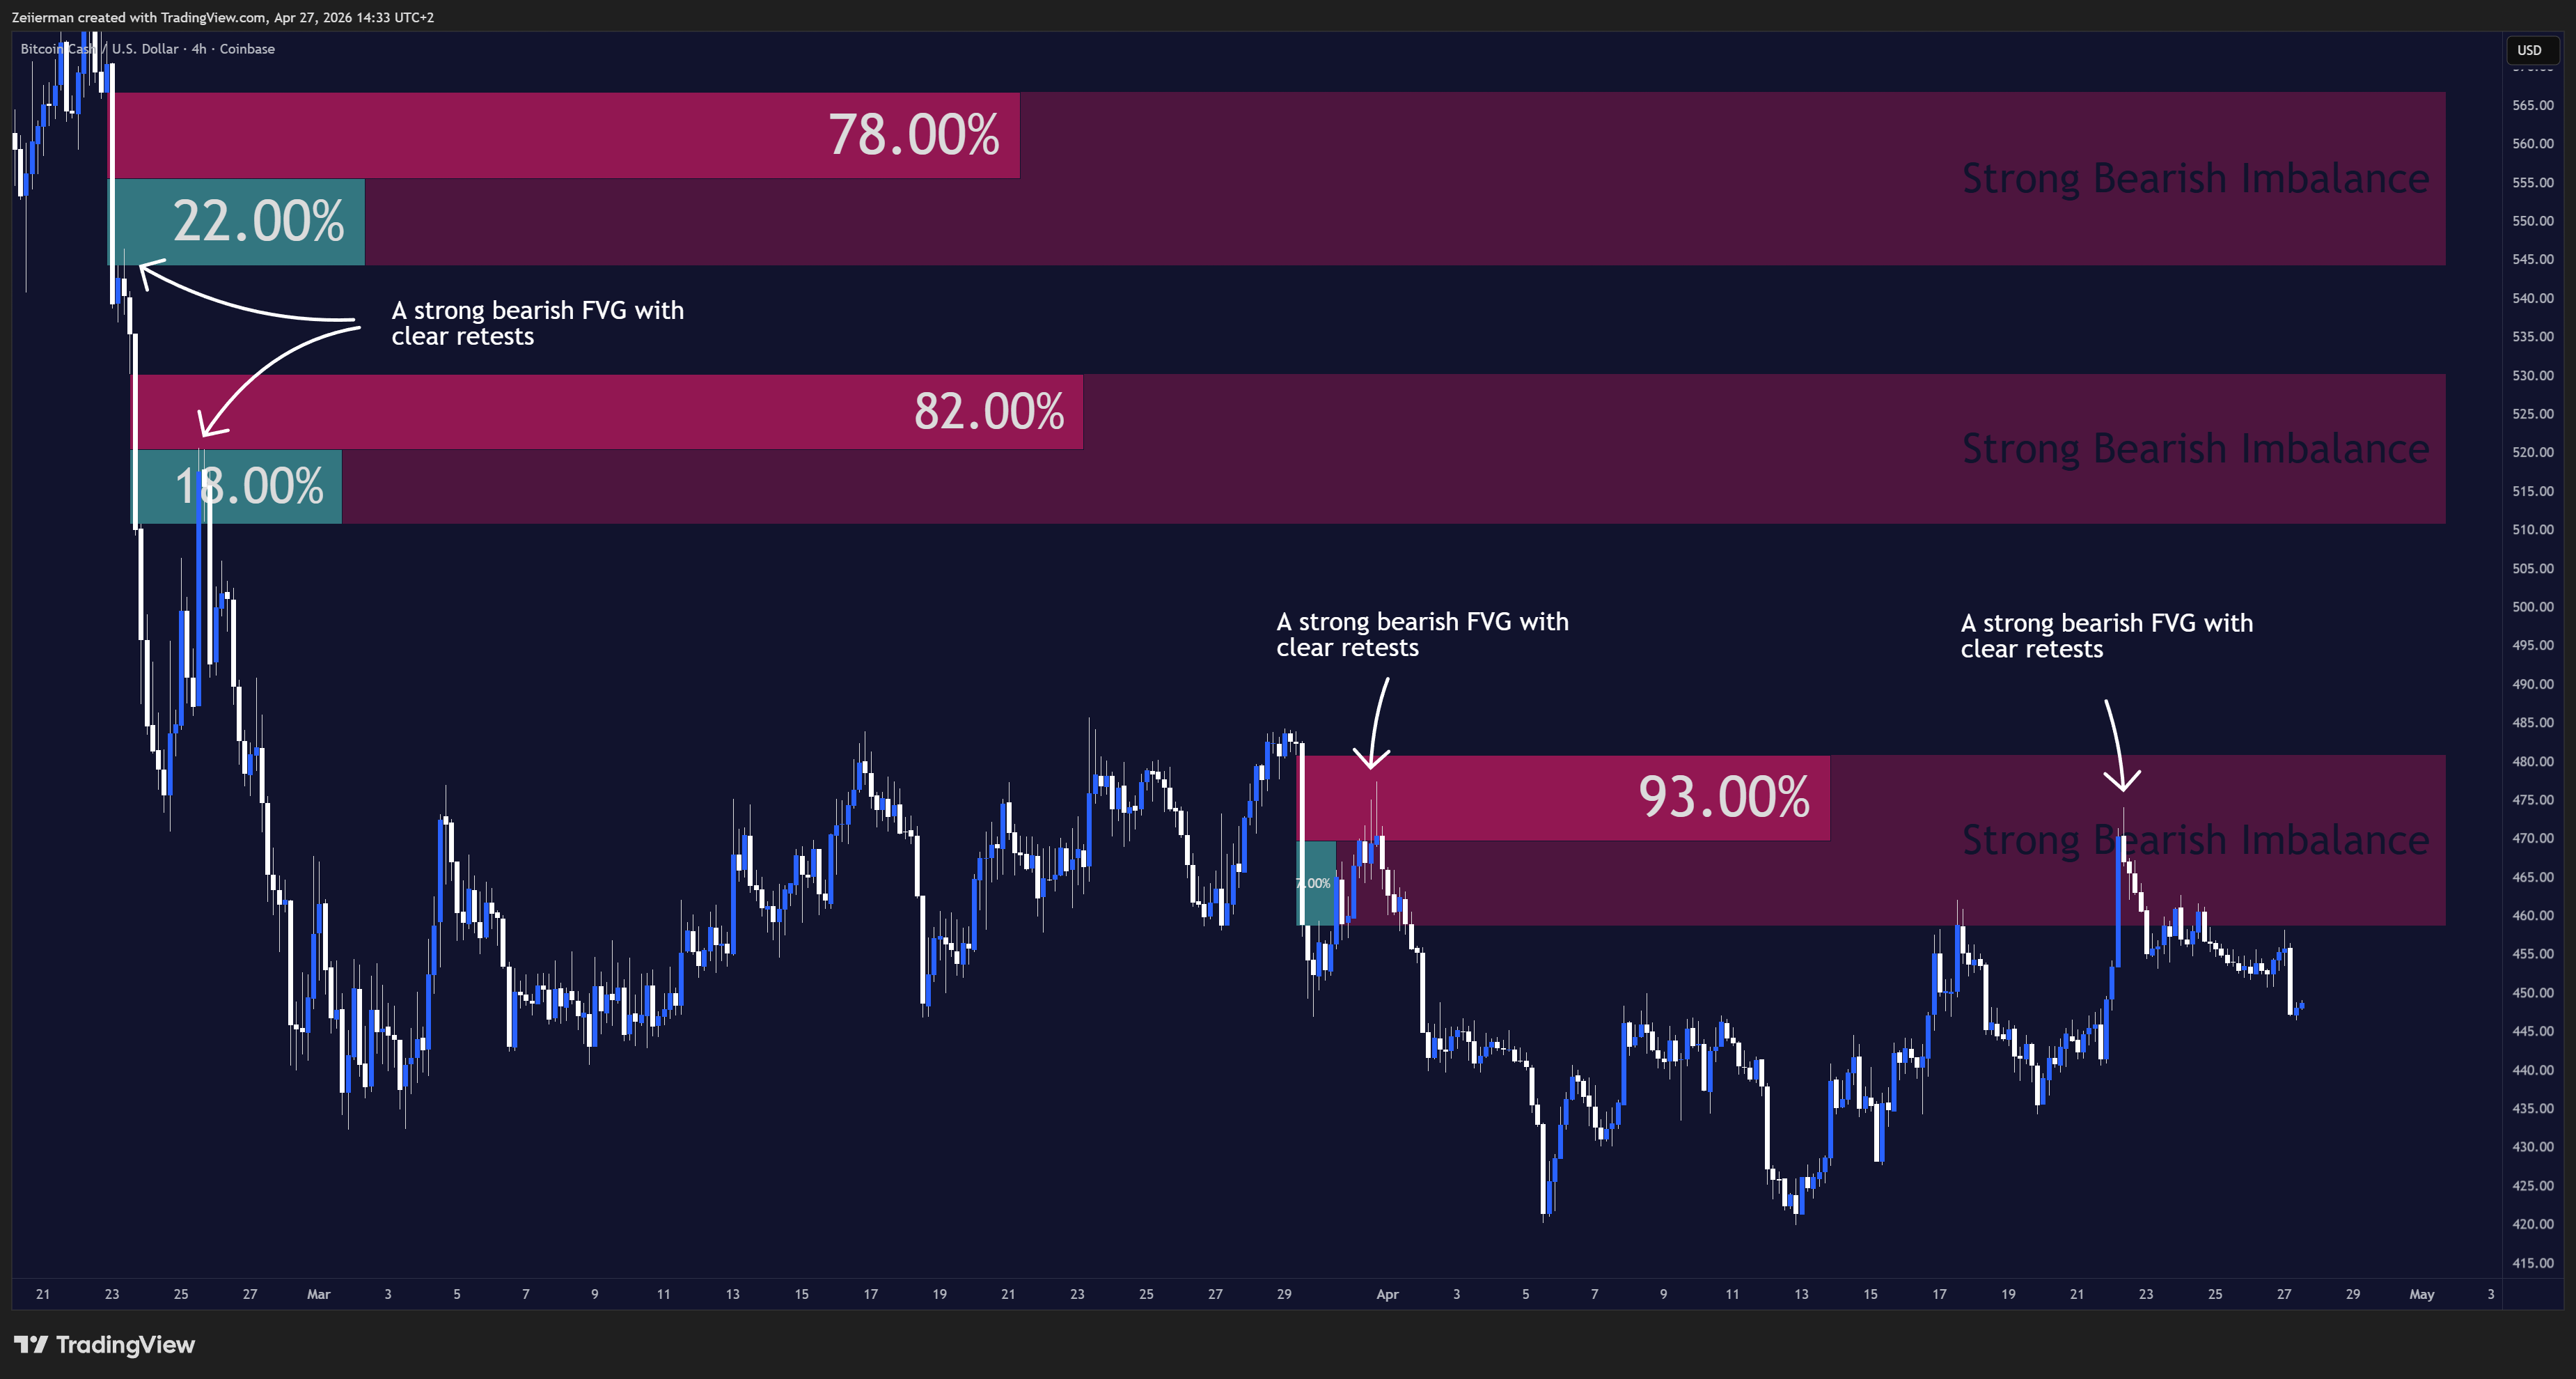
Isolated Scroll Container 1. Indicator Description – Ranked FVG Imbalance Zones (Zeiierman) Detects, ranks, and displays the highest-quality Fair Value Gap zones on the chart using a dynamic scoring system 1.1 Indicator Concept A Fair Value Gap (FVG) — also called a price imbalance — is a concept rooted in

Volume Divergence is fucking Trash!!
This isn’t just another lagging indicator. This strategy is a “Financial X-Ray” that combines Volume Delta with the precision of Trading Hub 3.0 to catch market reversals before they even hit the news