1. High Timeframe Volume Profile Description
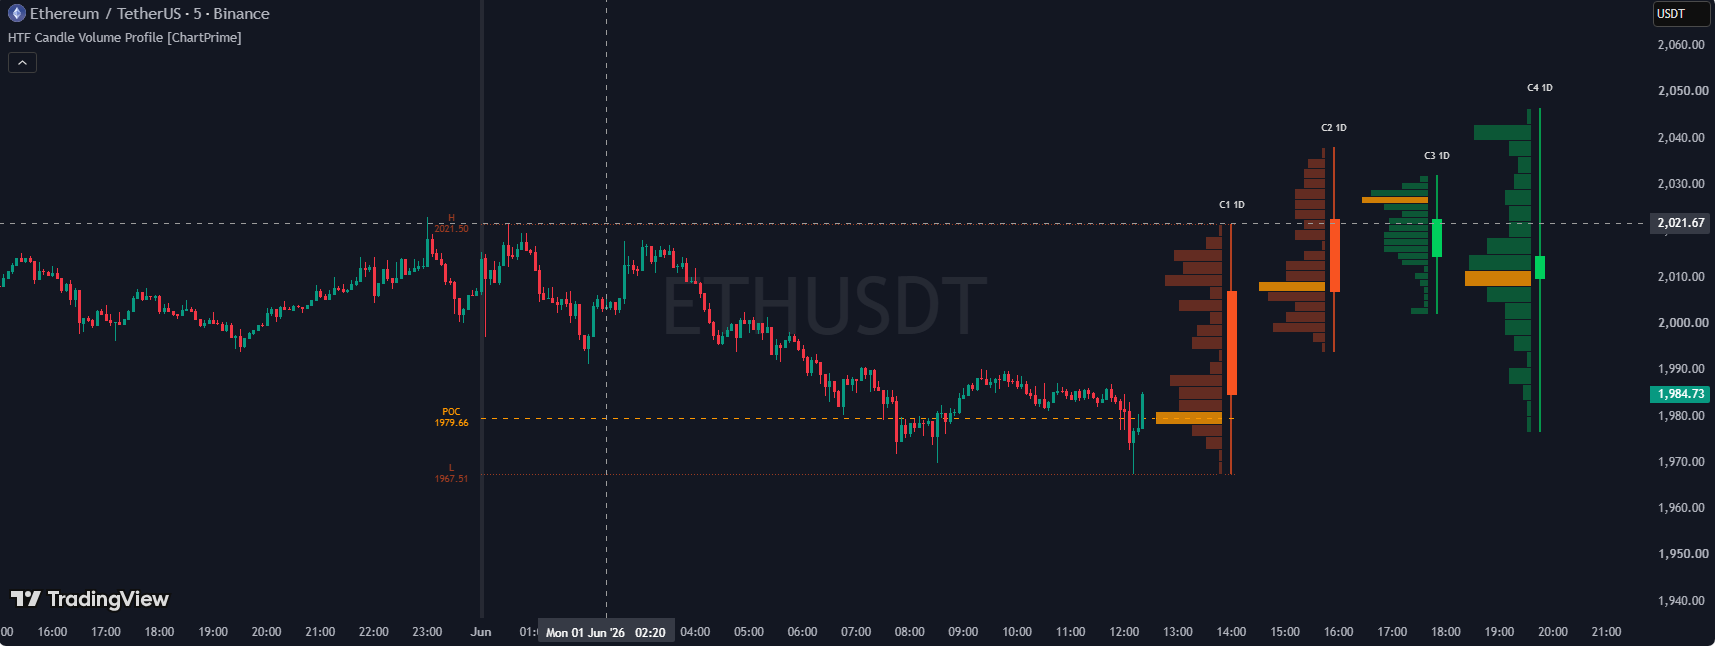
An indicator that projects the last few Higher-Timeframe candles as compact synthetic candles next to the live price, each with its own mini volume profile, POC, and High/Low reference lines
1.1 Indicator Concept
Traders often want to know "what does the Daily (or Weekly) candle look like right now?" while still watching a lower timeframe chart (like M15 or H1) - but switching timeframes back and forth breaks focus, and a full HTF candle plotted at its real historical width would be enormous on a low timeframe. This indicator solves that by synthesizing a small version of the last few Higher-Timeframe (HTF) candles and drawing them as compact shapes off to the side of the current price - like a mini "HTF dashboard" living on your normal chart.
- Synthetic, not real, candle bodies: the 4 candles shown to the right of price aren't part of the actual bar series - they're hand-drawn boxes and lines positioned at fixed projected x-coordinates, built from OHLC data the script itself aggregates from the HTF you choose.
- Each candle carries its own volume profile: alongside every synthetic candle, a small horizontal histogram shows how the underlying (lower-timeframe) trading volume was distributed across that HTF candle's price range, plus a highlighted Point of Control (POC) - the single price level where the most volume traded.
- Reference lines also appear back on the real chart: the POC and High/Low levels of each HTF candle aren't only shown next to the synthetic shape - they're also drawn as lines stretching across the real historical price action where that HTF candle actually happened, so you can see exactly where those levels sit relative to real price structure.
- Always up to date: the currently-forming (not yet closed) HTF candle is tracked and shown live as "Candle 1", updating every bar, alongside up to 3 already-closed HTF candles for context.
1.2 Indicator Features
-
Synthetic HTF Candles (up to 4, drawn to the right of price):
- Each is a small candlestick shape (wick + body) built from that HTF period's real open/high/low/close. Green (default) if the candle closed bullish, orange-red (default) if bearish.
- "Candle 1" is always the currently-forming (live, not yet closed) HTF candle; "Candle 2/3/4" are the 1st, 2nd, and 3rd most recently closed HTF candles. Each can be shown or hidden independently.
- Candles are laid out left-to-right in the order Candle 1 → 2 → 3 → 4, meaning the dashboard reads newest to oldest from left to right (the opposite of how a normal price chart reads).
- A small text label above each candle shows which slot it is and the timeframe (e.g. "C1 1D", "C2 4H").
- Volume Profile Histogram (per candle, optional): a row-by-row horizontal histogram sitting just to the left of each synthetic candle, showing how much of that HTF candle's trading volume occurred at each price level. The bin with the most volume (the Point of Control) is highlighted in a distinct orange (default) color.
- POC Line & Label (optional): a line (dashed by default, style configurable) drawn at the POC price, stretching from where that HTF candle actually began on the real chart across to its synthetic position on the right - plus an optional price label.
- High/Low Lines & Labels (optional): two dotted lines at the HTF candle's real high and low, also stretching from the real historical start of that candle to its synthetic position - plus optional "H"/"L" price labels.
- New-HTF-Candle Background Flash: a subtle full-width background highlight appears on the bar where a new HTF period begins, as a quick visual cue on the real chart.
- Alert: a single alert - "New HTF Candle" - fires whenever a new HTF period starts (i.e. the previous HTF candle has just closed).
1.3 How to Use the Indicator
- Monitor the Higher Timeframe without switching charts: keep trading on your preferred lower timeframe while "Candle 1" shows you, live, how the current Daily (or whichever HTF you pick) candle is shaping up.
- Use the POC/High/Low reference lines as real support/resistance: because these lines are drawn over the actual historical price action (not just next to the synthetic shapes), they mark genuine price levels you can watch for reactions on your live timeframe.
- Compare recent HTF candles side by side: with all 4 slots enabled, you get an instant visual read of the last few HTF candles' direction, range, and where their volume concentrated - useful for spotting a developing trend or a shift in where volume is piling up.
- Read the volume profile shape per candle: a POC near the top of a candle's range suggests most trading happened near the highs (potential resistance building there); a POC near the bottom suggests the opposite.
- Use the "New HTF Candle" alert to know exactly when a period rolls over: useful for any process that should re-evaluate right at the Daily/Weekly/etc. open.
- Give the dashboard room: raise "Projection Offset" if the synthetic candles are crowding your live price action, or reduce "Profile Width" / turn off unused candle slots if you want a more compact dashboard.
1.4 How the Indicator Works
Inputs & Roles
- tf ("Timeframe", Timeframe picker, default: "D" / Daily): the Higher Timeframe whose candles get synthesized. Example: set to "240" (4-hour) while viewing a 15-minute chart, and each synthetic candle will represent one 4-hour period built from the underlying 15-minute bars.
- offset ("Projection Offset (bars)", Integer, default: 20, range 5-100): how many bars to the right of the last real bar the first synthetic candle ("Candle 1") is drawn. Increase → dashboard sits further away from live price (less visual clutter near price action). Decrease → dashboard sits closer to the last real bar.
- binsQty ("Profile Bins", Integer, default: 20, range 5-50): how many equal price bands each HTF candle's high-low range is divided into for its volume profile. Example: an HTF candle spanning $100-$120 with binsQty=20 creates 20 bins of $1 each; the POC can then only land on the midpoint of one of those 20 bins. Increase → finer price resolution. Decrease → coarser, chunkier profile.
- profileWidth ("Profile Width (bars)", Integer, default: 15, range 3-40): the maximum horizontal length (in bars) that the single largest-volume bin's box can stretch; every other bin is scaled proportionally shorter. Also directly controls the horizontal spacing between adjacent candle slots (slot spacing = profileWidth + 8 bars), so a wider profile also means more space between synthetic candles.
- showPoc ("Show POC Line", Boolean, default: true): shows/hides the POC line and its label (if labels are on). The POC bin in the histogram itself stays highlighted in orange regardless of this setting.
- pocLineStyle ("POC Line Style", Options: Dashed / Solid / Dotted, default: Dashed): visual style of the POC line only - it does not affect the High/Low lines, which are always dotted regardless of this setting.
- showHiLo ("Show High / Low Levels", Boolean, default: true): shows/hides the dotted High and Low reference lines (and their labels, if labels are on) for each candle.
- showLabels ("Labels", Boolean, default: true): master switch for all price labels - POC, High, Low, and the "C1/C2/C3/C4 {timeframe}" candle tags above each synthetic candle. Turning it off leaves the lines/boxes/candles themselves visible, just without any text.
- bullCol / bearCol: color used for bullish/bearish synthetic candle bodies, volume-profile bins (non-POC), and the High/Low reference lines. Purely cosmetic.
- pocCol ("POC Color"): color for the highlighted POC bin, the POC line, and the POC label text. Purely cosmetic.
- candle1_on / candle2_on / candle3_on / candle4_on (Boolean, all default: true): independently show/hide each of the 4 candle slots (current-forming, last-closed, 2nd-last-closed, 3rd-last-closed). Turning one off skips drawing its candle, profile, and reference lines entirely for that bar.
Main Logic Blocks

🎯 Flow 1: What You See — Two Output Zones
- Zone A - the projected dashboard: up to 4 synthetic candle shapes sit at fixed positions to the right of the last real bar, each paired with its own compact volume profile histogram. Reading left to right goes Candle 1 (live) → Candle 2 (most recently closed) → Candle 3 → Candle 4, i.e. newest first.
- Zone B - reference lines on the real chart: for every candle shown, its POC and (optionally) High/Low lines don't stop at the synthetic shape - they extend backward, overlaid directly on the real historical bars where that HTF candle actually occurred, so you can line those price levels up against genuine chart structure.
- Both zones only exist/refresh on the most recent bar of the chart (barstate.islast) - they are a live "current state" overlay, not something plotted historically bar by bar. Every time the script recalculates on the latest bar, the old drawings are erased and redrawn fresh (see Flow 2).
🧹 Flow 2: The "Erase & Redraw" Technique
- Because this dashboard only ever needs to show the current state (not a history of past dashboards), the script never lets old drawings pile up. For single objects like the candle wick, candle body, POC line, and High/Low lines, it uses a Pine idiom where creating a new line/box/label also immediately looks up and deletes the previous one created at that same spot in the code - so only the newest version ever exists on the chart.
- For the volume-profile histogram (which is a whole array of boxes, one per bin), the function instead explicitly deletes every box in its list and empties the list at the start of each run, then rebuilds it bin by bin from scratch.
- Technical note: because this histogram-clearing list is declared separately inside the profile-drawing function for each of the 4 candle slots, each slot keeps track of (and only ever deletes) its own profile boxes - Candle 1's histogram is managed completely independently from Candle 2/3/4's.
🌱 Flow 3: Tracking HTF Candles
- Every bar, the currently-forming HTF candle's running high/low are kept up to date (rtHigh/rtLow extend to include the new bar's high/low).
- The instant timeframe.change(tf) fires (the first bar of a new HTF period, meaning the previous HTF period just ended), the just-finished candle's open, close, high, low, and its real start/end bar positions are pushed into permanent storage arrays - and the "currently forming" trackers reset to start fresh from this new bar.
- This is what allows "Candle 2/3/4" to always show the 1st/2nd/3rd most recently closed HTF candles (read from the end of the storage arrays), while "Candle 1" always shows the live, still-forming one (read from the running trackers, not the arrays).
🔧 Flow 4: Building One Candle's Volume Profile
- Guard first: if the candle's high/low are missing, flat (high ≤ low), or its bar range is invalid, nothing is drawn for it at all.
- Bucket each underlying bar by its close price: the candle's price range is split into binsQty equal bins. Every underlying (lower-timeframe) bar that falls within this HTF candle's real start/end range has its entire volume added to whichever single bin contains that bar's close price - unlike some volume-profile methods that spread a bar's volume across every price level its full high-low range touches, this indicator commits each bar's whole volume to one bin only, based on close. Example: binSize=$1, a bar closing at $105.30 inside a candle spanning $100-$120 dumps its full volume into the bin covering $105-$106.
- Find the POC: the bin with the largest accumulated volume is located; its midpoint price becomes the POC.
- Draw the histogram: each bin's box width is sized proportionally to its share of the largest bin's volume, times profileWidth, with a 1-bar minimum so every bin is at least visible. The POC bin is colored distinctly (orange by default); all others use the bull/bear color. All bins grow leftward from a fixed anchor point 2 bars to the left of the synthetic candle's body.
- Draw the reference lines: if enabled, the POC line/label and the High/Low lines/labels are drawn starting from the candle's true historical start position on the real chart, extending across to just past the synthetic candle's position.
📐 Flow 5: Positioning the 4 Candle Slots
- This entire step only runs when barstate.islast is true (the live/most-recent bar).
- Slot spacing is calculated once as profileWidth + 8 bars. Candle 1's x-position is bar_index + offset; each subsequent slot adds one more spacing increment. Example: offset=20, profileWidth=15 → spacing=23 bars → Candle 1 at bar_index+20, Candle 2 at bar_index+43, Candle 3 at bar_index+66, Candle 4 at bar_index+89.
- For each enabled slot, the appropriate OHLC data is pulled (live trackers for Candle 1, or indexed from the back of the storage arrays for Candles 2-4, skipped entirely if not enough closed candles exist yet), then the candle shape, its volume profile, and its "C# {timeframe}" label are drawn via Flows 2-4.
🔔 Flow 6: Alert
- The single "New HTF Candle" alert condition is simply timeframe.change(tf) - it fires on the exact bar where a new HTF period begins (equivalently, the moment the previous HTF candle finalizes).
Outputs & Usage Roles
- Synthetic candle dashboard: a compact, always-current snapshot of the last 4 HTF candles without needing to leave your working timeframe.
- Per-candle volume profile + POC: shows where trading interest concentrated within each HTF period, and highlights the single most "fought over" price.
- Real-chart reference lines: the same POC/High/Low levels overlaid directly on actual historical price action, usable as support/resistance reference on your live timeframe.
- Background flash & alert: quick, low-effort ways to notice exactly when a new HTF period has begun.