1. Structural Leg Profiler Description
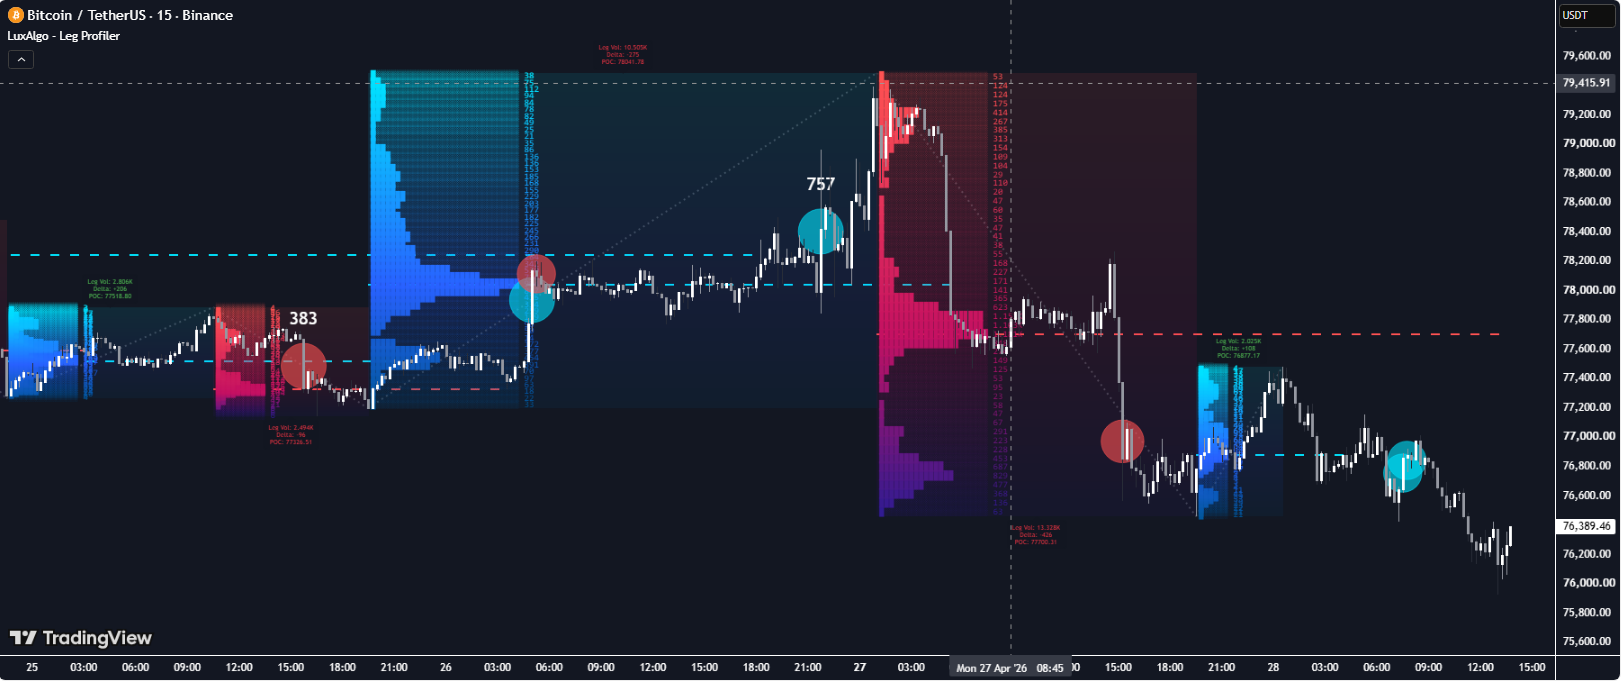
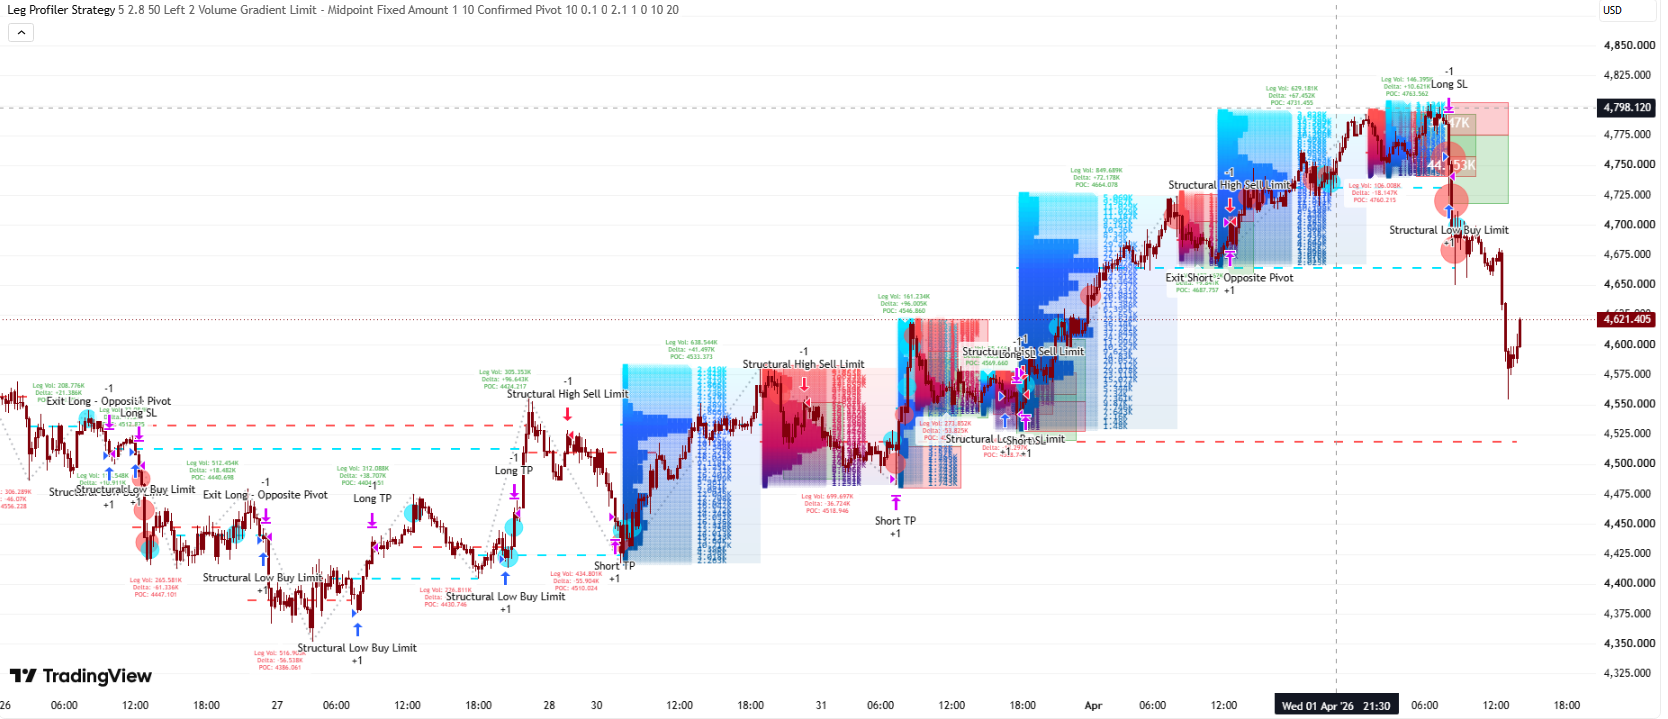
Detects ATR-based ZigZag swing legs, rebuilds a lower-timeframe volume profile for each completed leg with ASCII bar-chart text inside every price box, marks the Point of Control, extends untested POCs forward until price revisits them, and flags abnormal volume spikes with sized bubble markers
1.1 Indicator Concept
This indicator combines a classic ATR-based ZigZag swing detector with a true volume profile built from lower-timeframe (1-minute) data. Every time the ZigZag confirms a new pivot - completing either an up-leg or a down-leg - the indicator pulls every 1-minute bar that occurred during that leg, slices the leg's exact price range into evenly-sized boxes, and proportionally distributes each 1-minute bar's volume (split into an estimated buy and sell portion) across every box its own range overlaps. Each box is then rendered as a colored rectangle containing a compact ASCII block-character bar chart representing its share of the leg's volume, the leg's Point of Control (POC - the single highest-volume box) is marked with a dashed line, and a summary label reports the leg's total volume, net delta, and POC price. POC lines can optionally keep extending forward until price actually returns to test them, subject to a built-in cap on how many untested POCs per direction stay active at once.
- True intrabar volume, not a same-timeframe proxy: rather than estimating volume distribution purely from the chart's own candles, the profile is built from actual 1-minute sub-bars fetched via request.security_lower_tf(), giving a materially finer-grained picture of where volume traded within each leg.
- Self-pruning history buffer: the accumulated 1-minute bar history is trimmed down to just the unprocessed remainder every time a leg completes, rather than growing unbounded for the life of the chart.
- ASCII block-character volume bars: each profile box's relative volume is rendered as a text string of filled (█) and empty (░) block characters directly inside the box, giving a compact, resolution-independent bar-chart effect without needing separate plot objects per box.
- A built-in cap on simultaneously-active untested POCs: only the two most recent untested POC lines per direction (bullish/bearish) are allowed to keep extending forward at once - older excess ones are automatically frozen and removed from active tracking, with no dedicated input exposing this limit.
1.2 Indicator Features
- ATR-Based ZigZag Swing Detection: pivots are confirmed once price reverses by more than an ATR-scaled amount from the running high/low, defining the structural legs that get profiled.
- Per-Leg Volume Profile: every completed leg gets its own set of price boxes, each showing an ASCII block-bar of relative volume and (optionally) the raw volume number, colored either by a directional gradient or by buy/sell delta dominance.
- Point of Control (POC) Line: a dashed line marking the single highest-volume box in each leg's profile, which can optionally keep extending into the future until price actually trades through that exact level.
- Leg Summary Label: a compact label at each leg's midpoint reporting total leg volume, net buy/sell delta (colored green/red), and the POC price.
- Configurable Box Color Mode: switch between a directional "Volume Gradient" (colors ramp from the leg's start color, through its POC-box color, to its end color) or a "Delta (Buy vs Sell)" mode that colors each box green or red based purely on whether buy or sell volume dominated it.
- Volume Anomaly Bubbles: circular markers on bars whose volume spikes past a multiple of its 20-period average, sized by spike magnitude, with the raw volume number shown directly on the most extreme spikes and always available via hover tooltip.
- Max Profile Boxes Ceiling: a hard cap on how many boxes a single leg's profile can be divided into, coarsening box height automatically for unusually large legs rather than ever exceeding the cap.
1.3 How to Use the Indicator
- Read each leg's POC as the price that leg's participants most agreed on - it's the single box that absorbed more real, 1-minute-resolution volume than any other box in that structural move.
- Treat still-extending (untested) POC lines as open business - a POC line still growing forward means price has not yet returned to trade through that level since the leg that created it completed.
- Use the box color gradient to spot where a leg's volume was front-loaded or back-loaded - in Volume Gradient mode, boxes near the leg's origin vs. its completion are visually distinct, making it easy to see whether volume built up early or late in the move.
- Switch to Delta mode when you care about aggression, not just volume - a leg whose boxes are colored uniformly one direction (all green or all red) reflects consistent buy- or sell-side aggression throughout the move, while mixed colors suggest two-sided fighting within the same leg.
- Watch volume bubbles as confirmation, not a standalone signal - a large bubble appearing right as a leg approaches its POC or breaks structure adds weight to that event, since it flags participation well above the recent average.
1.4 How the Indicator Works
Inputs & Their Roles
- atrPeriod ("ATR Period", default: 5): the ATR length that feeds the ZigZag's reversal threshold - this only affects how sensitively swing pivots are detected, not how the resulting profiles are sliced into boxes (see the implementation note below).
- swingMult ("Swing Multiplier (ATR)", default: 2.5): the multiplier applied to that ATR to get the reversal amount required to confirm a new pivot - higher values require larger reversals and therefore produce fewer, larger legs.
- maxBoxes ("Max Profile Boxes", default: 50, range 10-150): a ceiling on how many boxes a single leg's profile can ever be divided into, regardless of how tall the leg is.
- alignMode ("Profile Alignment", default: "Left", options: Left/Right/Center): horizontal text alignment of the ASCII volume bar and volume number inside each box.
- showBoxVol ("Show Volume Value Inside Boxes", default: true): appends the box's actual volume number after its ASCII bar - the ASCII bar itself is always shown regardless of this toggle.
- extendPoc ("Extend Untested POCs", default: true): when enabled, a leg's POC line keeps extending forward bar by bar until price trades through that exact price, subject to the built-in 2-per-direction active cap described below.
- showBubbles ("Show Volume Bubbles", default: true): toggles the volume anomaly markers entirely.
- bubbleMult ("Spike Threshold (x SMA)", default: 2.0): how many times a bar's volume must exceed its own 20-period volume average to trigger a bubble marker at all; a fixed 1.5× multiple of this same value is used internally as the further threshold for printing the raw volume number on the bubble.
- colorMode ("Box Color Mode", default: "Volume Gradient", options: Volume Gradient / Delta (Buy vs Sell)): switches every profile box's coloring logic between a positional directional gradient and a buy/sell-dominance gradient.
- upStartC / upMidC / upEndC ("Up Leg (Low/Mid/High Vol)", defaults: dark blue / blue / cyan) and dnStartC / dnMidC / dnEndC ("Down Leg (Low/Mid/High Vol)", defaults: deep purple / magenta / red): the three-stop gradient colors used in Volume Gradient mode for up-legs and down-legs respectively, and also used for the leg's dashed POC line and summary label textcolor.
Main Logic Flows
🎯 Flow 1: What You See
- A dotted line tracing each raw ZigZag leg, a set of colored boxes running the full width of that leg with ASCII block-bar volume text inside each, a dashed POC line (possibly still extending forward), a compact summary label at the leg's midpoint, and optional colored bubble markers on abnormally high-volume bars.
📥 Flow 2: Accumulating Lower-Timeframe Bars
- Every chart bar, request.security_lower_tf() fetches every 1-minute bar that occurred during it. Each returned 1-minute bar has its volume split into an estimated buy and sell portion using the same close-position-in-range proxy technique used throughout this session's indicators, then gets pushed into a running history array tagged with the current chart bar's index. If no lower-timeframe data is available (for example, the chart is already at 1-minute resolution or lower), the current chart bar's own OHLCV is used as a single synthetic entry instead. A hard cap shifts out the oldest entry if the history ever exceeds 90,000 bars, as a safety net independent of the leg-completion pruning described in Flow 4.
📐 Flow 3: ZigZag Pivot Detection
- A standard two-state ZigZag tracks a running high while trending up (or a running low while trending down); the instant price pulls back from that extreme by more than ATR(atrPeriod) × swingMult, the current pivot is confirmed, the ZigZag flips direction, and it begins tracking the opposite extreme from there.
🧱 Flow 4: Building & Drawing a Leg's Profile
- The instant a pivot confirms, a dotted line is drawn between the leg's start and end prices, and the accumulated 1-minute history is filtered down to just the bars whose chart-bar index falls within this leg's span. If any such bars exist, the leg's true high-low range (from the 1-minute data, not just the pivot prices) is measured, and a box height is chosen - either the fixed ATR(14)/10 baseline, or a coarser height if that baseline would produce more boxes than maxBoxes allows.
- The leg's price range is then divided into evenly-sized boxes matching that height as closely as possible, and every 1-minute bar's volume (and its buy/sell split) is distributed proportionally across every box its own high-low range overlaps - the same proportional-overlap technique used for volume profiles elsewhere in this project. The box with the single highest accumulated volume becomes the leg's POC.
- Each box is then drawn spanning the leg's full width, containing an ASCII block-bar (length scaled by how many bars wide the leg is) representing its share of the leg's peak box volume, colored per the selected color mode. A dashed line marks the POC price across the leg, and a summary label reports total leg volume, net delta, and POC price. Finally, the 1-minute history array is rebuilt to keep only bars occurring at or after this leg's end, discarding everything this leg just consumed.
📏 Flow 5: Untested POC Extension & the 2-Per-Direction Cap
- Every bar, every tracked untested POC line has its right edge extended to the current bar. If price trades through that exact POC price this bar (high/low bracket it), the POC is marked tested and removed from active tracking, leaving its line frozen at its final extended position.
- Separately, the indicator counts how many untested POCs of each direction (bullish vs. bearish) remain active, scanning from most-recently-created to oldest. The moment a third bullish (or third bearish) untested POC is encountered in that scan, it - and any older excess ones - has its line's right edge pulled back to its own leg's end bar (not the current bar) and is removed from active tracking, effectively freezing it at a shorter length than it had already grown to. This keeps at most two untested POCs per direction actively extending at any time.
💥 Flow 6: Volume Anomaly Bubbles
- Every bar's volume is compared against its own 20-period simple moving average; once the ratio clears bubbleMult, a circular marker is drawn at the bar's midpoint, colored green or red by whether that bar closed up or down, and sized continuously by how extreme the spike is. Only spikes at or above 1.5× the configured threshold get the actual volume number printed on the marker itself; smaller qualifying spikes still show a hover tooltip with the exact volume and multiple.
Outputs & Usage Roles
- Leg profile boxes: a true, 1-minute-resolution volume distribution for every structural swing leg, not a same-timeframe approximation.
- POC line: the single price level within each leg that absorbed the most volume, optionally kept alive until price actually revisits it.
- Summary label: a quick per-leg readout of total volume, net delta direction and magnitude, and POC price.
- Volume bubbles: a separate, leg-independent flag for individual bars with unusually heavy participation.
- Alerts: none - this script defines neither alertcondition() nor dynamic alert() calls anywhere.