1. Regression Liquidity Strategy Description
An oscillator built from the slope of a non-repainting kernel-smoothed regression curve, used to spot weakening momentum, place liquidity levels at swing extremes, and flag when those levels later get swept
1.1 Indicator Concept
At the core of this indicator is the Nadaraya-Watson estimator, a statistical smoothing technique that fits a curve through price by giving nearby bars more "vote" than distant ones, with the vote fading smoothly (a bell-curve/Gaussian shape) rather than cutting off sharply like a simple moving average's window edge. The result is a noticeably smoother line than a typical moving average, without the sharp lag-vs-smoothness trade-off.
- Slope, not level, drives the oscillator: rather than comparing price to the regression line directly, this indicator tracks how much the regression line itself moved from one bar to the next (its slope/velocity), then normalizes that against its own recent typical swings - turning "is the smoothed trend accelerating or decelerating" into a bounded, comparable oscillator.
- Liquidity levels mark momentum peaks, not price patterns: a new level is placed not from a chart pattern but from the exact moment the oscillator - while still net bullish or bearish - starts losing steam (crosses its own signal line). The level is anchored to the highest/lowest price reached during that momentum phase, marking where a move likely ran out of buyers/sellers.
- Only one level is "live" at a time: each new level replaces the previous one as the thing being watched for a "sweep" (price closing back through it) - older levels stay drawn on the chart as history, but are no longer monitored.
- Non-repainting by design: the regression estimate at any bar is computed only from that bar and bars before it - it is never revised once a bar closes, unlike some other public Nadaraya-Watson scripts that recompute historical values as new bars arrive.
1.2 Indicator Features
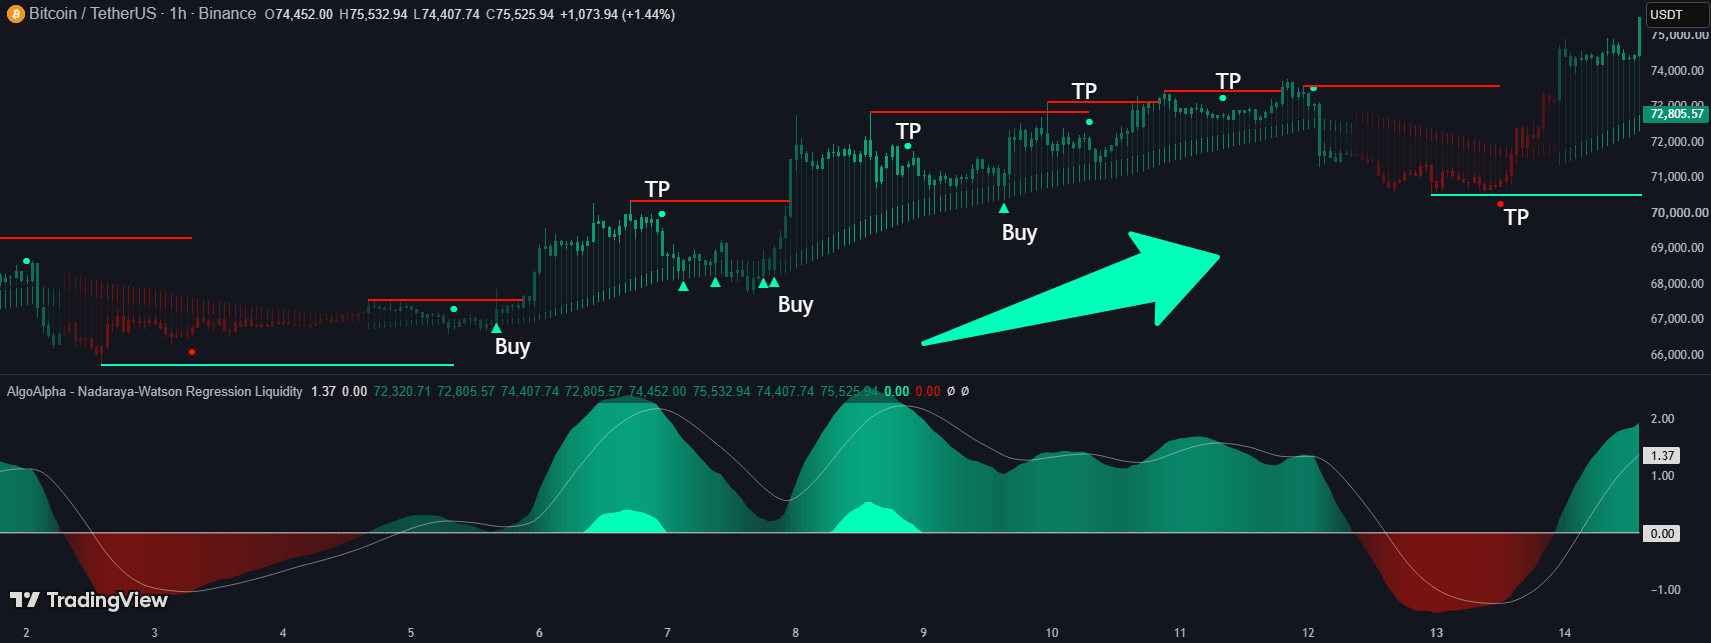
- Oscillator (in the indicator's own pane): a smoothed, normalized slope reading centered on zero, with a gradient-colored fill (deeper color = more extreme reading, up to a ±3 cap) and a separate flat-colored fill highlighting readings beyond ±2 ("overflow" zone). An optional EMA signal line can be shown for crossover reference.
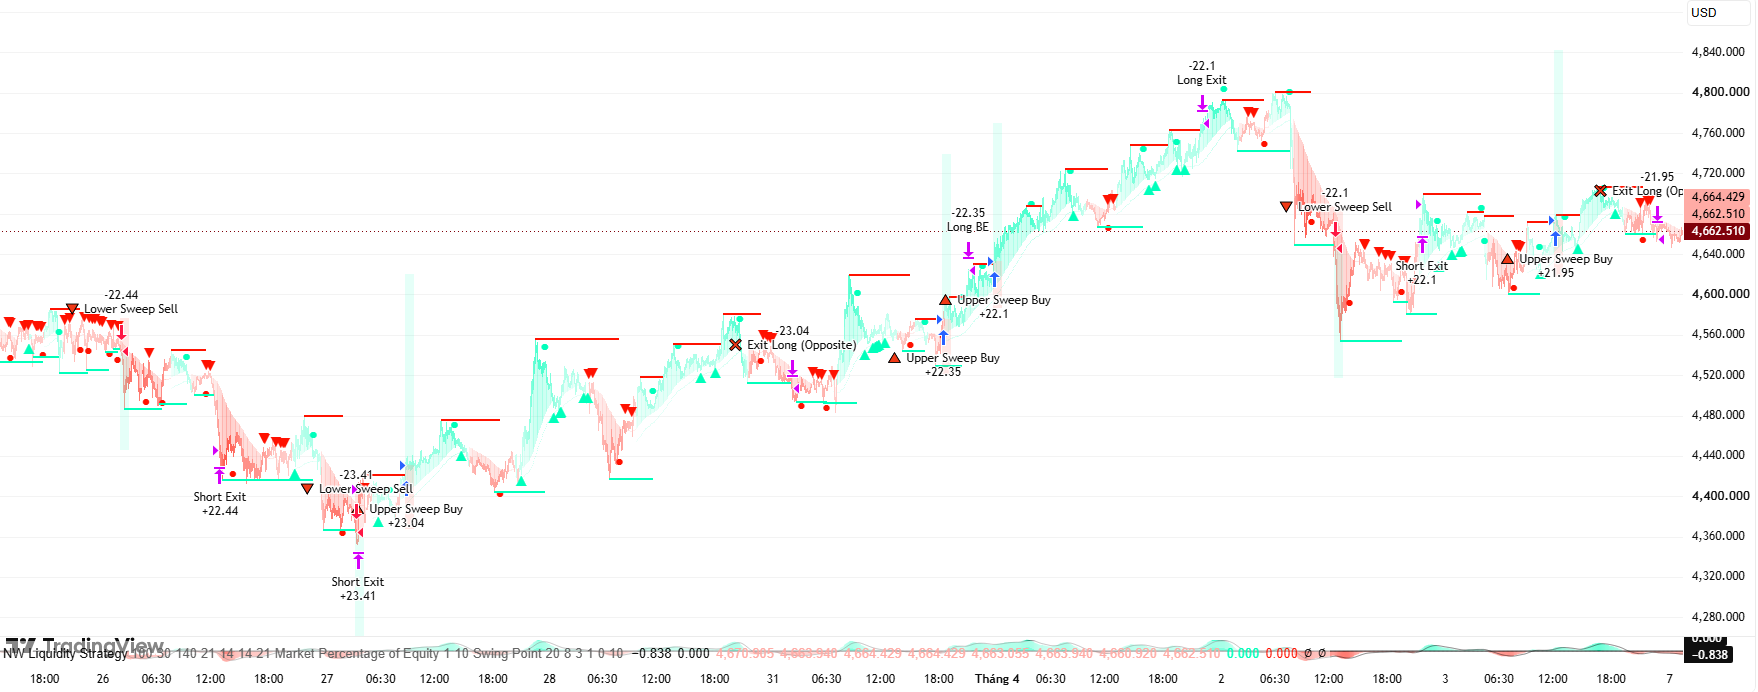
- Liquidity Sweep Levels (drawn on the price chart): a horizontal line placed at a recent swing high (red, default) when bullish momentum weakens, or a recent swing low (green, default) when bearish momentum weakens. Only the single most recent level is actively tracked for a sweep at any time.
- Nadaraya-Watson Band Candles (optional, overlay): synthetic candles tracing the regression curve with a volatility-sized wick extending toward real price - a visual gauge of how far price has stretched away from the smoothed trend.
- Bar Colour Candles (optional): recolors the real price candles by the oscillator's current bullish/bearish gradient color.
- Momentum Weakening Dots (optional): small circle markers appearing exactly when a new liquidity level is created - a secondary visual cue for the same event.
- Rebound Markers (optional): triangles marking when price closes back across the regression curve while the oscillator still favors that same direction.
- Alerts: 10 plain alert conditions (no custom message text, using TradingView's default alert wording) covering momentum weakening, signal crosses, zero crosses, new liquidity levels, and levels being swept.
1.3 How to Use the Indicator
- Treat liquidity levels as "exhaustion" markers: a red level sits at a local high reached right as buying pressure faded; a green level sits at a local low reached right as selling pressure faded - both are candidate reaction zones if price returns to them.
- Watch for a "sweep" as a follow-through/failure signal: the "Level Swept" alerts fire when price closes back through the single currently-active level - useful as confirmation that the prior exhaustion point has been overrun (a potential continuation or trap, depending on context).
- Use the oscillator's zero-line and signal-line crosses for earlier, more frequent reads than the liquidity-level events - "signal cross" events are broader (any momentum-line cross), while "weakening momentum" events are a narrower subset that also require the oscillator to still be net bullish/bearish at the time.
- Use the NW Band Candles to gauge stretch: a long wick reaching far from the band's body means price has moved unusually far from the smoothed trend relative to recent volatility.
- Tune Bandwidth/Lookback for your timeframe: raise them for a slower, more stable regression line on higher timeframes; lower them to track price more closely on faster charts.
1.4 How the Indicator Works
Inputs & Roles
- nw_bandwidth ("Nadaraya-Watson Bandwidth", Integer, default: 30, min 1): controls how quickly the Gaussian kernel's weight fades with distance from the current bar. Example: with a small bandwidth, a bar 20 bars back gets almost no weight; with a large bandwidth, it still contributes meaningfully. Increase → smoother, slower-turning regression. Decrease → tracks price more closely but noisier.
- nw_lookback ("Nadaraya-Watson Lookback", Integer, default: 140, min 1): how many bars back the weighted-average summation actually runs (the loop's hard cutoff, separate from the bandwidth's soft decay). Increase → more history considered, more stable curve. Decrease → focuses on more recent action, reacts faster.
- norm_len ("Normalization Length", Integer, default: 100, min 1): the standard-deviation window used to turn the raw regression slope into a bounded oscillator. Increase → more stable, slower-adapting scaling. Decrease → scaling adapts faster but the oscillator can look more reactive/noisy.
- osc_smooth_len ("Oscillator Smoothing Length", Integer, default: 21, min 1): WMA smoothing length applied after normalization. Increase → smoother oscillator, fewer sharp turns. Decrease → more responsive but choppier.
- signal_len ("Signal Length", Integer, default: 14, min 1): EMA length of the oscillator's signal line, used for all crossover-based events. Increase → slower, less frequent crosses. Decrease → earlier, more frequent crosses.
- atr_len ("ATR Length", Integer, default: 14, min 1): ATR window feeding the volatility measure used by the price overlay. Increase → smoother volatility reading. Decrease → reacts faster to recent range changes.
- vol_smooth_len ("Volatility Smoothing Length", Integer, default: 21, min 1): SMA smoothing applied to that ATR before use. Increase → steadier band-candle wicks/rebound-marker distance. Decrease → expands/contracts more quickly.
- use_tip ("Use Swing Points", Boolean, default: true): when on, a new liquidity level anchors to the highest high (or lowest low) reached during the whole momentum phase leading up to the signal event, not just the current bar. Off → the level always anchors to the current bar's high/low at the moment the event fires, ignoring any earlier, more extreme point in that phase.
- show_nw_band_candles / show_bar_color_candles / show_signal_line / show_momentum_signals / show_rebound_signals (all Boolean, default: true): independent display toggles. All are purely visual - disabling any of them does not change any calculation, level, signal, or alert (confirmed directly by the tooltips in the source).
- green / red ("Bullish Colour" / "Bearish Colour"): used across the oscillator fills, band candles, bar coloring, liquidity levels (green = lower/support-type levels, red = upper/resistance-type levels), and momentum markers. Purely cosmetic, but shared across many elements at once.
Main Logic Blocks
🎯 Flow 1: What You See — Oscillator Pane + Price-Chart Overlays
- In the indicator's own pane: a gradient-filled oscillator line, an optional signal line, a zero baseline, and a distinctly-colored "overflow" fill for readings beyond ±2.
- Overlaid directly on the real price chart (via force_overlay=true, since the indicator's own pane is separate): the optional NW band candles, the optional recolored price candles, the liquidity-sweep level line(s), the momentum dots, and the rebound triangles.
📉 Flow 2: The Regression Curve (Nadaraya-Watson, Causal)
- For every bar, a Gaussian-weighted average is computed over nw_lookback bars, starting at the current bar and going backward only. Each bar i bars back gets a weight exp(-i²/(2×bandwidth²)) - a smooth bell-curve decay, so the current bar counts most and influence fades gradually rather than dropping off a hard cliff at the window edge.
- Because the sum only ever looks backward (never at future bars), each bar's regression value is final the moment that bar closes - it will not be redrawn or revised retroactively as new bars arrive, unlike some other public Nadaraya-Watson implementations.
- The bar-to-bar change in this curve (nw_slope) is what everything else in the indicator is built from - not the curve's absolute level.
🔧 Flow 3: Turning Slope Into the Oscillator
- The raw slope is divided by its own rolling standard deviation (norm_len bars) - a z-score-style normalization that answers "how unusual is today's curve movement compared to its own recent typical movement," rather than an arbitrary raw number.
- That normalized value is smoothed with a WMA (osc_smooth_len) to produce the displayed oscillator, then a separate EMA (signal_len) of the oscillator forms the signal line used for all crossover events.
📌 Flow 4: Tracking the Extreme of Each Momentum Phase
- Whenever the oscillator is above its signal line (a "bullish phase"), the indicator keeps a running record of the single highest high reached so far during that unbroken phase - resetting to the current bar's high the instant a new phase begins, then only ever ratcheting upward as long as the phase continues.
- The mirror image happens for "bearish phases" (oscillator below signal), tracking the lowest low.
- These tracked extremes are what feed the liquidity level's price (Flow 5) whenever "Use Swing Points" is enabled.
📏 Flow 5: Placing & Monitoring a Liquidity Level
- A new upper level is triggered the instant the oscillator, while still net positive, crosses back below its own signal line (bullish momentum peaking). A new lower level triggers the mirrored way (oscillator net negative, crossing back above signal).
- The level's price is either the tracked phase-extreme from Flow 4 (if "Use Swing Points" is on) or simply the current bar's high/low (if off, or if no tracked extreme exists yet).
- Only one level is tracked as "active" at any time - creating a new one immediately retires whatever was active before it (the old line stops extending and is no longer checked for a sweep, but its already-drawn segment remains visible on the chart as a historical marker).
- While a level is active, its line is redrawn to extend to the current bar every bar. A "sweep" is detected the moment price closes back through the level in the direction that invalidates it (closing above an upper/red level, or below a lower/green level) - at which point it is retired, whether or not a new level is being created on that same bar.
🔔 Flow 6: Momentum, Zero-Cross & Rebound Events
- Weakening momentum (bullish/bearish) is exactly the same condition that creates a new liquidity level - the dot marker and the new level are two visual expressions of one event.
- Signal cross events are broader: "bullish signal cross" is simply any upward cross of the oscillator over its signal line, regardless of whether the oscillator is currently positive or negative - "weakening bearish momentum" is the narrower special case of that same cross additionally requiring the oscillator to still be net-negative at that moment.
- Zero cross events fire when the oscillator itself crosses 0 - a simpler, independent "net momentum flipped direction" signal, unrelated to the signal line.
- Rebound events fire when price closes back across the regression curve itself (not the oscillator's signal line) while the oscillator still agrees with that direction - e.g. a bullish rebound needs the oscillator net-positive AND price closing above nw_val after closing below it the bar before.
🎨 Flow 7: NW Band Candles & Price Coloring
- The oscillator's color (col_) is a gradient that gets more saturated the further the oscillator sits from zero, capped at a ±3 reference range - a different, finer-grained extremity cue than the ±2-based "overflow" fill shape used in the oscillator pane.
- The synthetic NW band candle's close is always the regression value itself; depending on whether the oscillator is bullish or bearish, either its open/high side or its open/low side is pinned to (regression value ± one volatility unit) while the opposite wick stretches out to the real bar's actual high or low - visually showing how far real price has strayed from the smoothed trend, scaled by typical recent volatility.
- Bar-color candles simply repaint the real OHLC candles with the same gradient color, independently of the band-candle overlay.
🔔 Flow 8: Alerts
- 10 total alertcondition() calls, all using the plain 2-argument form (condition + title, no custom message) so TradingView generates the alert text automatically: Weakening Bullish/Bearish Momentum, Bullish/Bearish Signal Cross, Bullish/Bearish Zero Cross, New Upper/Lower Liquidity Sweep Level, and Upper/Lower Liquidity Sweep Level Swept.
Outputs & Usage Roles
- Oscillator + signal line: a momentum-of-momentum read, useful for early, frequent crossover signals.
- Liquidity level lines: the primary actionable output - single, currently-watched exhaustion levels with a dedicated "swept" alert.
- NW band candles + bar coloring: a visual gauge of trend direction and how far price has stretched from the smoothed regression line.
- Momentum dots + rebound markers: supplementary visual cues tied to the same underlying events as the alerts.