1.Swing Failure Signals Strategy Description
An indicator that detects the Swing Failure Pattern (SFP) — price sweeps a prior swing high/low and then fails to continue, reversing instead — by combining a "liquidity sweep" event with a "Change in State of Delivery" (CISD) confirmation within a limited time window.
1.1 Indicator concept
The Swing Failure Pattern (SFP) theory: when price breaks (sweeps) through a previously formed swing high or low — typically triggering the stop losses of traders holding the opposite side, plus the entry orders of breakout traders — but then FAILS to continue in that direction and reverses instead, this is a sign the break was really a "liquidity grab" / stop hunt by large players, not a genuine breakout.
The indicator confirms this pattern through exactly 2 required steps: (1) detecting a sweep event on a prior swing high/low, and (2) within a limited time window (Patience) after that sweep, confirming a Change in State of Delivery (CISD) — a key price level breaking in the opposite direction, with a noise filter on how strong the failed reversal attempt was — before the whole thing counts as a valid Swing Failure signal.
1.2 Indicator features
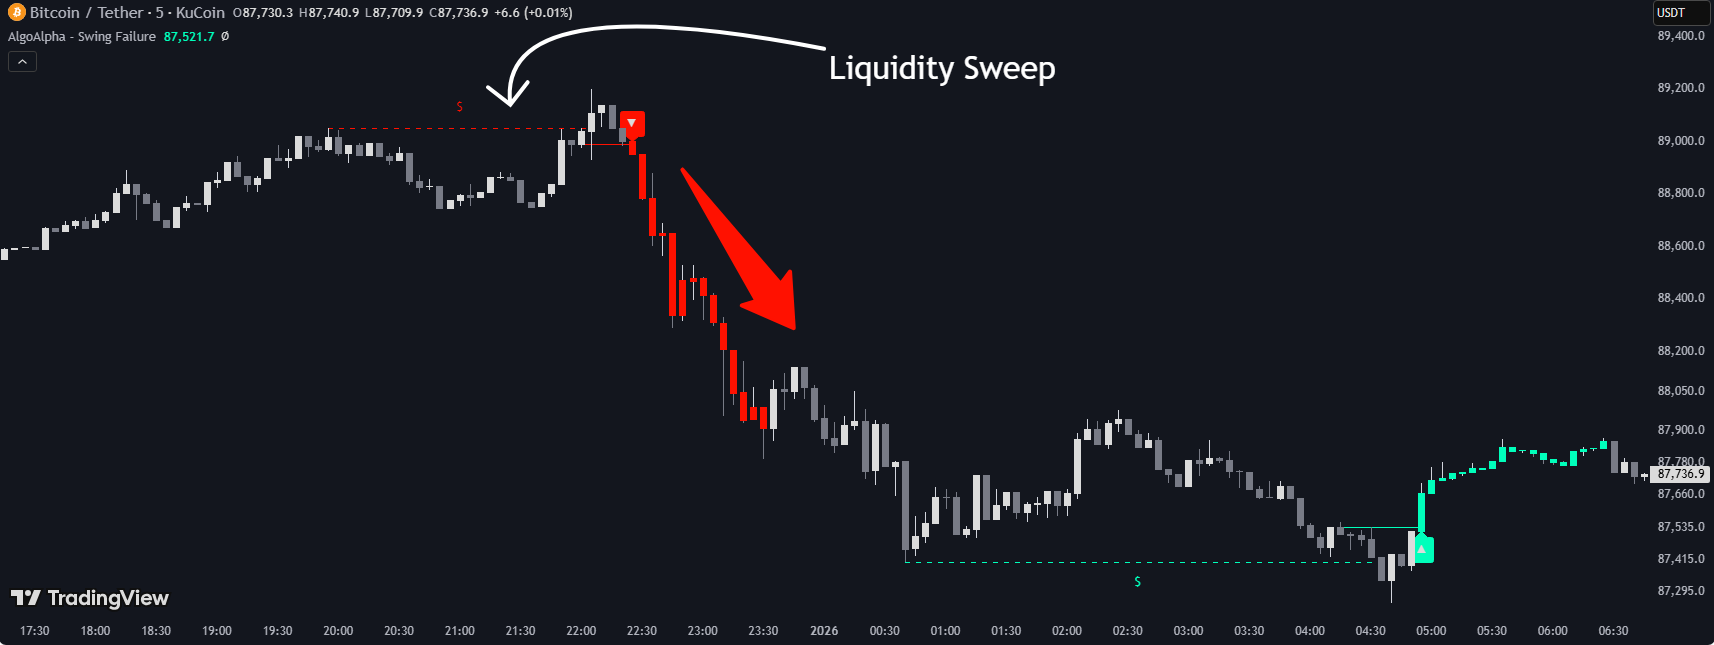
- Full bar coloring (barcolor): colors EVERY bar (not just the signal bar) according to the current "regime" — teal (Bullish SFP in effect) or red (Bearish SFP in effect) — until a new opposite-direction CISD appears and the coloring turns off.
- Signal arrows: ▲ below the low on a Bullish SFP, ▼ above the high on a Bearish SFP.
- Liquidity-sweep line (dashed) + "$" label: marks the exact swing high/low that was just swept, with a "$" label at its midpoint to flag it as a liquidity zone that just got "eaten".
- CISD line (solid): marks the price level that confirmed the delivery shift — usable as a support/resistance level for the newly formed trend.
- Alert: has 2 separate alertcondition entries — "Bullish SFP" and "Bearish SFP" — the user needs to manually create an alert on TradingView's UI based on these conditions (the indicator does not fire a runtime alert() itself).
1.3 How to use it in trading
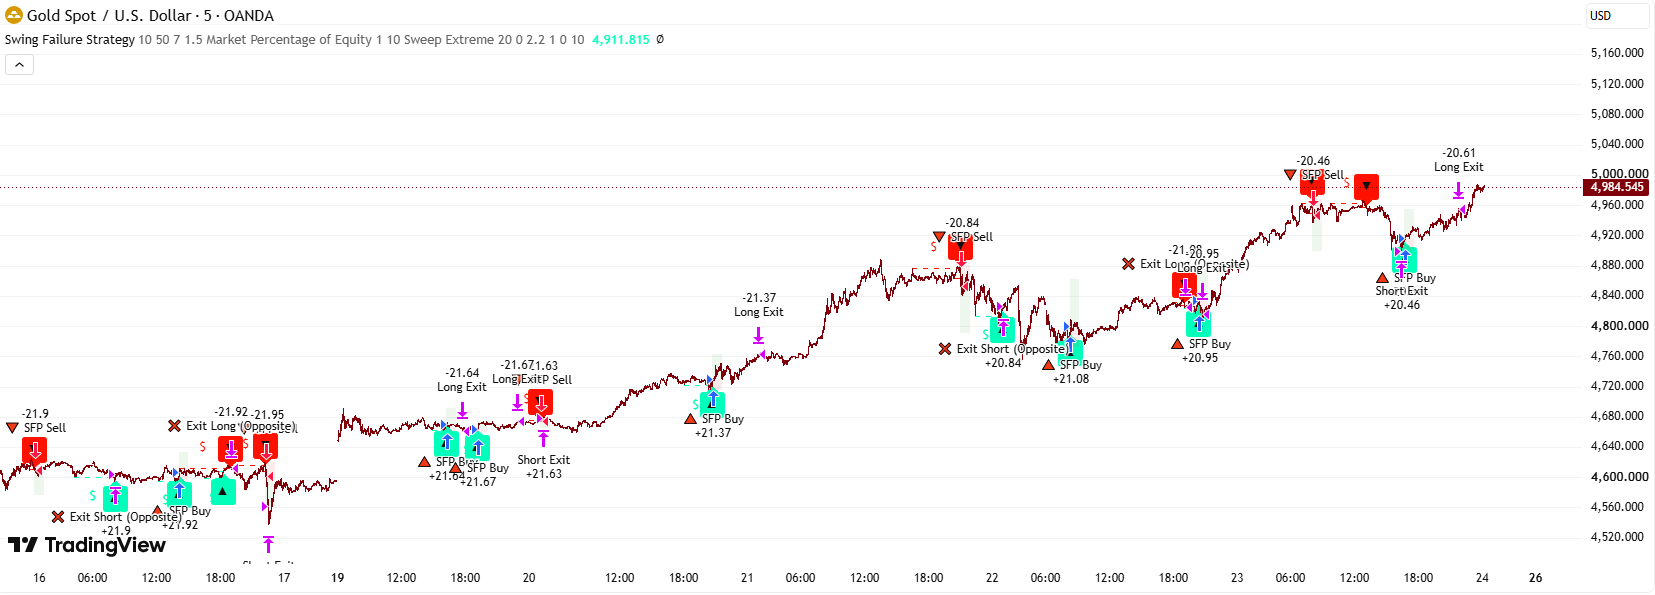
- Wait for the ▲/▼ arrow plus the candles turning fully teal/red — that's a fully confirmed Swing Failure signal (both the sweep and the CISD have happened), worth considering an entry in the direction of the arrow.
- Use the dashed line (the swing high/low that was just swept) as a Stop Loss reference — since it's the exact liquidity zone that was just "eaten", price rarely breaks back through it immediately a second time.
- Use the solid line (the CISD level) as a dynamic support/resistance zone for the newly formed trend — if price closes back through this line, the signal can be considered invalidated.
- Candles keep their teal/red color even after the signal bar — use this to visually track which regime the current trend is leaning toward, until a new opposite-direction CISD changes the color.
- Raise "Patience" if price tends to take a while to recover after a liquidity sweep (giving the indicator more time to confirm the CISD); lower it if you only want signals confirmed by a fast enough reaction right after the sweep.
- Raise "Trend Noise Filter" (tolerence) for a stricter filter that keeps only CISDs backed by a strong enough failed reversal attempt (fewer false signals); lower it for a more sensitive indicator that accepts weaker reversal attempts too.
- Adjust "Pivot Detection Length" to match your trading style: raise it to only catch large, significant swing points; lower it to also catch small swings, better suited to shorter-term trading.
1.4 How the indicator works
Inputs & their role
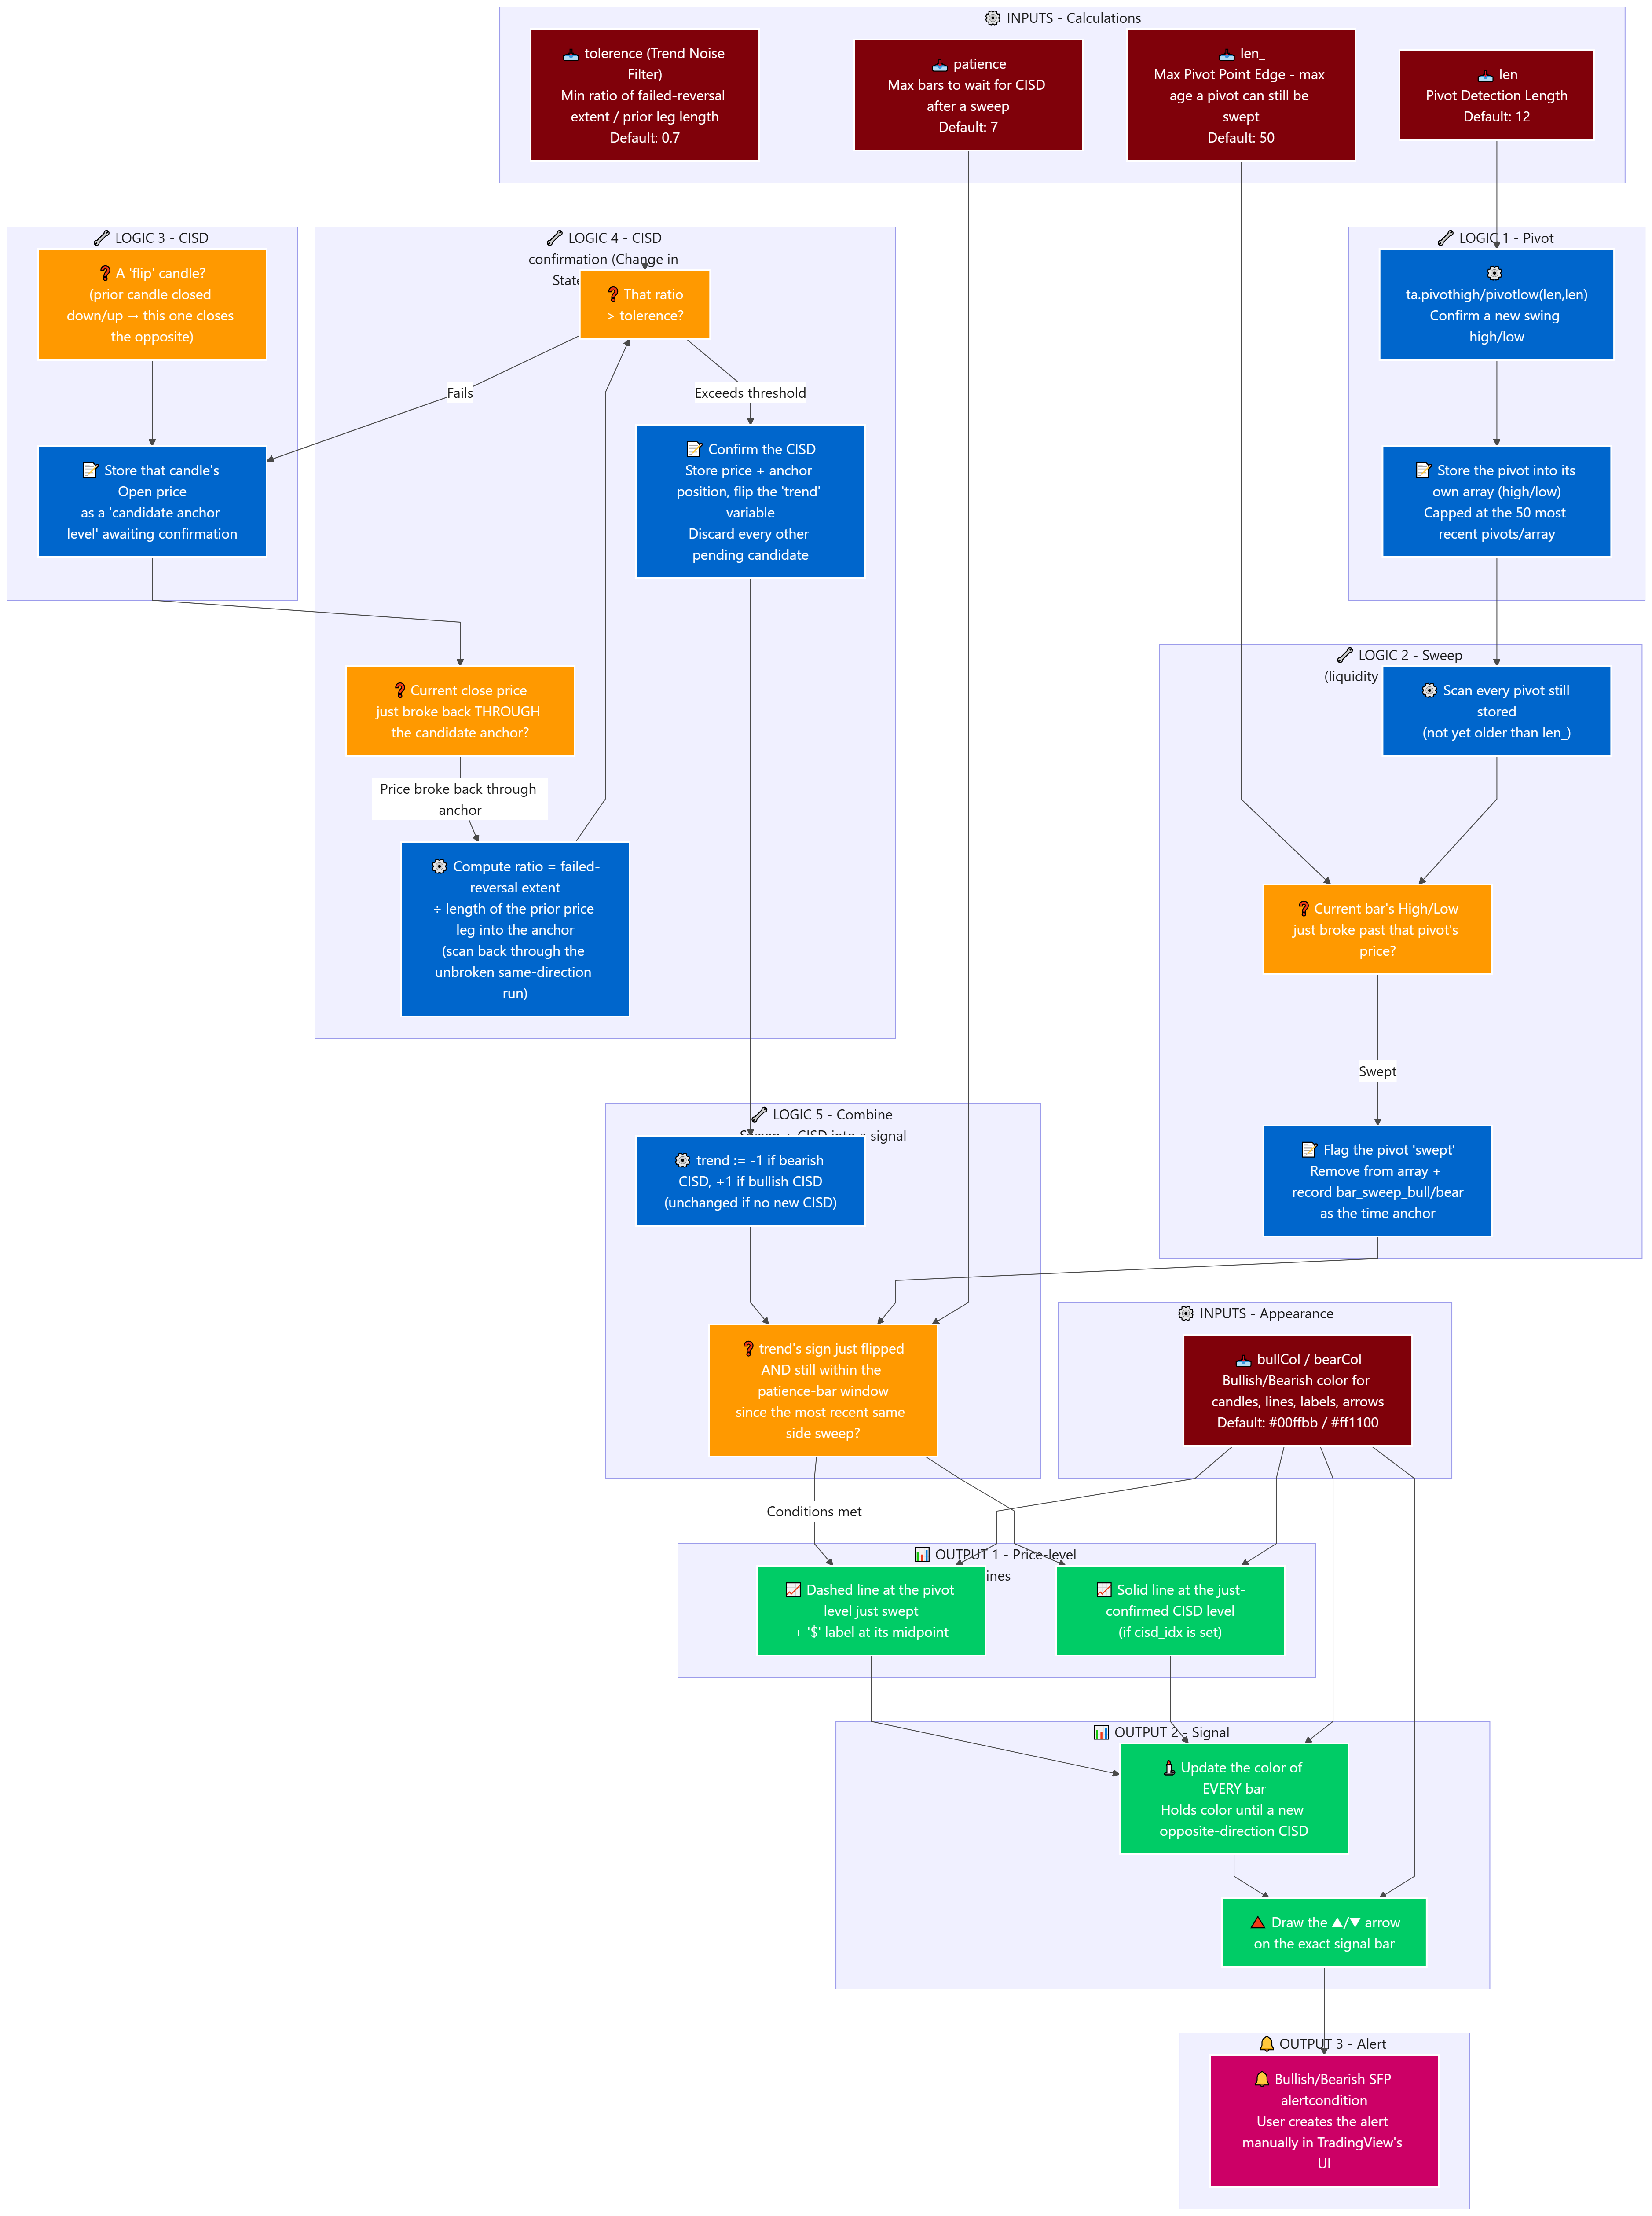
- len (Pivot Detection Length, default 12): bars required on each side to confirm a swing high/low (pivot). Raising it only catches larger, more significant, more reliable pivots but confirms them later; lowering it catches more, smaller pivots — more sensitive but noisier.
- len_ (Max Pivot Point Edge, default 50): the maximum age (in bars) a pivot can be and still count as "still active" and eligible to be swept. E.g. a pivot formed 60 bars ago (>50) → the indicator no longer considers it sweepable, treating it as too old to carry meaningful liquidity anymore.
- patience (Patience, default 7): the maximum number of bars allowed to pass BETWEEN the moment a pivot gets swept and the moment a CISD confirms the reversal. E.g. a sweep happens on bar X; if the CISD only confirms on bar X+10 (>7) → the signal is NOT recognized as a valid Swing Failure (the CISD still flips the trend, it just can no longer be attributed to that specific sweep event).
- tolerence (Trend Noise Filter, default 0.7): the minimum ratio between "how far the failed reversal attempt extended" versus "the length of the prior price leg leading into the CISD anchor" for a CISD to be accepted. E.g. the prior down-leg was 20 points (denom=20), the following up-attempt extended 16 points above the anchor (highest−p_val=16) → ratio 16/20=0.8 > 0.7 → accepted; if the up-attempt only reached 10 points → ratio 0.5 < 0.7 → rejected as noise, not strong enough to confirm a genuine reversal.
- bullCol / bearCol (color, default ■ #00ffbb / ■ #ff1100): the color used for EVERY bullish/bearish element — candles, lines, labels, signal arrows.
Main logic blocks
- Working backward from what's displayed: the signal arrows + candle color + both line types (sweep + CISD) all originate from exactly 2 variables, bullsfp/ bearsfp, which only turn true when BOTH conditions are met: a pivot sweep just occurred AND a CISD reversal was just confirmed, happening within the allowed patience-bar window.
- Pivot-detection layer: on every bar, uses TradingView's standard pivot function (len bars of lag on each side) to find new swing highs/lows; each pivot found is stored into one of 2 separate arrays (highs/lows), capped at the 50 most recent pivots per array.
- Sweep-detection layer: on every bar, scans through EVERY pivot still stored in the array (not yet older than len_ bars), checking whether the current bar's price (high for a pivot-high, low for a pivot-low) just broke past that pivot's level; if so, that pivot is flagged "swept" and REMOVED from the array (it can't be swept a second time), and the bar position of the sweep is recorded as the time anchor for the next CISD-confirmation step.
- CISD-candidate detection layer: whenever a "flip" candle appears (previous candle closed bearish, this one closes bullish — or vice versa), that candle's Open price is stored as a "candidate anchor level" awaiting confirmation.
- CISD-confirmation layer: for each candidate (checked from most recent to oldest), checks whether the current close price has just broken back THROUGH that exact anchor level; if so, it measures "how far the failed reversal attempt extended" (the highest/lowest price reached from the anchor up to now) against "the length of the prior price leg leading into the anchor" (found by scanning further back through the unbroken run of same-direction candles immediately preceding the anchor); if that ratio exceeds the tolerence threshold, the CISD is confirmed — the price + anchor position are stored, the "trend" variable flips to the matching direction, and every other pending candidate is discarded (only one CISD is locked in at a time).
- Sweep+CISD combination layer: watches for the moment the "trend" variable's sign just flipped (from ≤0 to positive = bullish CISD, from ≥0 to negative = bearish CISD); if that flip happens within the patience-bar window counted from the most recent same-side sweep, the bullsfp/bearsfp flag is set true on that exact bar.
- Drawing layer: when bullsfp/bearsfp turns on, draws the dashed line at the exact pivot level that was just swept (with a "$" label) and the solid line at the exact confirmed CISD level (if any); it also updates the candle-coloring state (holding the color until a new opposite-direction CISD appears, without needing to wait for another full sweep+patience condition), and draws the signal arrow on that exact bar.
Outputs & how they're used
- ▲/▼ arrows + candle color: a direct entry signal in the confirmed Swing Failure direction, plus a visual read of which regime the current trend is leaning toward.
- Dashed line (the sweep level): a Stop Loss reference just below/above the liquidity zone that was just "eaten" — this zone rarely gets broken again right away.
- Solid line (the CISD level): a dynamic support/resistance zone for the new trend, and also a reference point for spotting signal invalidation (if price closes back through this line).
- 2 alertconditions: let you set up automatic TradingView alerts whenever a new Bullish/Bearish SFP signal fires, without manually watching the chart.