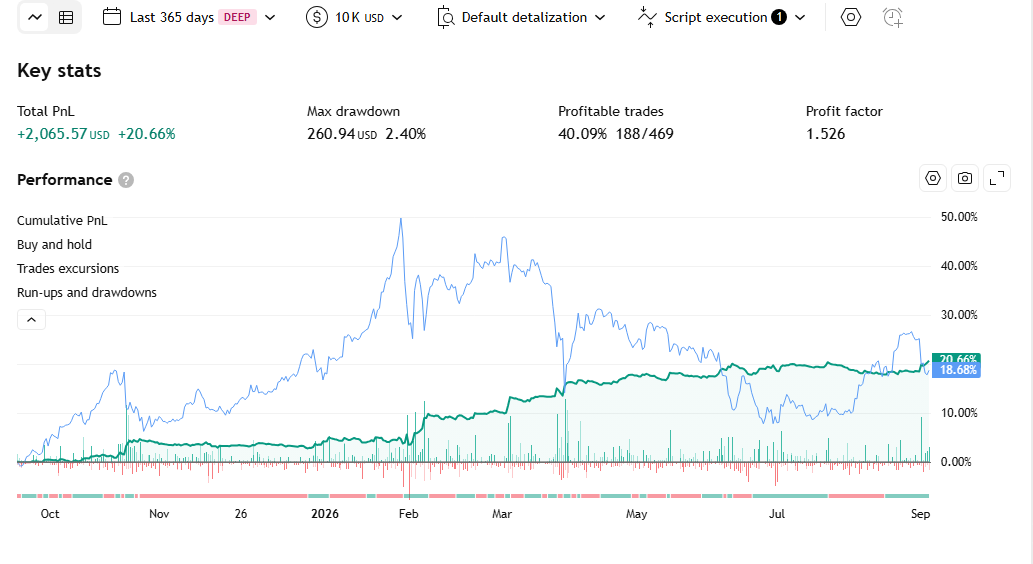
1. Volume HeatMap Divergence Strategy Description
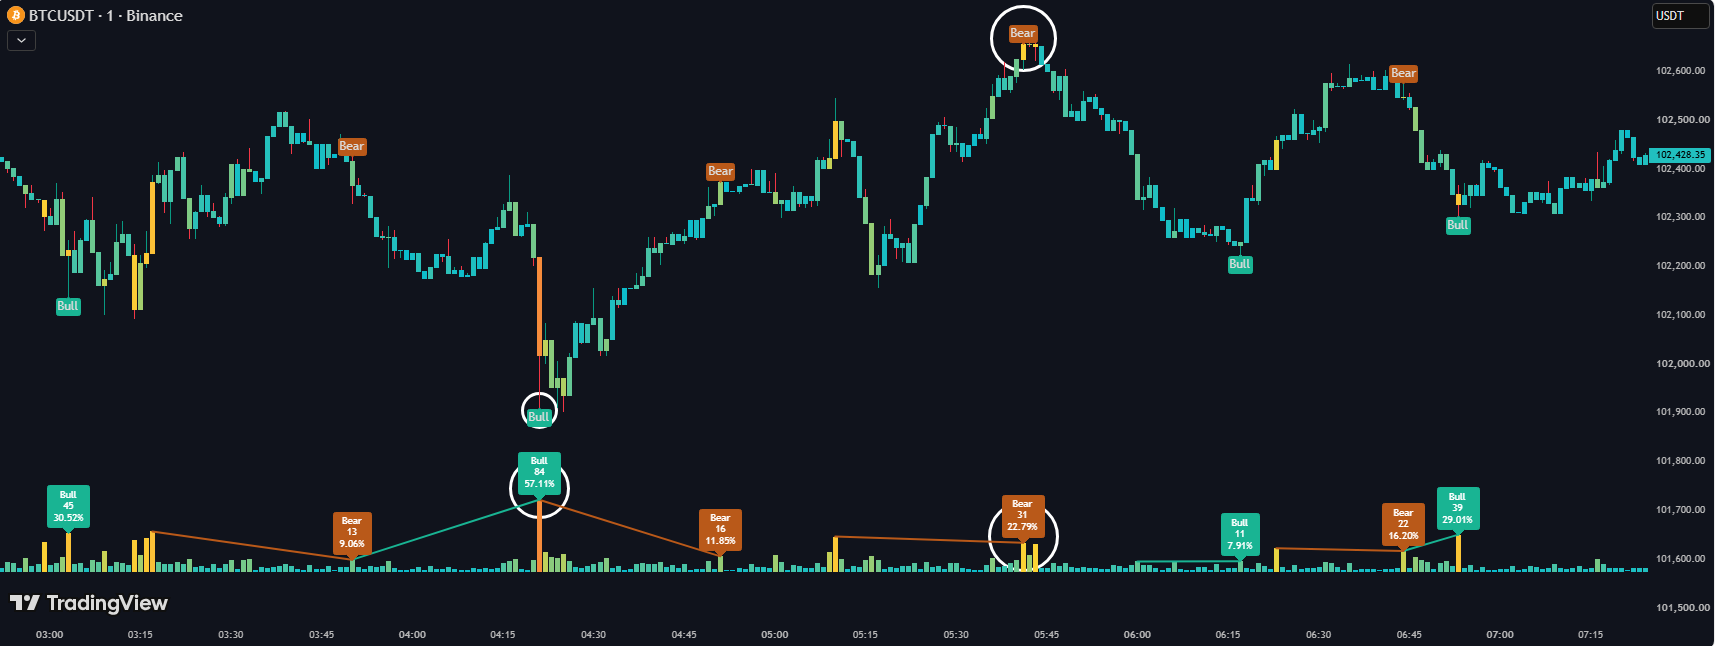
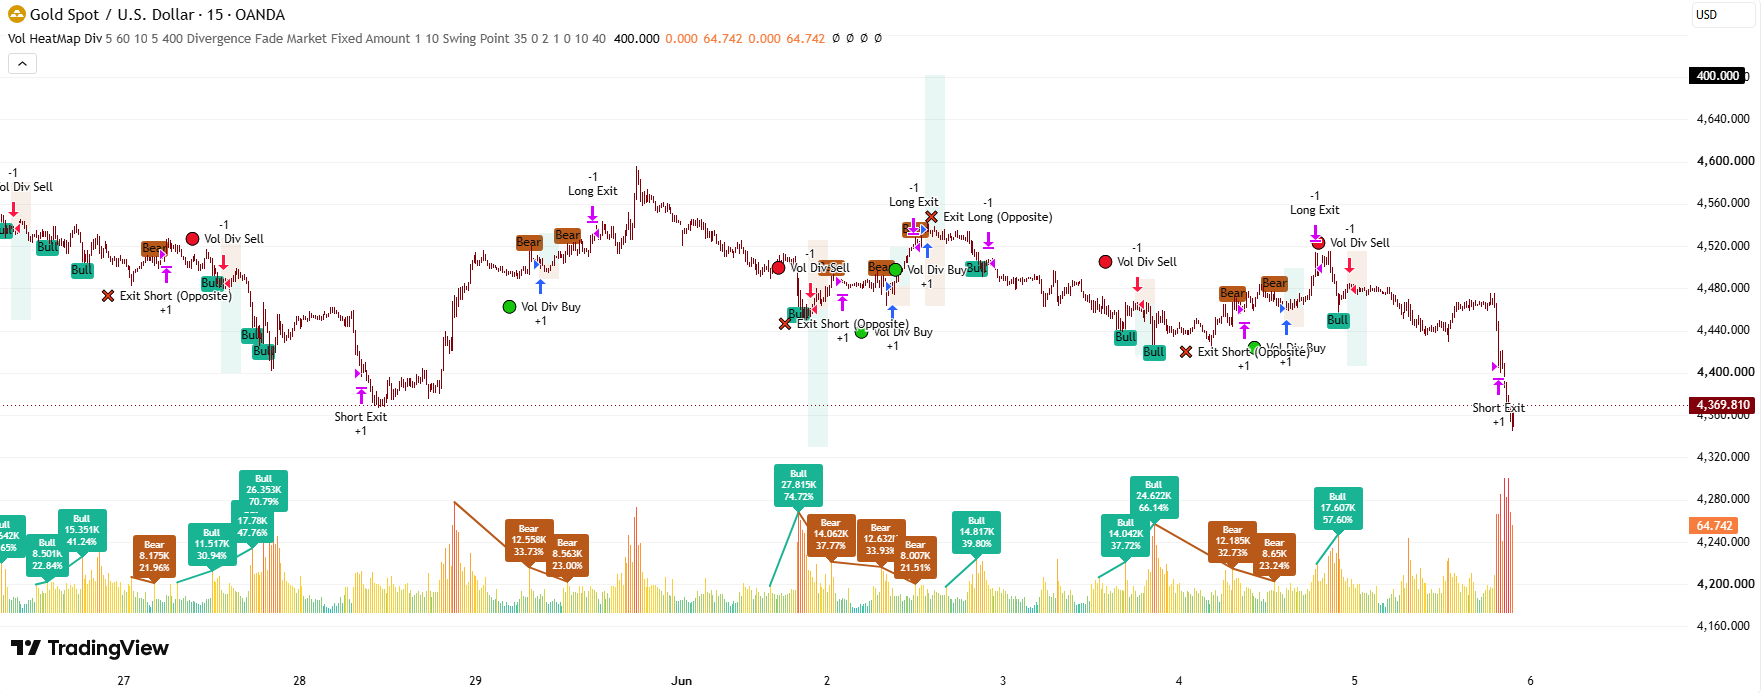
Draws volume as a percentile-colored "heatmap" directly on the price chart, while detecting divergence between VOLUME peaks (not an oscillator) and the corresponding price extremes at the same location.
1.1 Indicator Concept
This indicator replaces a traditional oscillator (RSI, MACD...) with normalized volume itself as the series used to detect divergence against price. Each candle's volume is expressed as a % of the LARGEST volume over the most recent 1000 bars (always within 0-100), then colored via a 2-stage gradient: aqua→yellow for the low zone (under 20%), yellow→red for the high zone (20-100%) - creating a visual "heatmap" effect directly on the price chart.
Divergence is detected at pivots of the normalized volume series itself (not RSI-style oscillator peaks/troughs), compared against price AT the exact same offset. Notably, the two divergence directions rely on TWO DIFFERENT THEORIES, not a perfect mirror:
- Bullish Divergence: price makes a NEW LOW LOWER than the previous low, BUT the volume peak at that moment is HIGHER than the previous volume peak - read via "climax/capitulation volume" theory: a sell-off with overwhelming volume at a new low often signals seller exhaustion, with potential for a bullish reversal.
- Bearish Divergence: price makes a NEW HIGH HIGHER than the previous high, BUT the volume peak at that moment is LOWER than the previous volume peak - read via classic divergence theory: a new price high built on WEAKENING volume momentum signals buyers running out of steam.
1.2 Indicator Features
- Volume Heatmap Track: draws normalized volume as colored columns (via plotcandle from 0 to the vol value) directly on the price chart, auto-scaled to a sensible size via an invisible anchor point ("Chart Scale" input).
- Divergence Marker on the Volume Track: a single-point marker (not a line connecting two points) appears exactly at the volume-peak position when a divergence confirms, colored by direction.
- Detailed Divergence Label: shows "Bull"/"Bear" with the actual volume (compact format like "1.2M") and normalized %, placed on the heatmap track (independently toggleable pieces).
- Label on the Real Price Chart: "Bull"/"Bear" placed EXACTLY at the actual price low/high where the divergence occurred (using force_overlay + location.absolute) - independent of the label on the heatmap track.
- No Alerts: this indicator ships with zero alertcondition() calls.
1.3 How to Use the Indicator
- Read the heatmap color as a participation "thermometer": red zones = volume near the highest level seen in the last 1000 bars (strong participation); aqua/yellow = low/average volume.
- Use Bullish divergence to spot capitulation: when price just made a new low alongside a bright red heatmap column (peak volume) versus the previous low, consider the possibility of a bullish reversal.
- Use Bearish divergence to spot classic exhaustion: a new price high but a dimmer heatmap column (weaker volume) than the previous high - a sign buyers are running out of steam.
- Read the label on the real price chart for the EXACT entry/SL reference - that's the actual position on price action, distinct from the label on the heatmap track (which is purely a volume illustration).
- Adjust "Range Min"/"Max" to filter out volume-pivot pairs that are too close together (noise) or too far apart (no longer relevant).
- Adjust "Pivot Left"/"Right" to change volume-peak detection sensitivity - note these two values are NOT symmetric by default (10 left / 5 right), meaning the confirmation lag is shorter than the length required to validate the pivot on the left side.
1.4 How the Indicator Works
Inputs & Roles
- showDiv ("Divergence", Boolean, default: true): master switch - turning it off FULLY disables divergence computation (not just hiding the display).
- labelVolume/labelPercent (Boolean, default: true/true): independently toggle the raw-volume portion and the normalized-percent portion of the detailed label.
- minRange ("Range Min", Integer, default: 5) / maxRange ("Max", default: 60): the allowed bar range between two consecutive volume peaks for a divergence to be considered valid.
- divLookLeft ("Pivot Left", default: 10) / divLookRight ("Right", default: 5): bars on each side required to confirm a peak in the VOLUME SERIES (not price).
- BullColor/BearColor (default: teal #19b493 / burnt orange #b95919): colors used across all bullish/bearish drawings.
- sizeOffset ("Chart Scale", default: 400): the value of a HIDDEN plot used as a scale anchor, keeping the volume heatmap track (0-100 scale) rendered at a sensible size when overlaid on the real price chart.
• The candleColor variable is computed (an identical formula to the upper half of volColor's gradient, the 20-100 yellow→red segment) but is NEVER used anywhere else in the code - it's dead.
• The line barcolor(volColor, display = display.none) has its display.none parameter fully DISABLE the entire native-candle coloring effect - the real price candles on the chart are NOT recolored by volume at all; only the separate heatmap track (drawn via plotcandle) shows the gradient color. This is existing behavior in the original code, not a deduction from this analysis.
Main Logic Blocks
📊 Flow 1: Normalizing Volume into "vol" (every bar)
- vol = volume / percentile_nearest_rank(volume, 1000, 100) * 100 - divides the current bar's volume by the LARGEST volume over the most recent 1000 bars (percentile 100 = the window's max value), multiplies by 100 → always within 0-100 (can never exceed 100 since the 1000-bar window ALWAYS includes the current bar itself, so the current bar can never "exceed its own maximum").
- Example: current bar's volume = 8,500. The largest volume over the last 1000 bars = 10,000. → vol = 8500/10000×100 = 85. Corresponding color: falls in the 20-100 range → yellow→red gradient at position 85/100 (close to red, very high volume).
🎯 Flow 2: Pivot Detection on the Volume Series
- PH = not na(ta.pivothigh(vol, divLookLeft, divLookRight)) - NOTE: the pivot here is computed on the vol series (normalized volume), NOT on price - this is the core distinguishing feature versus typical oscillator-divergence indicators (RSI, MACD...).
- volVal = vol[divLookRight]: the vol value AT the actual pivot bar (not the current confirmation bar) - used throughout the comparisons that follow.
🔍 Flow 3: Checking the Distance Between Two Pivots
- _inRange(PH[1]) computes bars elapsed since PH was last true (shifted back 1 bar), requiring it to fall within [minRange, maxRange] - ensuring the two compared volume peaks aren't too close together (noise) or too far apart (no longer relevant).
🐂 Flow 4: Bullish Divergence - Climax Volume at a New Low
- volHL = volVal > ta.valuewhen(PH, volVal, 1) and range_: the CURRENT volume peak is higher than the PREVIOUS volume peak. priceLL = low[divLookRight] < ta.valuewhen(PH, low[divLookRight], 1): the CURRENT low (at the same offset) is lower than the previous low. bull = PH and volHL and priceLL.
- Example: the previous volume pivot has volVal=60, low=1.2600. The current volume pivot has volVal=85 (higher than 60) and low=1.2580 (lower than 1.2600) → both conditions true → bull=true: price makes a new lower low BUT with markedly higher peak volume - a capitulation signal.
🐻 Flow 5: Bearish Divergence - Weakening Volume at a New High
- The mirror image: volLH = current volume peak is LOWER than the previous one; priceHH = current high is HIGHER than the previous one; bear = PH and volLH and priceHH.
- Example: the previous pivot has volVal=90, high=1.2700. The current pivot has volVal=55 (lower) and high=1.2750 (higher) → bear=true: a new price high but with markedly weaker backing volume - classic exhaustion.
🖊️ Flow 6: Drawing the Heatmap Track & Scale Anchor (every bar)
- plot(sizeOffset, color=na): a fixed, invisible plot at value 400, forcing the shared price scale (since overlay=true + scale=scale.none) to include the 400 mark - keeping the heatmap track (0-100) rendered at a reasonable-looking size instead of being squashed relative to real price.
- plotcandle(0, vol, 0, vol, ...): draws one fake "candle" per bar, open=0/low=0, high=close=vol - effectively a column from 0 to vol, colored by volColor - this is what produces the visible heatmap effect on the chart.
🖊️ Flow 7: Drawing Divergence Markers (every bar)
- The two calls plot(PH ? volVal : na, offset=-divLookRight, ...) - the SAME value expression, differing only in title and which color condition (isBullDiv/isBearDiv) applies - each draws a SINGLE POINT at the exact pivot bar (via the backward offset), NOT a line connecting two consecutive pivots like some other divergence indicators - color only appears when that direction confirms, transparent otherwise.
- If isBullDiv/isBearDiv is true: creates a text label at (bar_index[divLookRight], volVal) on the heatmap track, with the actual volume + % (per the toggle inputs).
- Separately (independently), draws a plotshape with force_overlay=true + location.absolute at the ACTUAL real price low/high (not on the heatmap track) - this is the "Bull"/"Bear" label shown on the actual price candlestick chart.
Outputs & Usage Roles
- Volume heatmap track: an instant visual read of market participation level at each bar, without reading numbers.
- Marker on the track: the exact position of the volume peak that triggered the divergence, with detailed figures in the label.
- Label on the real price chart: the actual entry/reference position on price action, used directly for trading decisions.