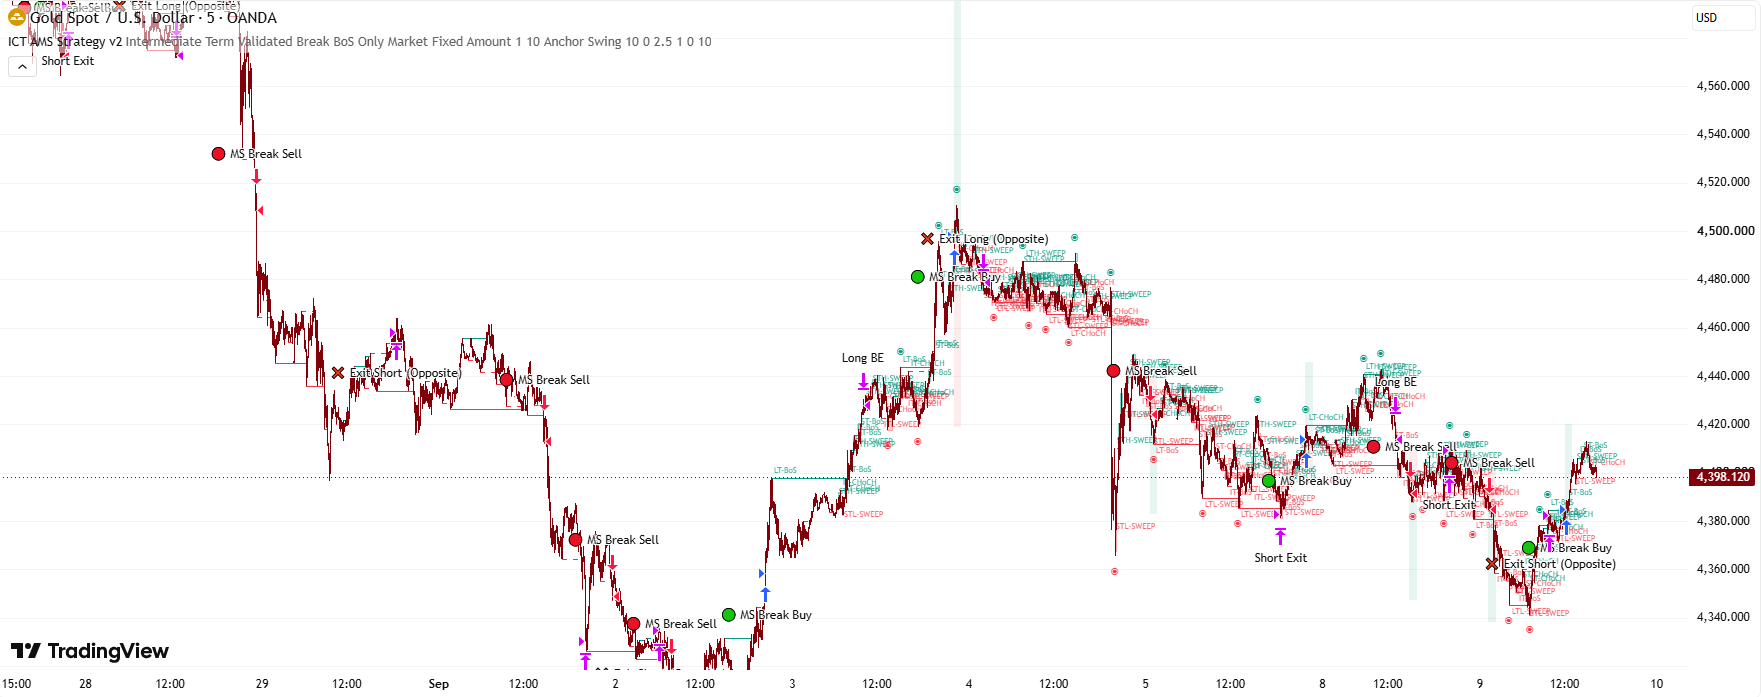
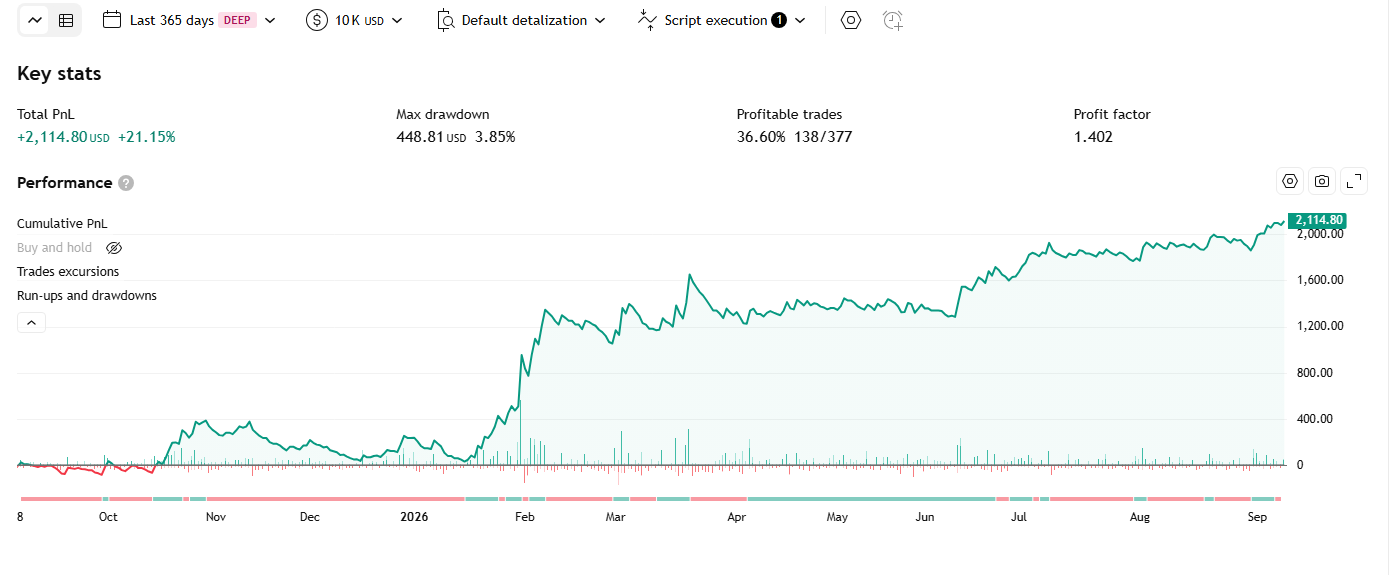
1. ICT Anchored Market Structures with Validation Strategy Description
An ICT (Inner Circle Trader) indicator that tracks market structure across 3 nested tiers (Short/Intermediate/Long Term), identifies BoS/CHoCH at each tier, and automatically detects false breakouts (liquidity sweeps) before accepting a genuine structure break.
1.1 Indicator concept
The ICT (Inner Circle Trader) Market Structure theory: price structure forms a fractal hierarchy made of several nested "tiers" of swing highs/lows — the Short Term (ST) tier is the rawest swing points, formed directly from 3 consecutive bars; the Intermediate Term (IT) tier keeps only those ST swing points that THEMSELVES also form a valid pivot pattern when compared against their neighboring ST swings (i.e., a "swing of swings"); the Long Term (LT) tier filters one level further up from the IT swings themselves. The higher the tier, the fewer swing points remain, but the more structurally significant each one is.
At EACH tier, the indicator independently tracks 2 things: (1) "Market Structure" — when price breaks through the swing high/low currently tracked at that tier, this is a structural-shift event, called a BoS (Break of Structure — continuing in the same direction as the prior structure) or a CHoCH (Change of Character — reversing the prior structure), depending on whether the new break's direction MATCHES or OPPOSES the most recently confirmed structure direction at that tier; (2) "Validation/Sweep" — after price just breaks a level, the indicator keeps watching within an ATR-based margin band whether price genuinely "commits" to continuing in the breakout direction, or was just a "liquidity sweep" (fakeout) that reverses right back inside that band.
1.2 Indicator features
- 3 INDEPENDENT parallel structure tiers: Short Term / Intermediate Term / Long Term — each tier has its own inputs, colors, and line style (default ST=dotted, IT=dashed, LT=solid, to visually distinguish which tier is being shown).
- Swing labels: at each tier, displays a symbol/text marking each swing point just confirmed at that tier — can be shown using each tier's own icon set (e.g. ⦁ for ST, ◈/△▽ for IT, ◉/▲▼ for LT) or as abbreviated text like "ST-HH"/"IT-LL"/"LT-HL" clearly describing a higher/lower high or higher/lower low compared to the previous point at the SAME tier.
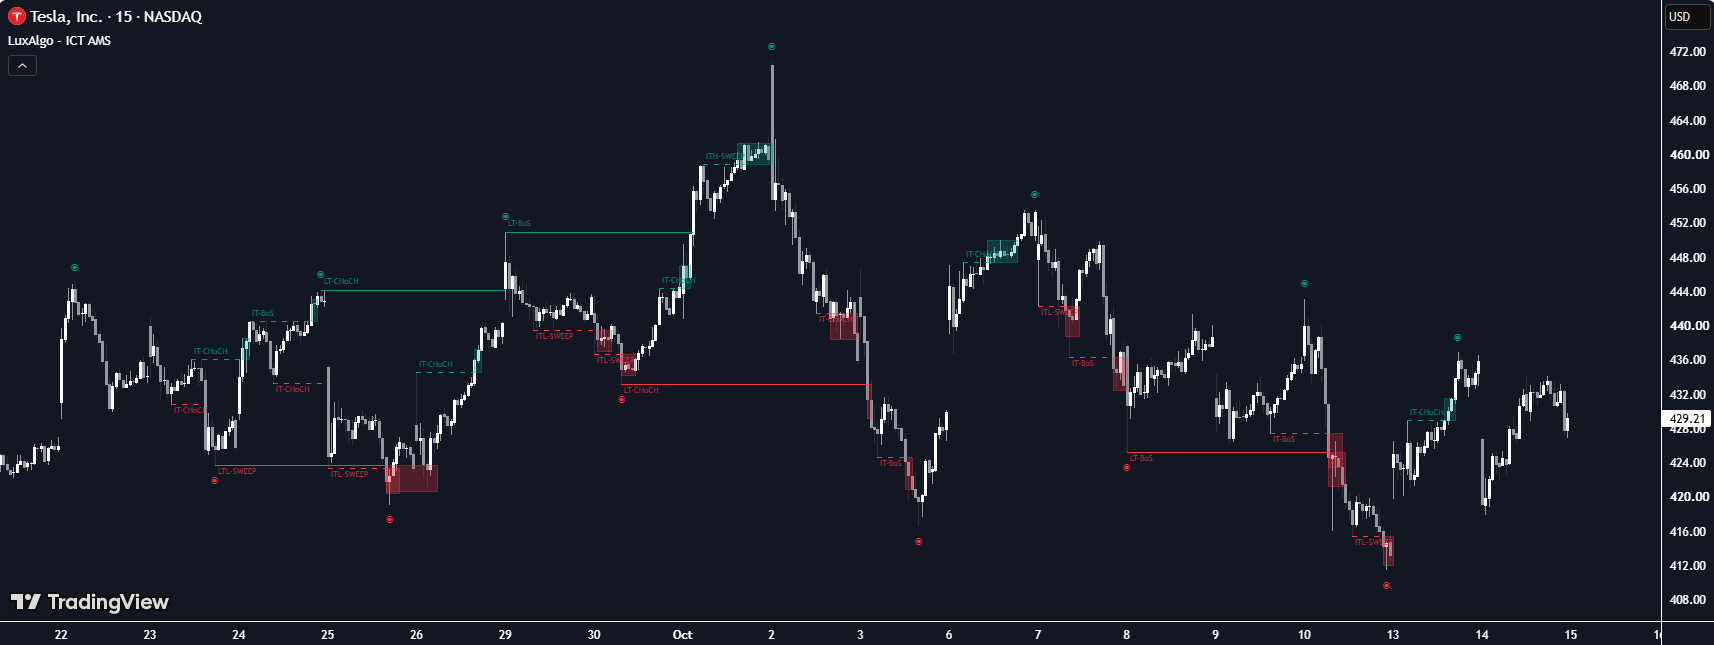
- Market Structure line + label (BoS/CHoCH): when price breaks through the swing high/low currently tracked at a tier, draws a horizontal line connecting the origin point to the break point, with a text label "[Tier]-BoS" (continuation) or "[Tier]-CHoCH" (reversal).
- Market Structure Validation box (Sweep): a faded, progressively expanding box tracking price action right after a break — if price reverses and closes back through the opposite side of the origin level (within the ATR margin), the label automatically changes to "[Tier]-SWEEP" to flag this as a false break/liquidity grab rather than a genuine BoS/CHoCH.
- Cross-tier label-sharing technique: a price point that is simultaneously an ST swing, then gets "promoted" to IT and then LT, REUSES the exact same single label (its text/color/size updated progressively at each tier) instead of stacking 3 separate overlapping labels at the same spot.
- Alert: the indicator has NO alert feature — it's purely visual.
1.3 How to use it in trading
- Use the LT tier's structure (Long Term, on by default, solid line) as the overall big-picture trend frame; use the IT tier as the mid-term frame; use the ST tier (swings OFF by default, only Market Structure shown) as the fastest-reacting signal — combine all 3 tiers to cross-check multiple "weight classes" of view on the SAME chart, without switching timeframes.
- When a tier just confirms a BoS → that tier's trend is still continuing, worth considering holding/ adding to a position in the same direction; when it confirms a CHoCH → that tier just reversed, requiring a full re-evaluation of the setup in the new direction.
- Wait for the Validation box's label to change to "SWEEP" to recognize a breakout that just occurred was FAKE (a liquidity grab that reversed) — avoid entering in that breakout direction; if the box doesn't turn into SWEEP and price keeps moving further from the origin level, the breakout is treated as genuine (a real BoS/CHoCH).
- Turn off "Market Structure Validation" at any tier if you only want to see the plain BoS/CHoCH lines, without tracking the possibility of a sweep-back.
- Switch the Swings style from icons to text form "ST(H/L)"/"IT(H/L)"/"LT(H/L)" if you'd rather read Higher High/Lower Low... directly instead of memorizing each symbol's meaning.
- Since each tier has its own Bullish/Bearish color pair (even though the defaults match), you can set different colors per tier for faster visual distinction when all 3 tiers are displayed stacked on top of each other.
1.4 How the indicator works
Inputs & their role (the structure repeats identically for all 3 ST/IT/LT groups, differing only in default values)
- Swings (dropdown, each tier's own icon set or text H/L form or Disabled — ST defaults to Disabled, IT/LT default to on): selects the display style for labels at that tier's confirmed swing points. Choosing Disabled turns off the swing labels entirely (it does NOT turn off the Market Structure line).
- Size (Tiny/Small/Normal/Large — ST defaults Tiny, IT/LT default Small): the swing label's text size.
- Market Structures (checkbox, default true for all 3 tiers): the MASTER toggle for drawing the line + processing BoS/CHoCH at that tier — turning it off completely stops structure-break detection at this tier (not just hiding the display).
- Market Structure Validation (Enabled/Disabled, default Enabled): the MASTER toggle for the post-breakout sweep-tracking feature — turning it off removes both the Validation box and the ability to relabel as SWEEP.
- Market Structure Labels (Enabled/Disabled, default Enabled): specifically for the TEXT on the BoS/CHoCH/SWEEP label — turning it off still draws the line but without the explanatory text.
- Line Style (Solid/Dashed/Dotted — default ST=Dotted, IT=Dashed, LT=Solid) + Width (default 1): the style and thickness of that tier's Market Structure line — deliberately set differently by default so the 3 tiers are easy to distinguish when displayed together.
- Bullish/Bearish Color (default ■ #089981 teal / ■ #f23645 red, the same across all 3 tiers): the color used for the swing labels, the Market Structure line + label, and the Validation box at that tier, by direction.
Main logic blocks
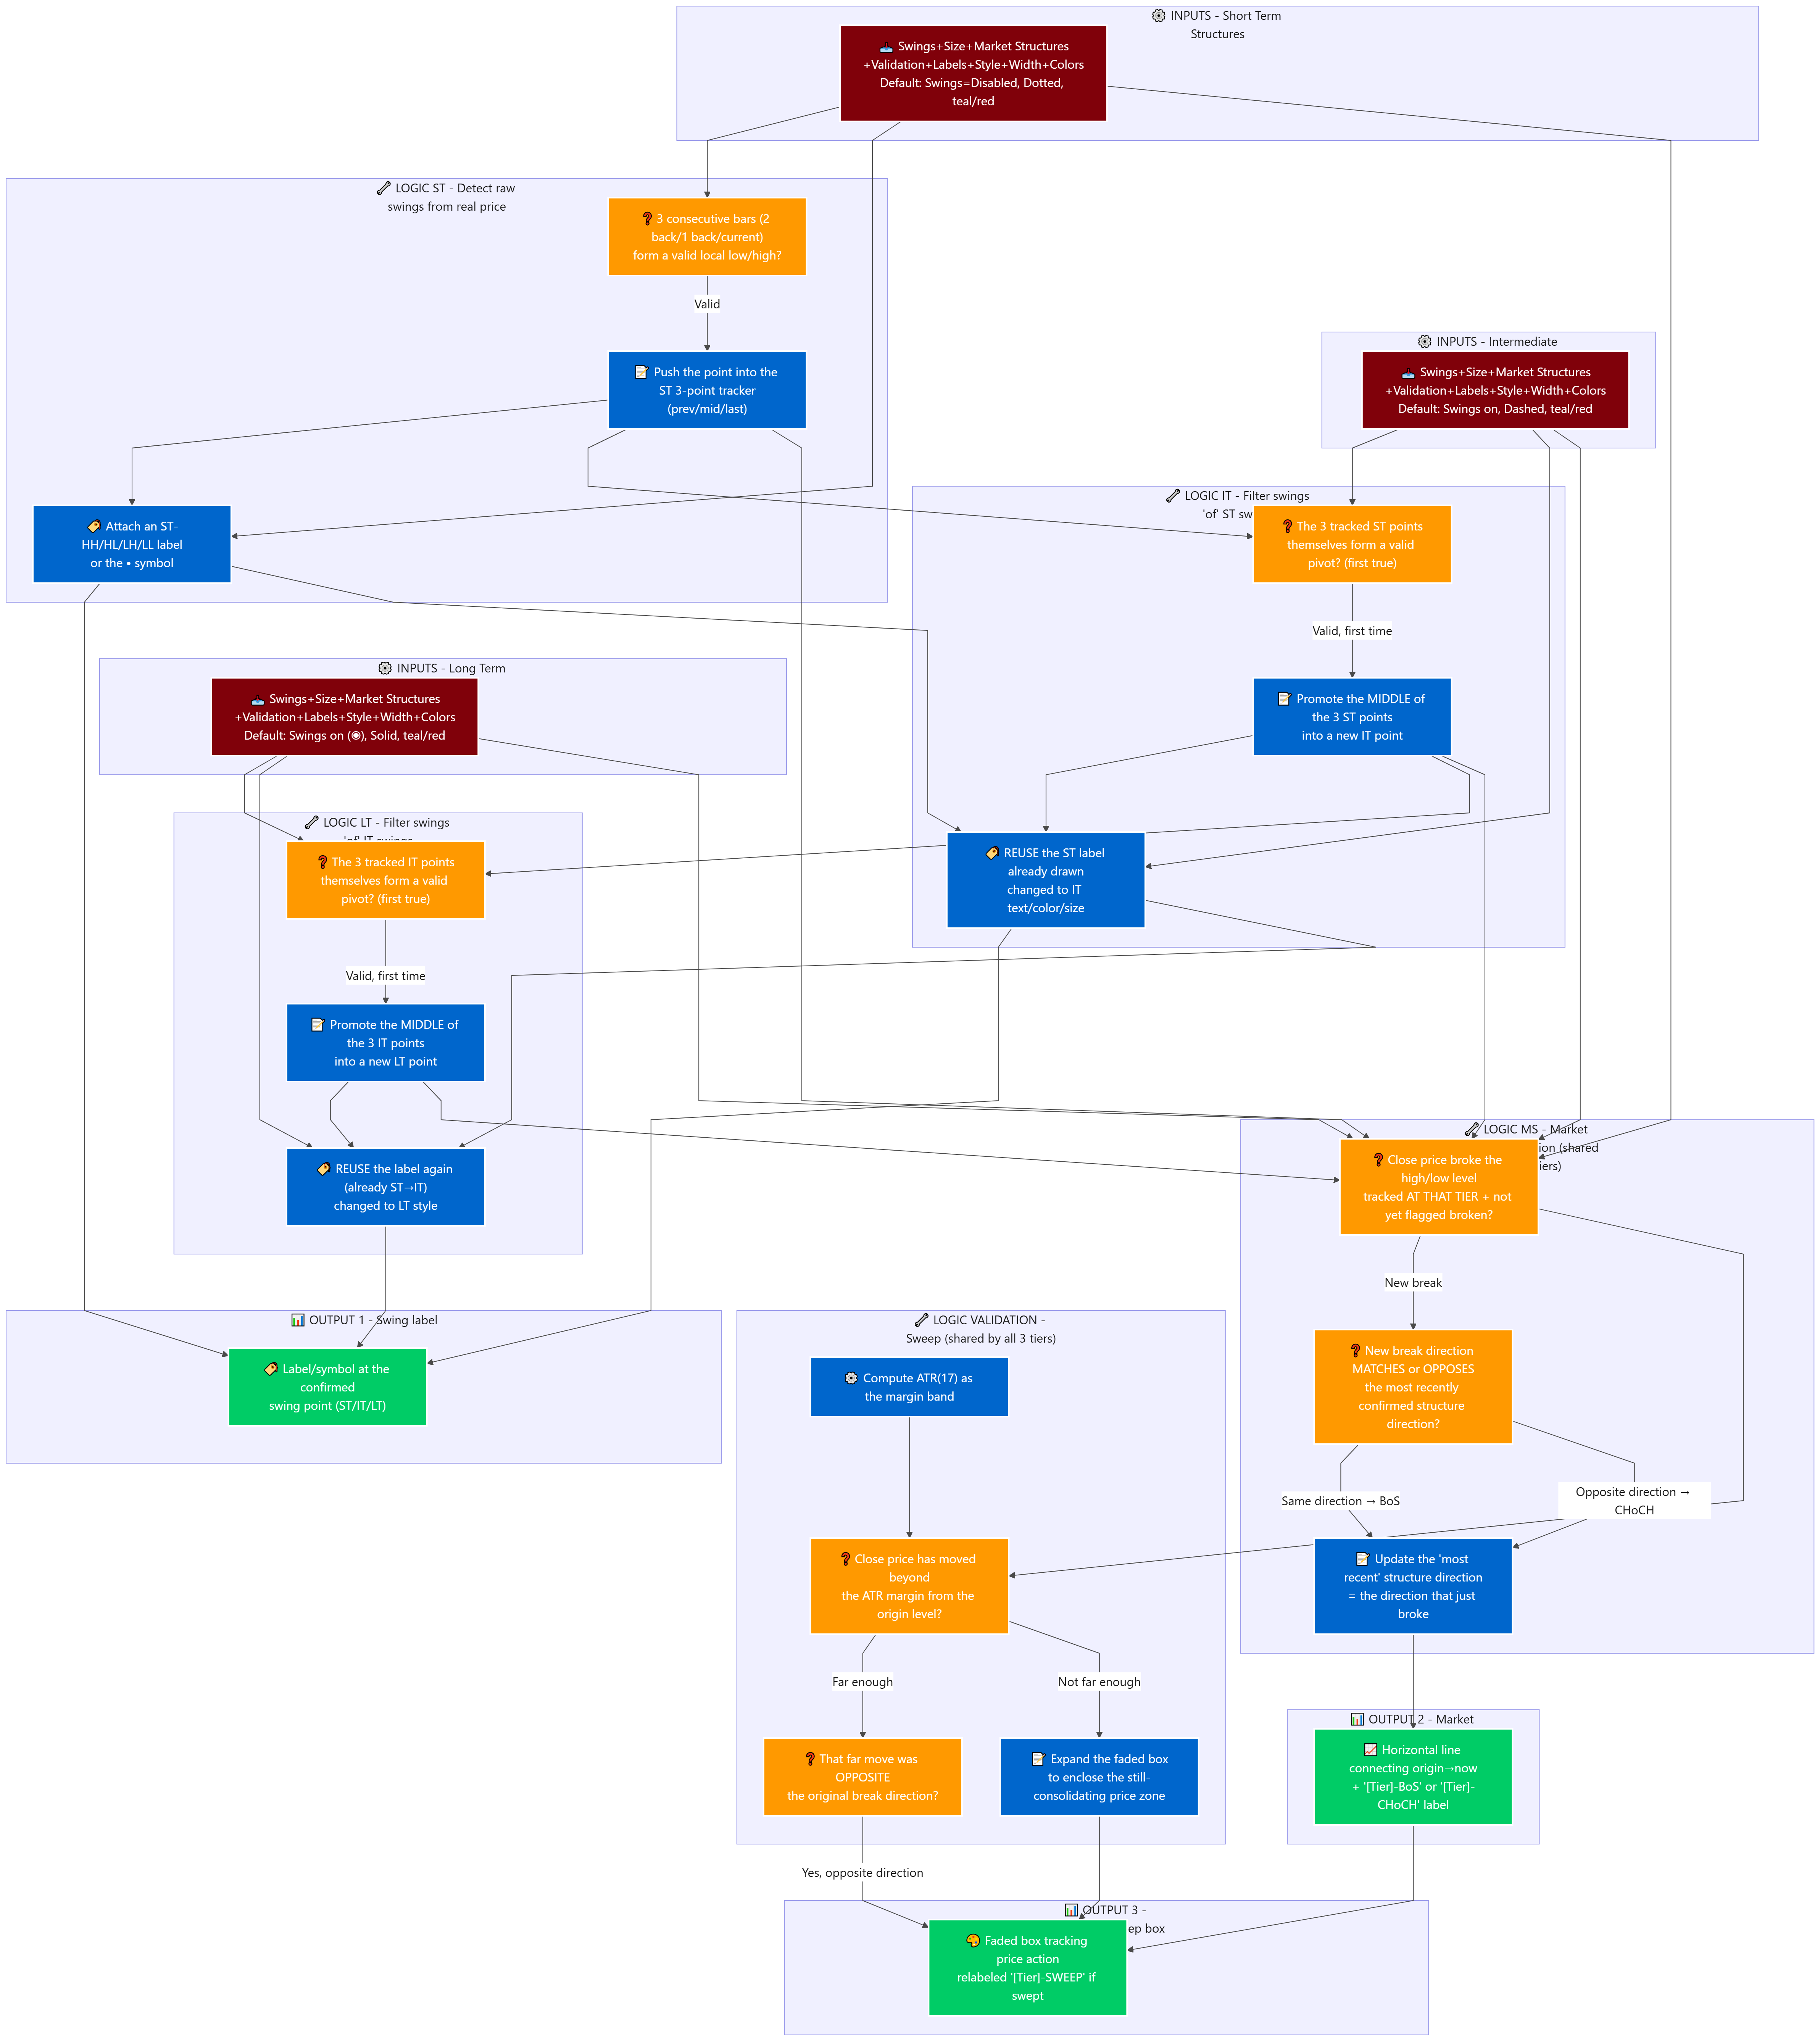
- Working backward from what's displayed: everything shown (swing labels, BoS/CHoCH line+label, Validation/Sweep box) at ALL 3 tiers originates from exactly ONE shared mechanism — an object tracking the 3 most recent price points (prev/mid/last) for each direction (highs separately from lows) at each tier, along with one 3-point-pattern-checking function, one Market-Structure-drawing function, and one Validation function — REUSED identically across all 3 tiers, differing only in their input data source.
- ST tier — detecting raw swings from real price: on every bar, checks whether the low/high of the bar 1 back (no length input at all — always a fixed exactly-3-consecutive-bars comparison: 2 bars back, 1 bar back, current) forms a valid local low/high (relative to its 2 neighbors); if so, that point is pushed into the ST tier's 3-point tracker, and a Higher/Lower classification label is attached based on comparing it against the previous ST point of the SAME direction.
- IT tier — filtering swings "of" ST swings: on every bar, checks whether the 3 ST points currently tracked (prev/mid/last at the ST level) THEMSELVES form a valid pivot pattern — if so AND this is the first bar this condition becomes true (avoiding repeated processing), the MIDDLE of those 3 ST points is "promoted" into a new IT point: pushed into the IT tier's own 3-point tracker, and IMPORTANTLY — the exact label already drawn at the ST tier for that point is REUSED (its text/color/size changed to the IT style) instead of creating a new overlapping label.
- LT tier — filtering swings "of" IT swings: works exactly like the IT tier but filters one more layer from the 3 IT points currently tracked; the MIDDLE of the IT points is promoted into an LT point, again reusing + restyling the existing label (this label has now gone through 2 promotions: originally ST → became IT → now becomes LT).
- Market Structure detection layer (BoS/CHoCH, shared formula for all 3 tiers, run on that tier's own tracked level): on every bar, checks whether the close price has just broken through the high/low level currently tracked AT THAT TIER (and hasn't already been flagged "broken" for this particular break) — if so, draws a horizontal line connecting the origin point to now, while comparing the new break's direction against the MOST RECENTLY confirmed structure direction at that tier: SAME direction → labeled "-BoS"; OPPOSITE direction → labeled "-CHoCH"; then updates the "most recently confirmed" structure direction to the direction that just broke.
- Validation/Sweep layer (shared formula for all 3 tiers): after a level has just been broken (awaiting confirmation), watches whether the close price has moved far enough (beyond an ATR(17)-based margin measured from the origin level) — if far enough: locks in confirmation, AND if that far move turned out to be in the OPPOSITE direction of the original break (price broke up but then closed deep back below the origin level, or vice versa) → relabels as "-SWEEP" to flag a false break; if price is still hovering within the ATR margin, not yet far enough to confirm: keeps expanding the faded box to fully enclose the price action still consolidating right after the breakout.
Outputs & how they're used
- 3 ST/IT/LT structure tiers: lets you cross-check trend across multiple "weight classes" of view on the same chart, without switching timeframes — the higher tiers for strategic direction, the lower tiers for fine-tuning entries.
- BoS/CHoCH labels: identify whether market structure at each tier is CONTINUING or REVERSING — the core foundation of the ICT market-structure trading approach.
- SWEEP box + label: filters out false breakouts (liquidity sweeps) before they get counted as genuine BoS/CHoCH, helping avoid entering on an unsustainable break signal.
- Cross-tier swing labels (one shared label for 3 tiers): instantly shows how many tiers a given price point is structurally significant at (the higher it's been promoted, the more important), without cluttering the chart with overlapping labels.