1. Volume Delta [BigBeluga] Indicator Description
Analyze the strength between buying and selling pressure through traded volume
1.1 Indicator Concept
Volume Delta is an indicator based on the principle of Order Flow Analysis—a method of assessing the market’s true strength through the actions of buyers and sellers.
Core theory: Price can fluctuate for many reasons, but trading volume reveals who is truly in control of the market. When a candle closes above its open (bullish/green), buyers are stronger. Conversely, a red (bearish) candle shows sellers are dominant.
This indicator computes the percentage of buying volume relative to total volume over a defined lookback (20 candles by default). The result is called Delta (%):
Example: If Delta = 65%, that means 65% of volume belongs to buyers and 35% to sellers.
Why it matters: Price can “fake” (fake breakouts, bull traps, etc.), but volume is harder to manipulate. If price rises while Delta is low (more selling than buying), that rise may be weak. Conversely, if price falls but Delta is high (more buying), a bottom may be forming.
1.2 Indicator Features
Visual display:
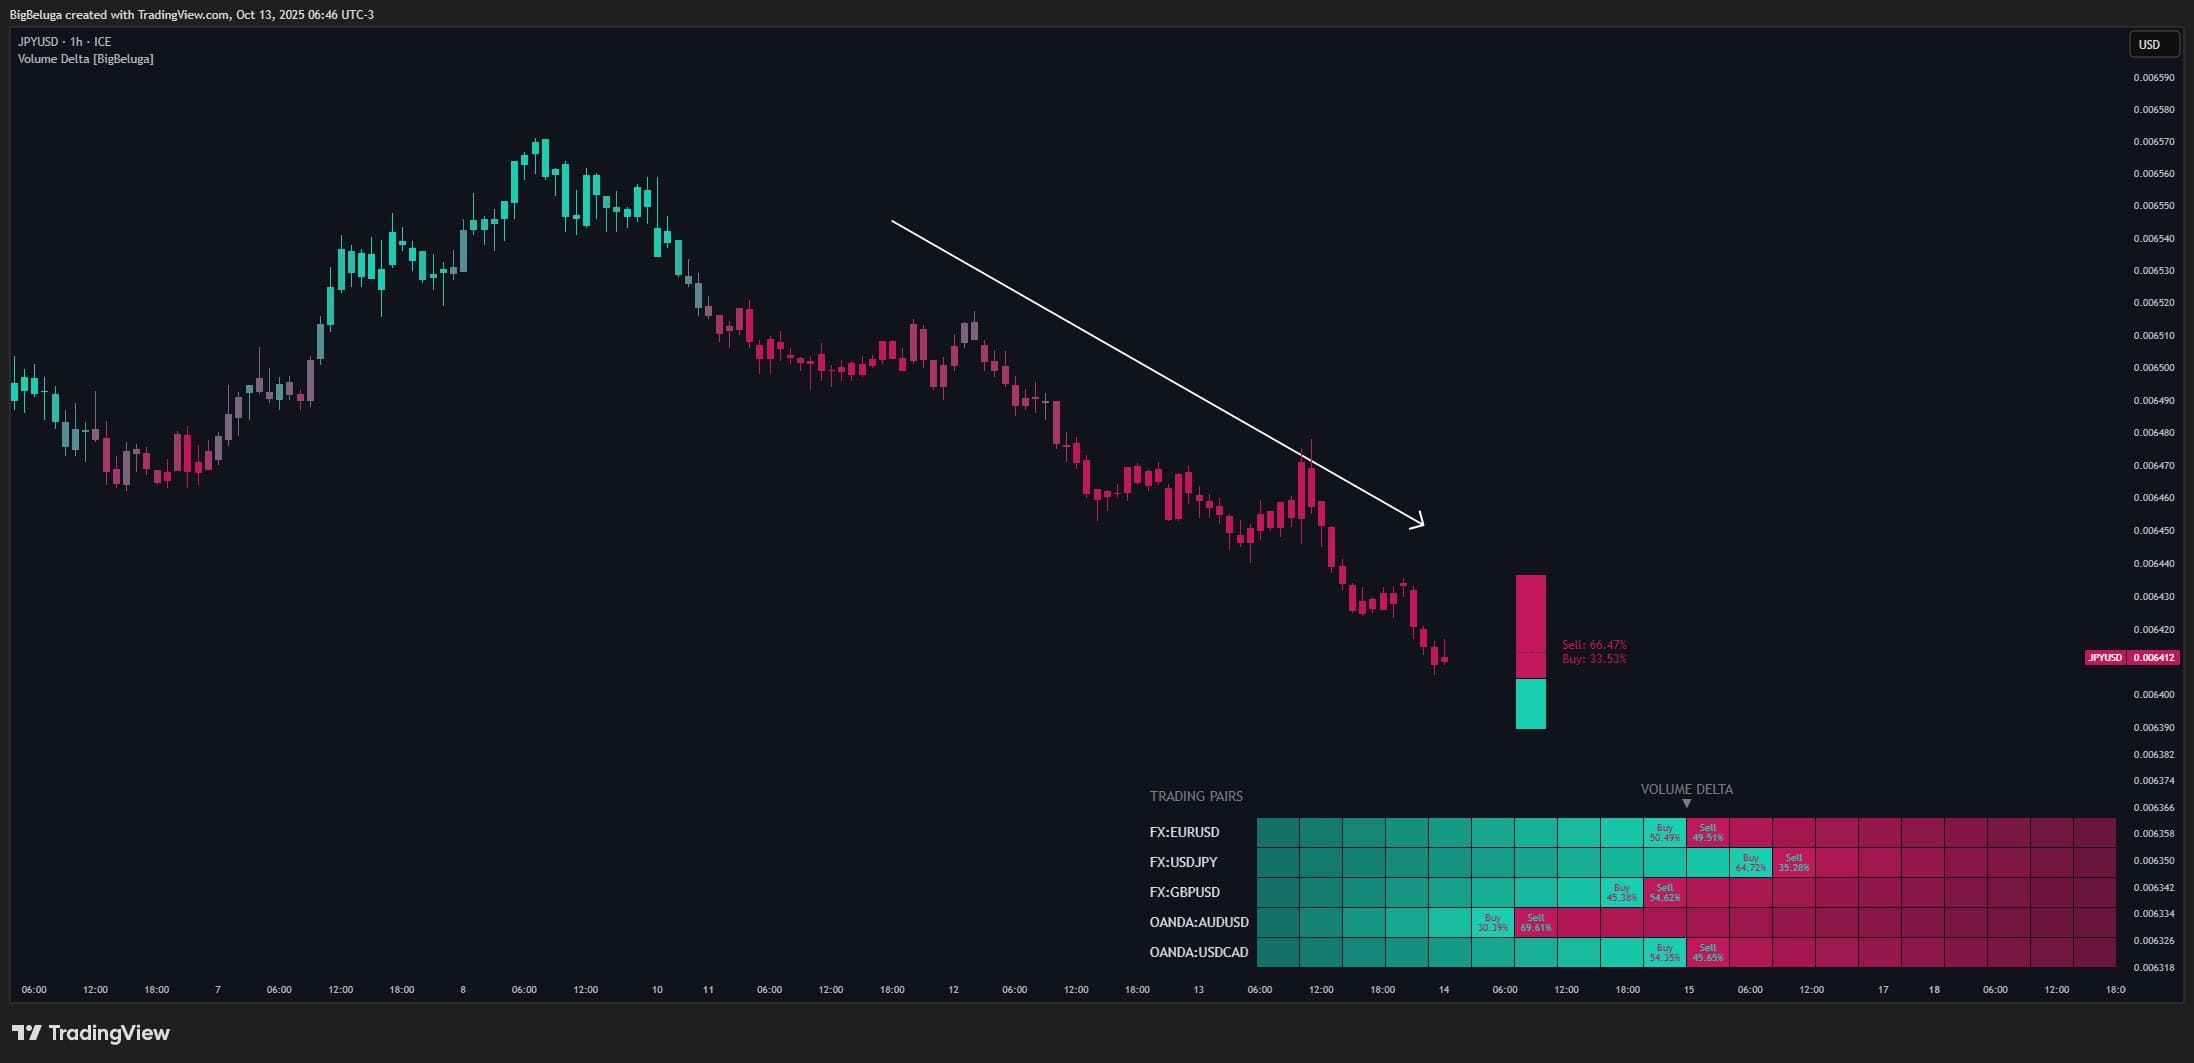
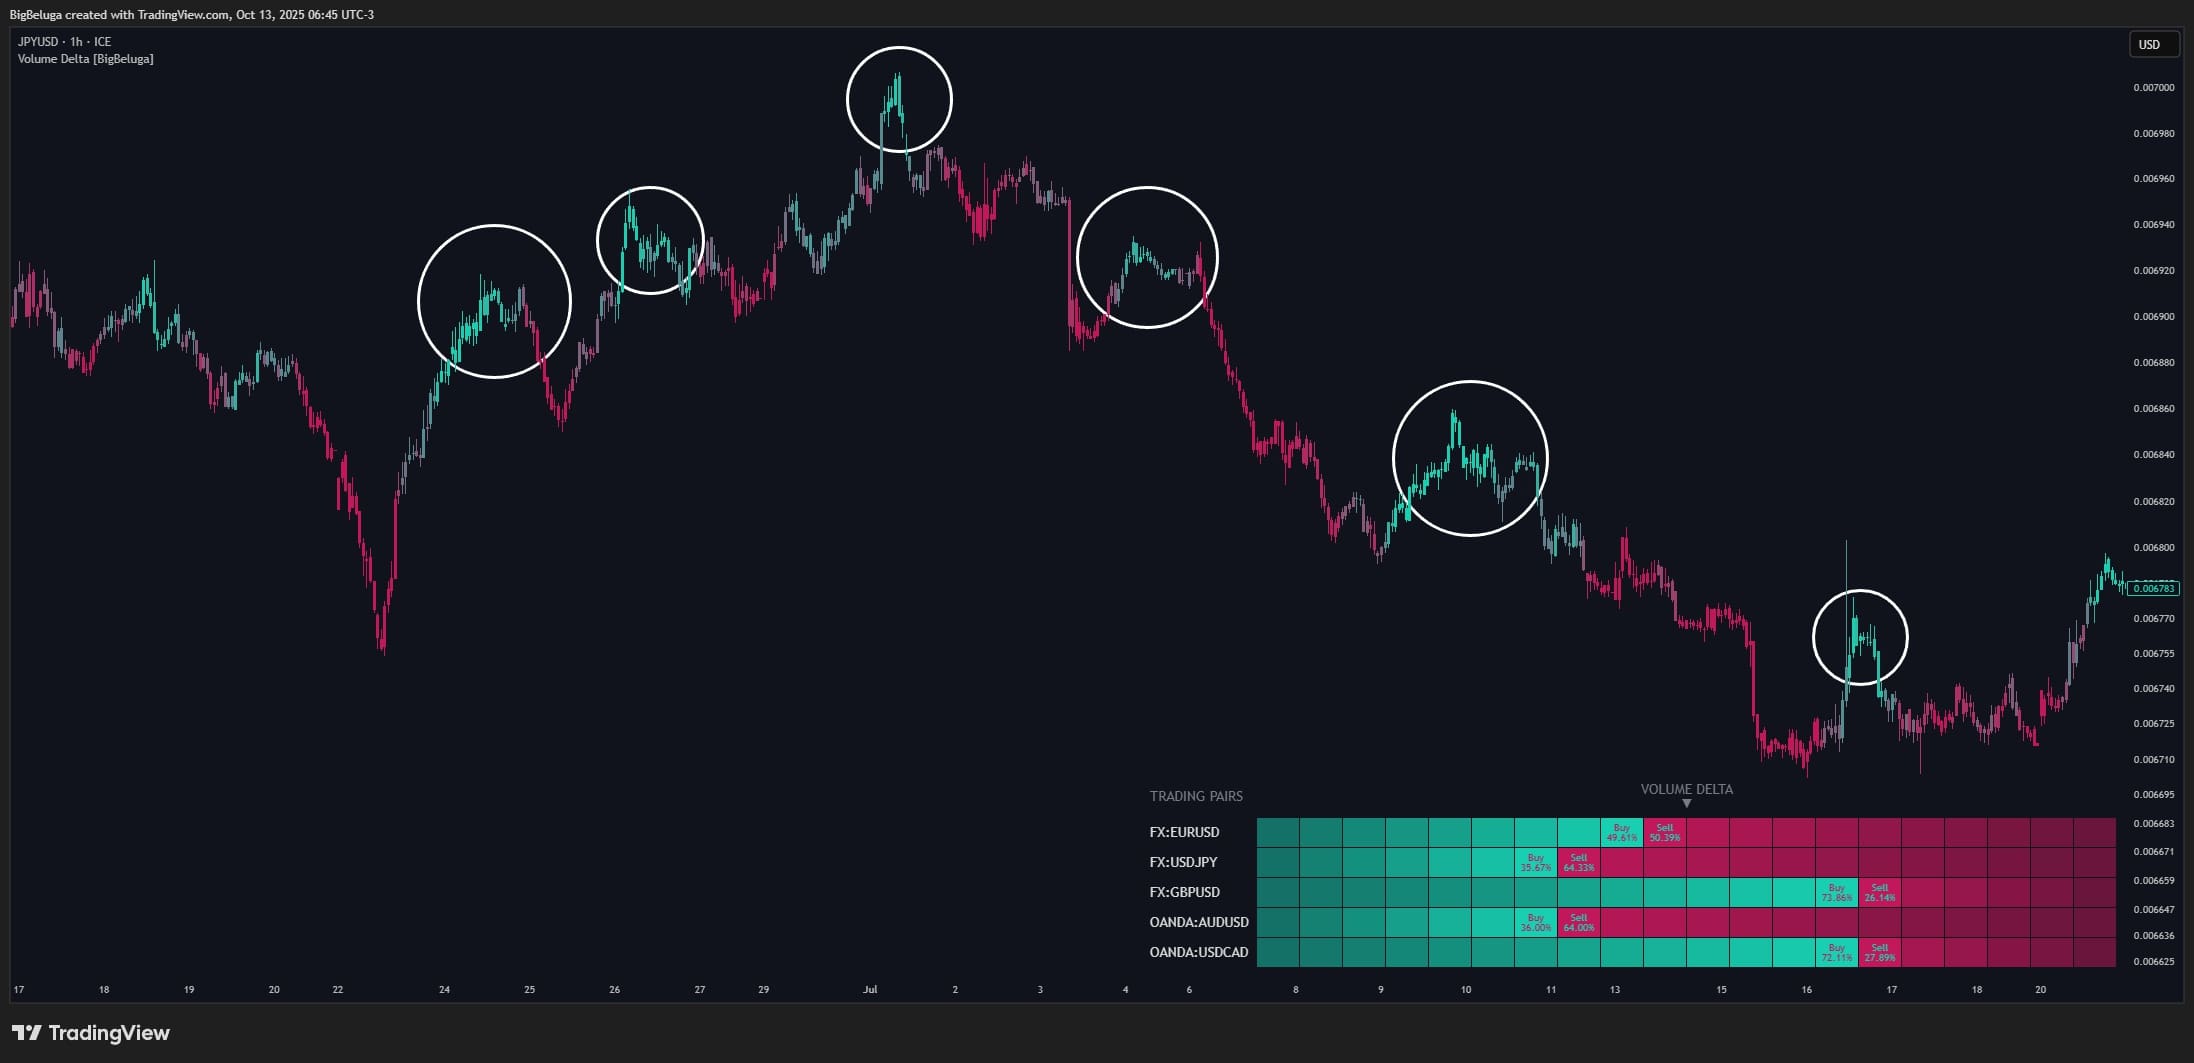
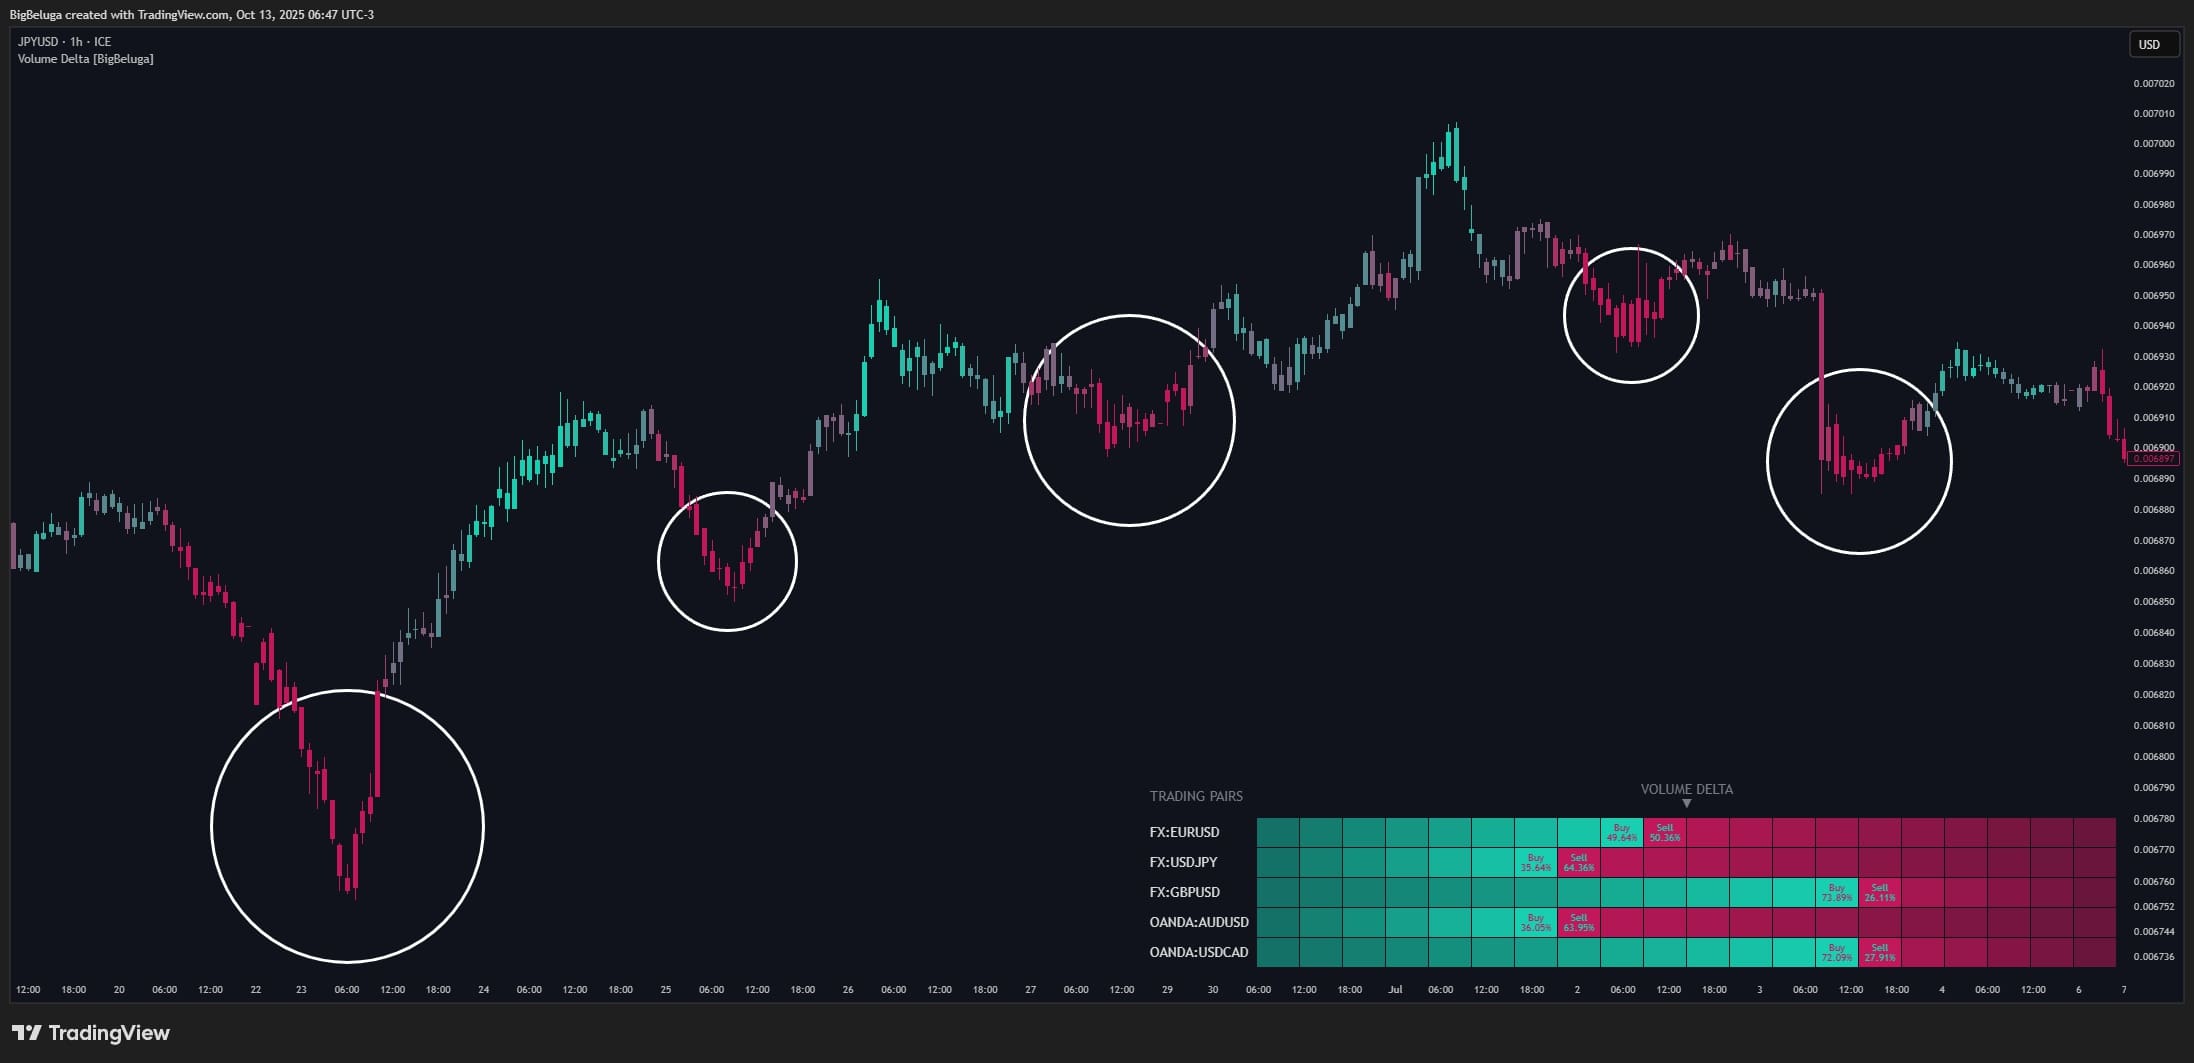
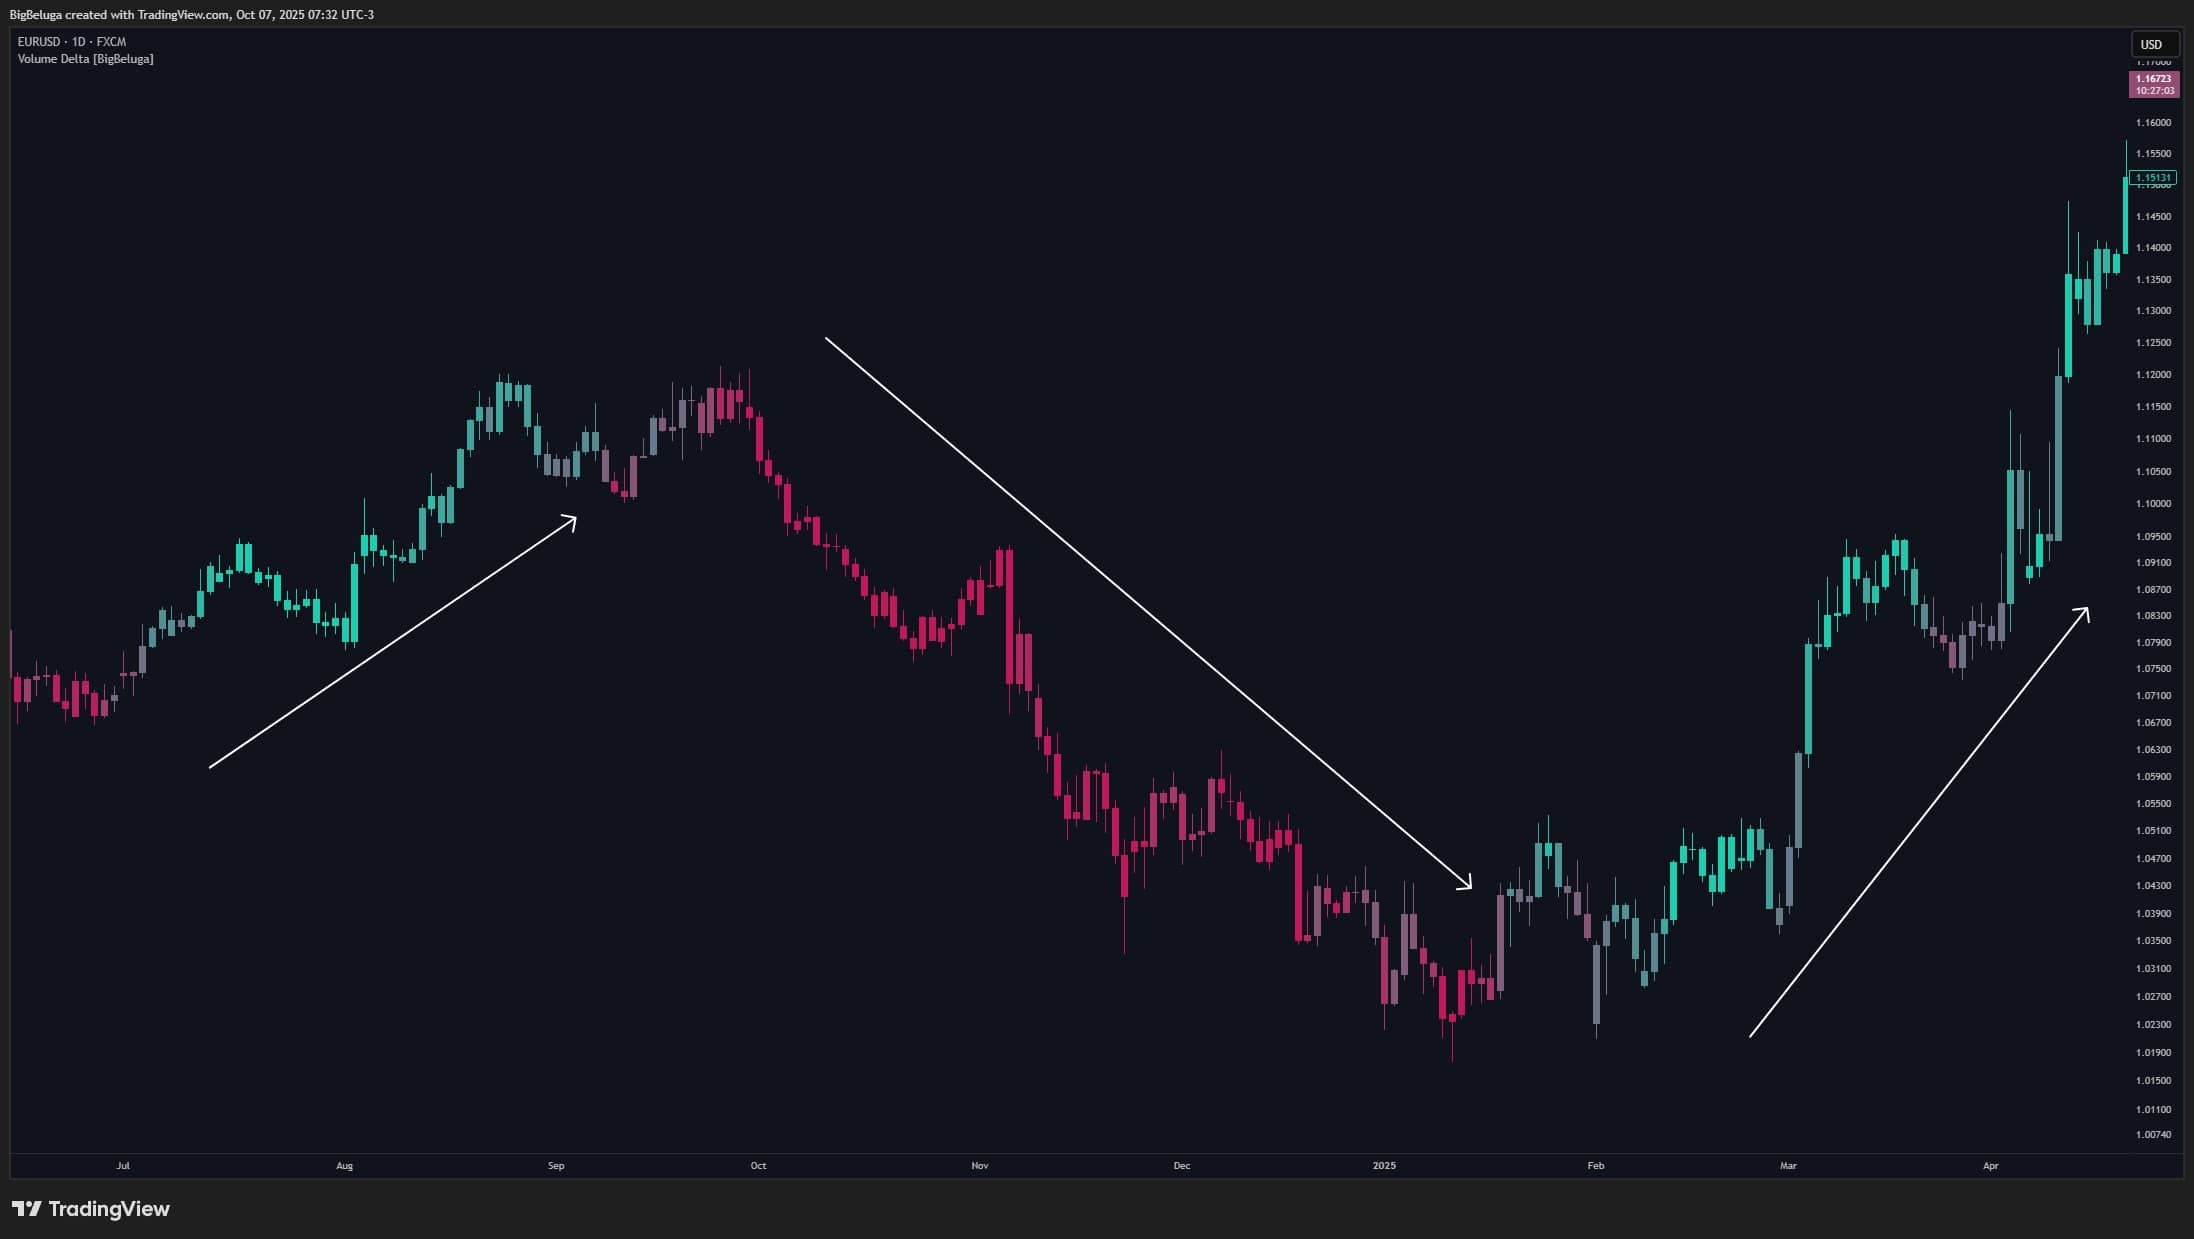
- Candle Coloring: Each candle is colored with a gradient from red (seller-heavy) to green (buyer-heavy). Deeper green = stronger buy pressure; deeper red = stronger sell pressure. This lets you “see” market sentiment at a glance.
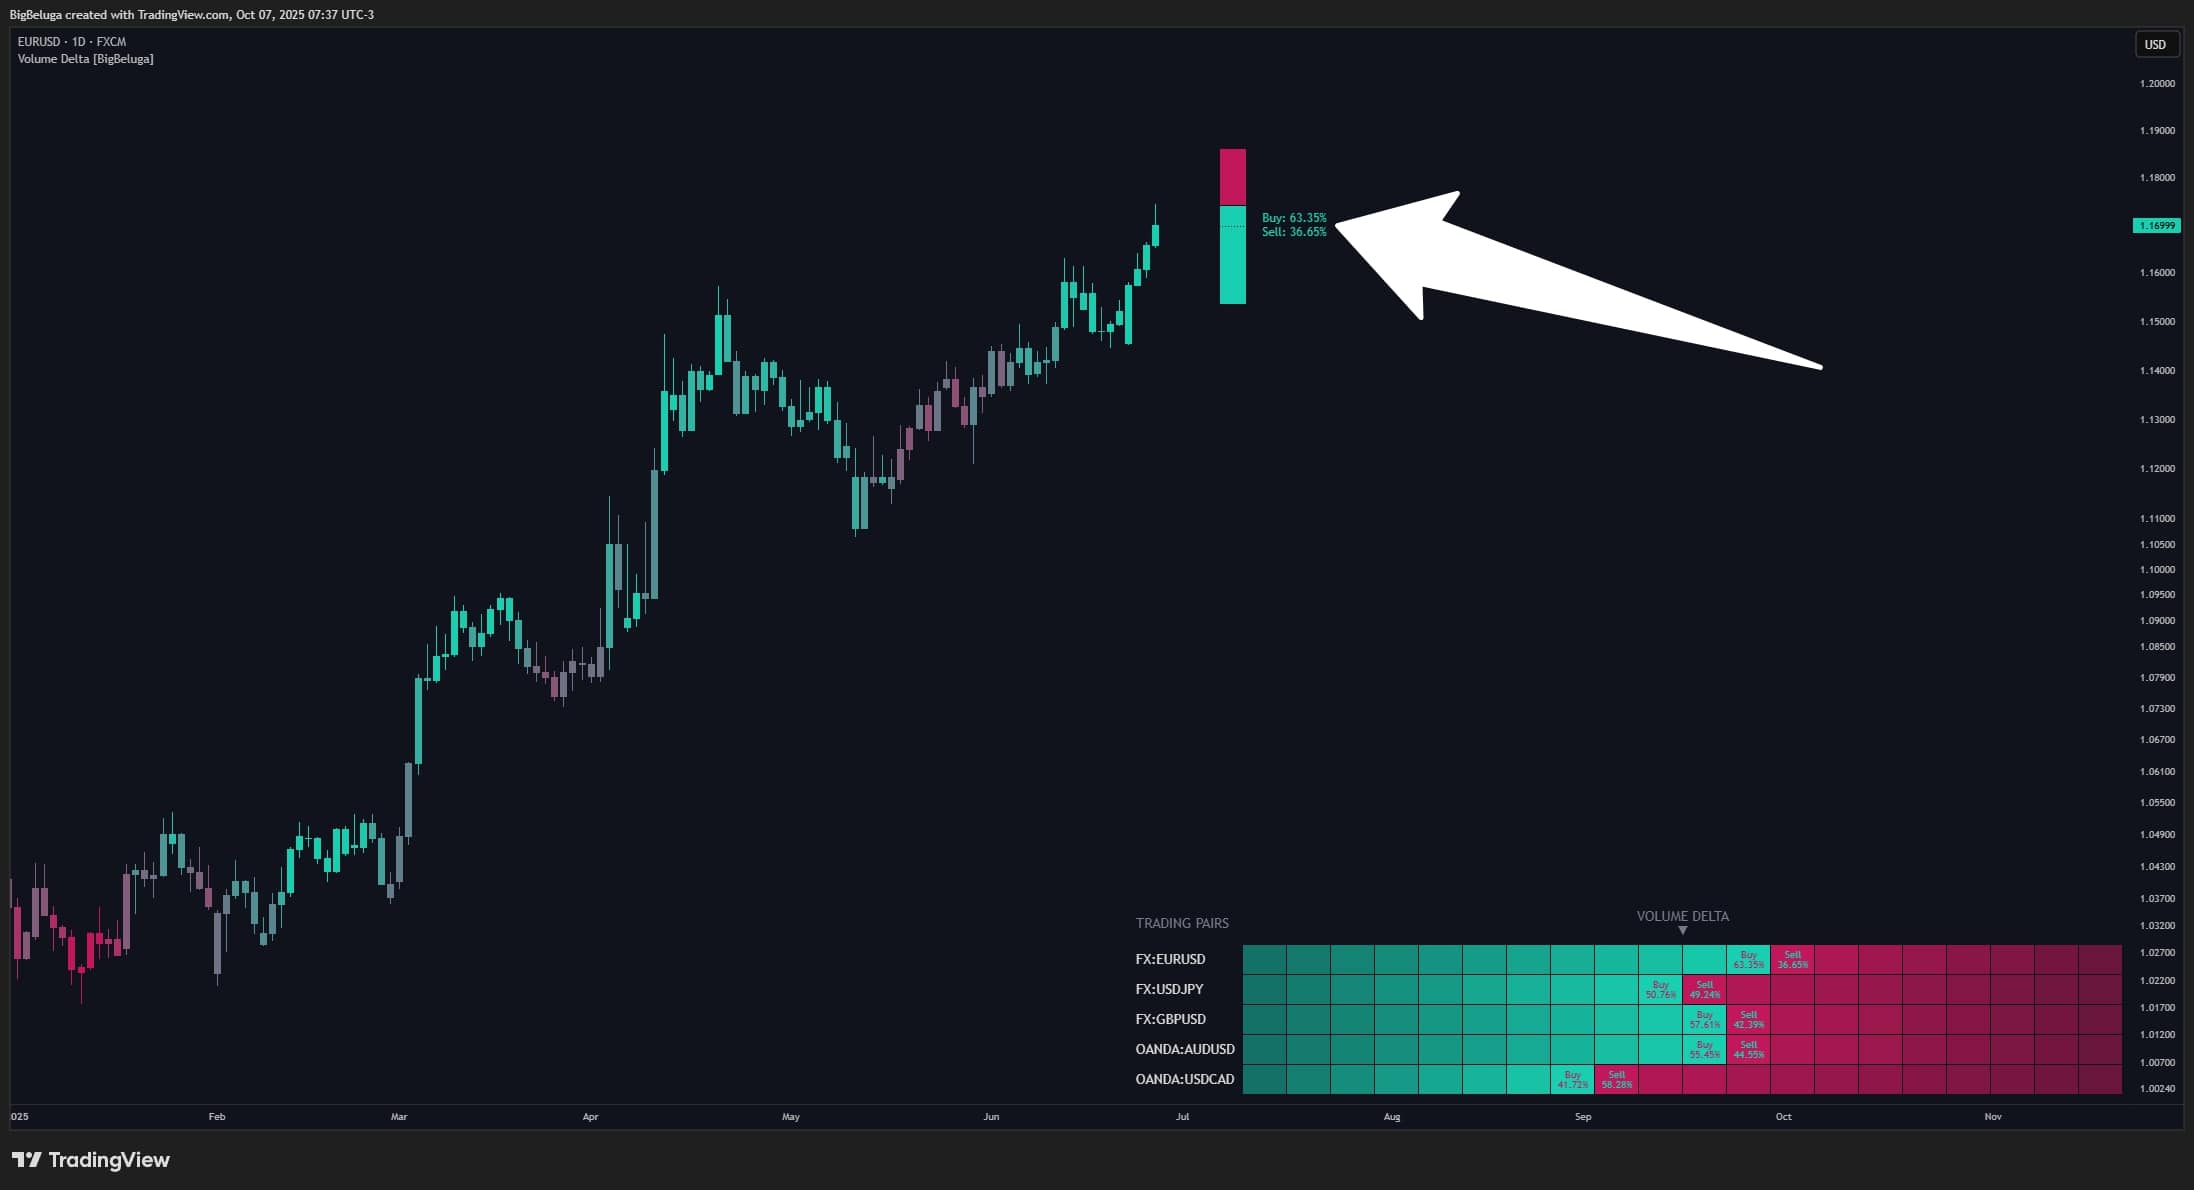
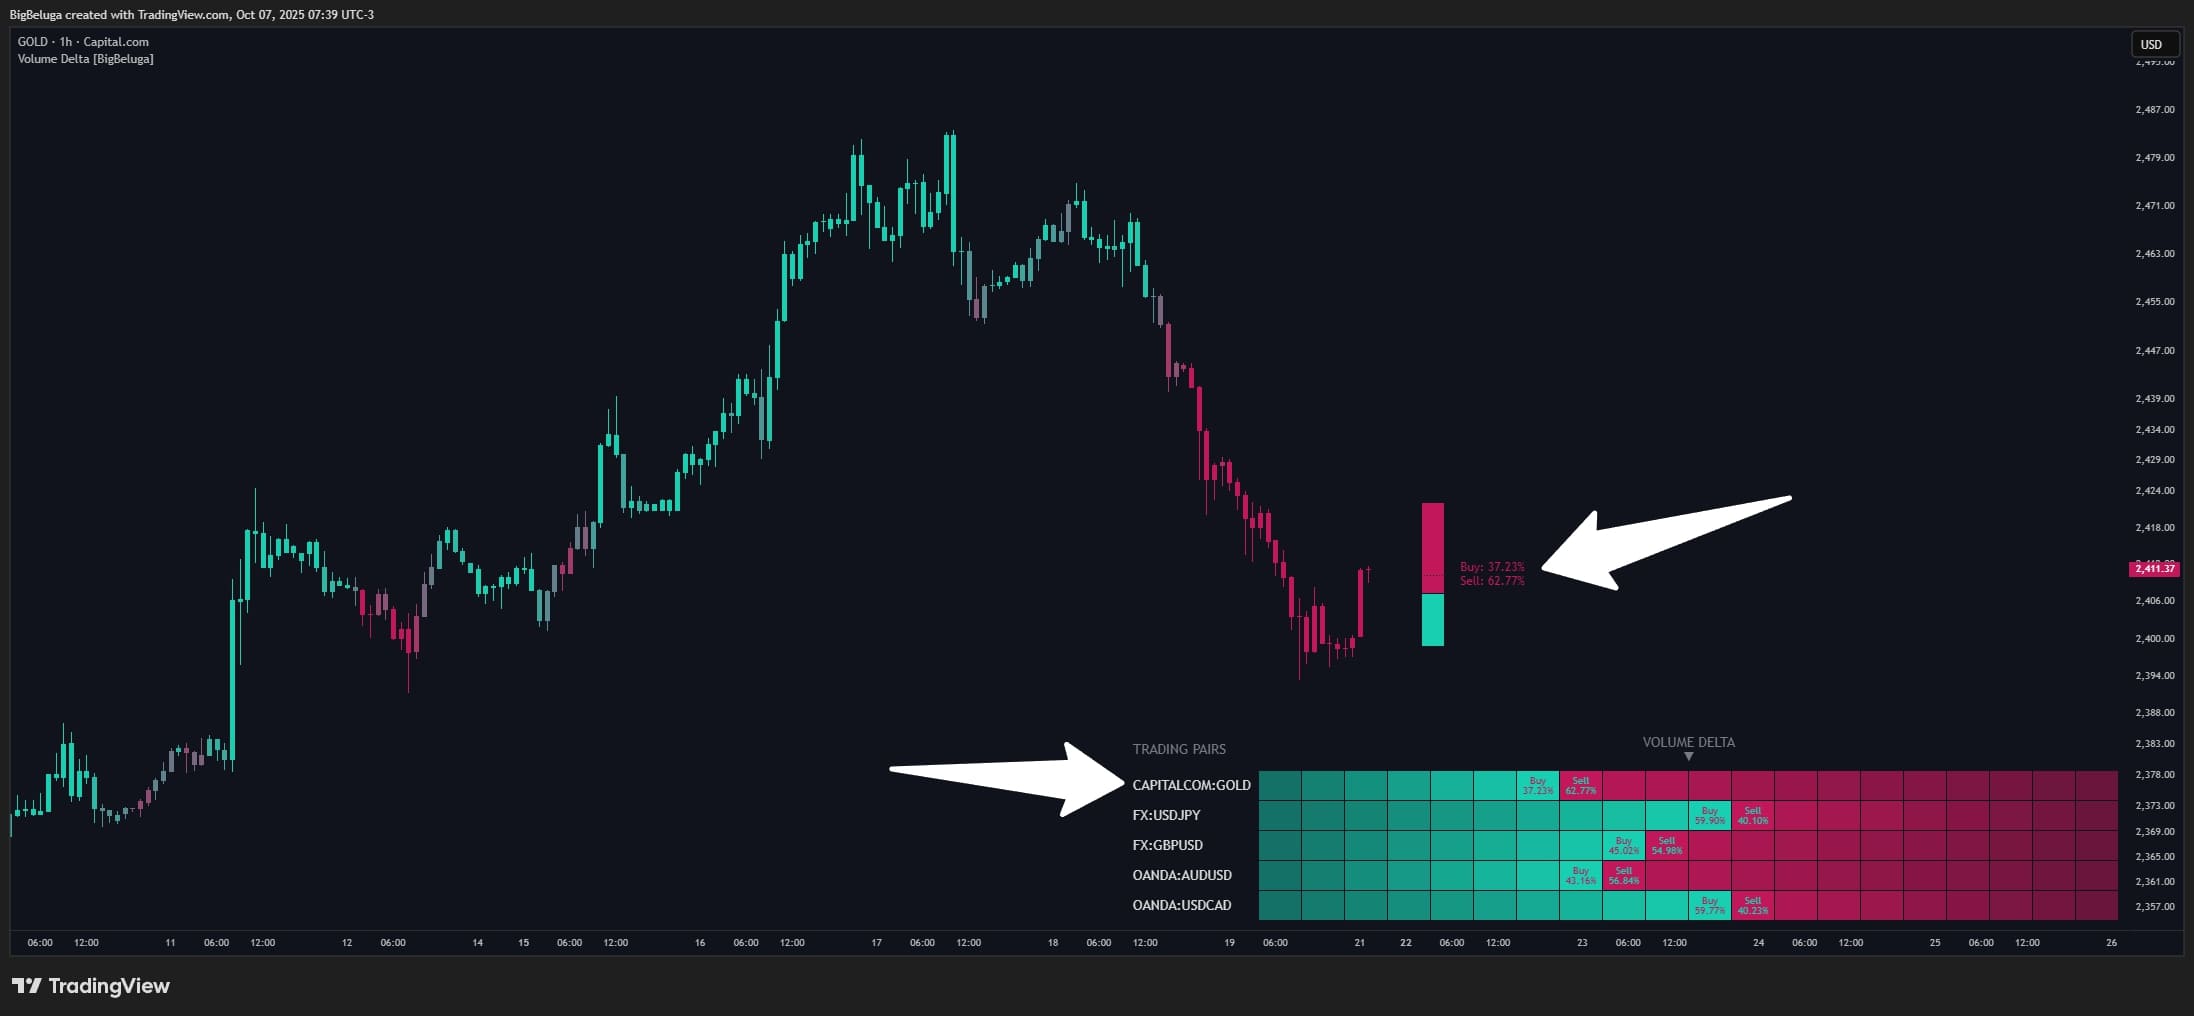
- Delta Bar Panel: A vertical bar next to the latest candle, toggled via deltaBar. The bar has two parts: the lower green portion (Buy %) and the upper red portion (Sell %), separated by a dashed line. Text labels show the exact buy/sell percentages.
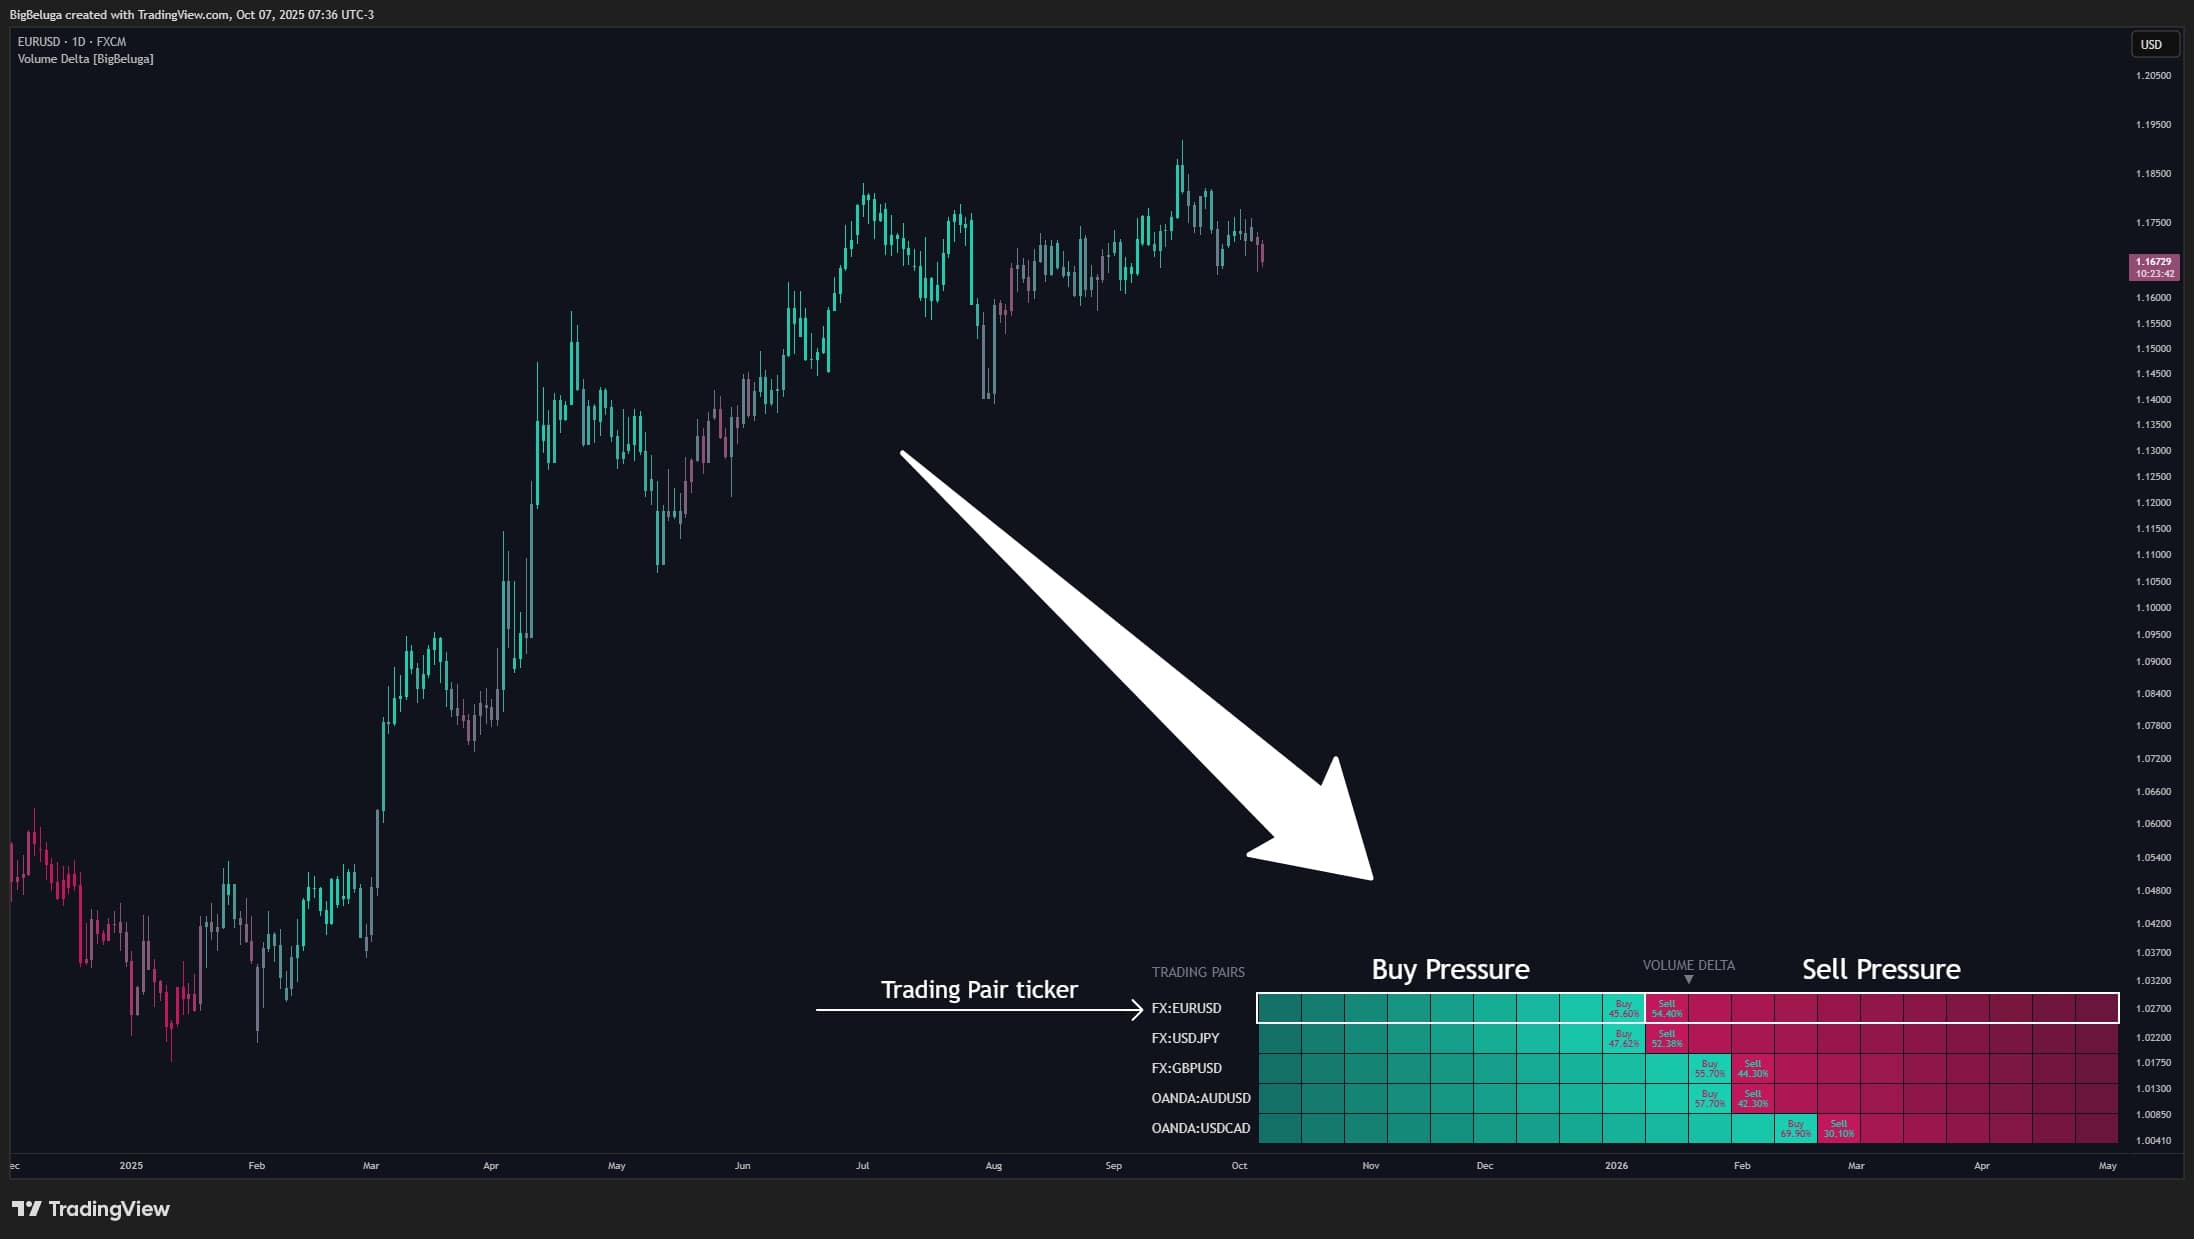
- Multi-Asset Dashboard: A small panel in the bottom-right corner (toggle with displayDash) that lets you track up to 5 different symbols simultaneously. Each row is a symbol, and each column renders a “progress bar” reflecting that symbol’s Delta. Green = buy pressure, red = sell pressure. For example, monitor EURUSD, USDJPY, GBPUSD, AUDUSD, USDCAD to see which pair has the strongest buying among them.
Alerts:
- The indicator doesn’t auto-send alerts, but you can create your own based on Delta conditions. Examples: alert when Delta exceeds 70% (very strong buying) or falls below 30% (dominant selling), or when candle color flips from red to green.
1.3 How to Use
Identify trend and entries:
- Strong buying (Buy % > 60%): When Delta > 60%—especially > 70%—the market is likely accumulating or trending up strongly. Consider looking for BUY entries. However, if Delta is extremely high (> 80–90%), the market may be overheated and due for a pullback (over-bought sentiment).
- Strong selling (Sell % > 60%, i.e., Buy % < 40%): When Delta < 40%—especially < 30%—selling pressure is heavy. Consider SELL entries or wait for reversal signals. If Delta is extremely low (< 10–20%), it can be a capitulation zone—rather than selling, you might prepare to buy.
- Balanced Delta (40–60%): When buy/sell are similar, the market is indecisive with no clear trend. Avoid trading or wait for Delta to exit this range.
Setting Stop Loss (SL) and Take Profit (TP):
- Delta-based trailing SL: If you hold a long and Delta starts dropping sharply (from > 60% to < 50%), that’s a sign of weakening buy pressure—consider tightening SL to protect profits.
- TP on Delta reversal: When Delta peaks (e.g., 75–80%) and then starts to decline, it can be a take-profit signal for longs. Similarly, when Delta bottoms (20–25%) and turns up, consider taking profit on shorts.
Multi-market comparison:
- Use the Dashboard to compare 5 symbols at once. For example, if 4/5 USD pairs show low Delta (heavy USD selling) but one pair shows high Delta, you might prioritize that contrarian pair.
- Or find the most extreme Delta in the group to capture strong momentum.
Combine with other indicators:
- Volume Delta works best with trend indicators (EMA, Bollinger Bands, etc.) or volatility indicators (ATR, Volatility). Example: only go long when Delta > 65% AND price just broke above the 50 EMA.
1.4 How the Indicator Works
📥 Inputs and their role in the concept:
- period (Calculation window): Default 20, meaning the indicator looks back 20 recent candles to compute Delta. You can adjust: smaller periods (e.g., 10) = faster, more sensitive to short-term moves; larger periods (e.g., 50) = smoother, better for longer-term trends.
- symbols (Symbol list): An array of 5 symbols (defaults to major USD pairs like EURUSD, USDJPY, etc.) used to render the multi-market Dashboard. Role: compare flows across related markets.
- colUp and colDn colors: Green (#18d0b1) for buying pressure, red (#c2185b) for selling pressure. Used for candle gradients and the Delta bar.
- Display options: deltaBar (toggle Delta bar), displayDash (toggle Dashboard), offset (distance between the Delta bar and the last candle).
⚙️ Main logic blocks:
- volumeDelta(period) — compute Delta: The heart of the indicator. This function loops for the last period candles. For each candle:
- If close > open → bullish candle → add volume to volumeBuy
- Else (bearish or unchanged) → add volume to volumeSell
Example: In the last 20 candles, suppose 12 green candles total 1,200 volume and 8 red candles total 800 volume. Total = 2,000. Delta = (1,200/2,000) × 100 = 60%. - BuyPer (Buy Percentage): Calls volumeDelta(period) to get the current candle’s buy percentage. This value drives coloring and display.
- DeltaColor (Gradient color): Uses color.from_gradient() based on BuyPer. If BuyPer = 40%, the color leans toward colDn (red). If 60%, it leans toward colUp (green). The 40–60% range is neutral (intermediate color).
- Colored candles (plotcandle): Repaints candles using DeltaColor, including bodies and wicks—so the entire chart reflects Delta.
- drawRowDelta() — render Dashboard: For each symbol in symbols:
- Use request.security() to fetch that symbol’s Delta (can differ from the current chart symbol).
- Draw 20 squares to form a progress bar. Green squares = Delta/5 (e.g., 60% → 12 green); the remainder is red.
- Show “Buy: X%” and “Sell: Y%” labels in the table.
- Delta Bar (label + box): If deltaBar = true, the indicator draws:
- A text label with “Buy: X%” and “Sell: Y%”.
- Two box rectangles: lower green (height = BuyPer%), upper red (height = Sell%).
- A dashed horizontal line separating both parts.
- All placed to the right of the latest candle, offset by offset.
📤 Outputs and their role in use:
- Colored Candles: Visualize buy/sell strength on each candle. Traders can “read” market sentiment without numbers. Role: quickly spot potential reversals (when the candle color flips between red and green).
- Delta Bar: Provides exact buy/sell percentages for the latest candle. Role: make entry/exit decisions based on Delta thresholds (e.g., only buy when Buy > 60%).
- Multi-Asset Dashboard: Compare Delta across multiple markets. Role: find the strongest momentum or the broad theme of a basket (e.g., if most USD pairs have low Delta → broad USD weakness).
Input: You set period = 20 and view EURUSD on H1. The last 20 candles include: 13 green (close > open) totaling 26,000 volume, and 7 red totaling 14,000.
Logic processing: volumeDelta(20) computes:
• volumeBuy = 26,000
• volumeSell = 14,000
• totalVol = 40,000
• Delta = (26,000 / 40,000) × 100 = 65%
• DeltaColor = a gradient leaning green because 65% > 60%
Output:
• The current candle is colored a fairly deep green
• The Delta Bar shows: “Buy: 65%” (lower green area 65% height) and “Sell: 35%” (upper red area 35%)
• The Dashboard indicates EURUSD has relatively strong buying vs. other pairs (e.g., USDJPY 45%, GBPUSD 52%, etc.)
Trading decision: With Delta = 65%, consider a EURUSD BUY if price is at support or just broke out. Place SL below support and TP when Delta starts falling back below < 55%.


Use the analysis above + the code below to instruct AI to modify the indicator and turn it into a trading bot—no coding required!
How to do it here -> 👉ZERO2HERO👈
					// This work is licensed under Creative Commons Attribution-NonCommercial-ShareAlike 4.0 International
// https://creativecommons.org/licenses/by-nc-sa/4.0/
// © BigBeluga

//@version=6
indicator("Volume Delta [BigBeluga]", overlay = true)
plot(na, editable = false)

// INPUTS ――――――――――――――――――――――――――――――――――――――――――――――――――――――――――――――――――――――――――――――――――――――――――――――――――――――――{

deltaBar    = input.bool(true, "", inline = "bar", group = "DELTA BAR")
offset      = input.int(5, "Offset", inline = "bar", group = "DELTA BAR")
displayDash = input.bool(true, "DashBoard", group = "DashBoard")
period      = input.int(20, "Period", group = "DashBoard")

symbols = array.from(
     input.symbol("EURUSD", "1", group = "DashBoard"),
     input.symbol("USDJPY", "2", group = "DashBoard"),
     input.symbol("GBPUSD ", "3", group = "DashBoard"),
     input.symbol("AUDUSD", "4", group = "DashBoard"),
     input.symbol("USDCAD", "5", group = "DashBoard")
 )

colUp = input.color(#18d0b1, "", inline = "color")
colDn = input.color(#c2185b, "", inline = "color")

// }


// CALCULATIONS――――――――――――――――――――――――――――――――――――――――――――――――――――――――――――――――――――――――――――――――――――――――――――――{

volumeDelta(period)=>
    volumeBuy   = 0.
    volumeSell  = 0.

    for i = 0 to period
        if close[i] > open[i]
            volumeBuy += volume[i]
        else
            volumeSell += volume[i]

    totalVol = volumeBuy + volumeSell

    volumeBuy/totalVol*100

BuyPer      = volumeDelta(period)
DeltaColor  = color.from_gradient(BuyPer, 40, 60, colDn, colUp)

plotcandle(open, high, low, close, title='Title', color = DeltaColor, wickcolor=DeltaColor, bordercolor = DeltaColor, force_overlay = true)
barcolor(DeltaColor)

var dash = table.new(position.bottom_right, 100, 100, border_color = chart.bg_color, border_width = 1, force_overlay = true)
if displayDash
    dash.cell(0, 0, "TRADING PAIRS", text_color = color.gray, text_halign = text.align_left)
    dash.merge_cells(1, 0, 20, 0)
    dash.cell(1, 0, "VOLUME DELTA\n▼", text_color = color.gray)


drawRowDelta(sym, period, row, empty = false)=>
    if barstate.islast
        buyPercent = request.security(sym, "", volumeDelta(period))

        dash.cell(0, row, sym, text_color = chart.fg_color, text_halign = text.align_left)

        for i = 1 to 20
            dash.cell(i, row, "", bgcolor = color.from_gradient(i, int(buyPercent/5), 20, color.new(colDn, 0), color.new(colDn, 50)), width = 2)

        for i = 1 to int(buyPercent/5)+1
            if i <= int(buyPercent/5)
                dash.cell(i, row, i == int(buyPercent/5) ? "Buy\n" + str.tostring(buyPercent, format.percent) : ""
                         , bgcolor = color.from_gradient(i, 1, int(buyPercent/5), color.new(colUp, 50), colUp)
                         , text_color = colDn
                         , text_size = size.small
                         , width = 2
                         )
            else
                dash.cell(i, row, "Sell\n" + str.tostring(100-buyPercent, format.percent)
                         , bgcolor = colDn, text_color = colUp
                         , text_size = size.small
                         , width = 2
                         )

atr = ta.atr(200)*2
// }

// PLOT ――――――――――――――――――――――――――――――――――――――――――――――――――――――――――――――――――――――――――――――――――――――――――――――――――――――――――――{

if barstate.islast
    if displayDash
        for s in symbols
            drawRowDelta(s, period, symbols.indexof(s)+1)

    if deltaBar
        label.delete(
             label.new(bar_index+5+offset, hl2
                     , "Sell: " + str.tostring(100-BuyPer, format.percent) + "\nBuy: " + str.tostring(BuyPer, format.percent)
                     , color = color(na)
                     , textcolor = DeltaColor
                     , style = label.style_label_left)[1]
         )

        top  = hl2+atr
        bot  = hl2-atr
        step = (top-bot) / 100

        box.delete(
             box.new(bar_index+2+offset, hl2+atr, bar_index+5+offset, hl2-atr, bgcolor = colDn, border_color = chart.bg_color)[1]
         )
        box.delete(
             box.new(bar_index+2+offset, bot+step*BuyPer, bar_index+5+offset, bot, bgcolor = colUp, border_color = chart.bg_color)[1]
         )
        line.delete(
             line.new(bar_index+2+offset, hl2, bar_index+5+offset, hl2, force_overlay = true, color = chart.bg_color, style = line.style_dotted)[1]
         )
// }
Các chỉ báo khác

Scalper Pro Smart Money Concept
Scalper Pro is built on 3 core principles of market trading:
Sustained trend principle
Smart Money Theory
Volatility-based risk management
What’s special: Rather than a simple bundle of separate indicators, Scalper Pro forms a multi-layer confirmation system.

Bitgak Korean Indicator Analysis
Bitgak (번각 — Korean for “Oblique Angle”) is a strategy widely used by professional Korean traders, sometimes even preferred over Fibonacci Retracement.
Volume Delta Bigbeluga Analysis
Volume Delta [BigBeluga] – Indicator Description 1. Volume Delta [BigBeluga] Indicator Description Analyze the strength between buying and selling pressure through traded volume 1.1 Indicator Concept Volume Delta is an indicator based on the principle of Order Flow Analysis—a method of assessing the market’s true strength through the actions of