1. Indicator Description – Adaptive S/R Zones [BigBeluga]
Automatically detects pivot-based support and resistance levels, filters noise, tracks breakouts, and scales line thickness over time to reflect level age
1.1 Indicator Concept
Traditional support and resistance indicators either draw too many levels (cluttering the chart) or require manual placement. This indicator solves both problems with three key ideas:
1. Pivot-based detection: A level is only drawn when price forms a confirmed swing high or swing low — a local peak or trough where price clearly reversed. This filters out random noise and only keeps structurally significant price levels.
2. ATR-adaptive filtering: All thresholds — how strong a pivot must be, how close two levels must be before merging, and how far price must break beyond a level — are expressed as multiples of ATR (Average True Range). This means the indicator automatically adjusts to the current volatility of any asset and timeframe. A level that would be "significant" on a crypto chart is treated differently than on a low-volatility forex pair.
3. Longevity scaling: A level that has survived for many bars without being broken is more significant than a fresh one. The indicator expresses this by gradually increasing the line's thickness over time — older levels become visually thicker and therefore more prominent.
1.2 Indicator Features
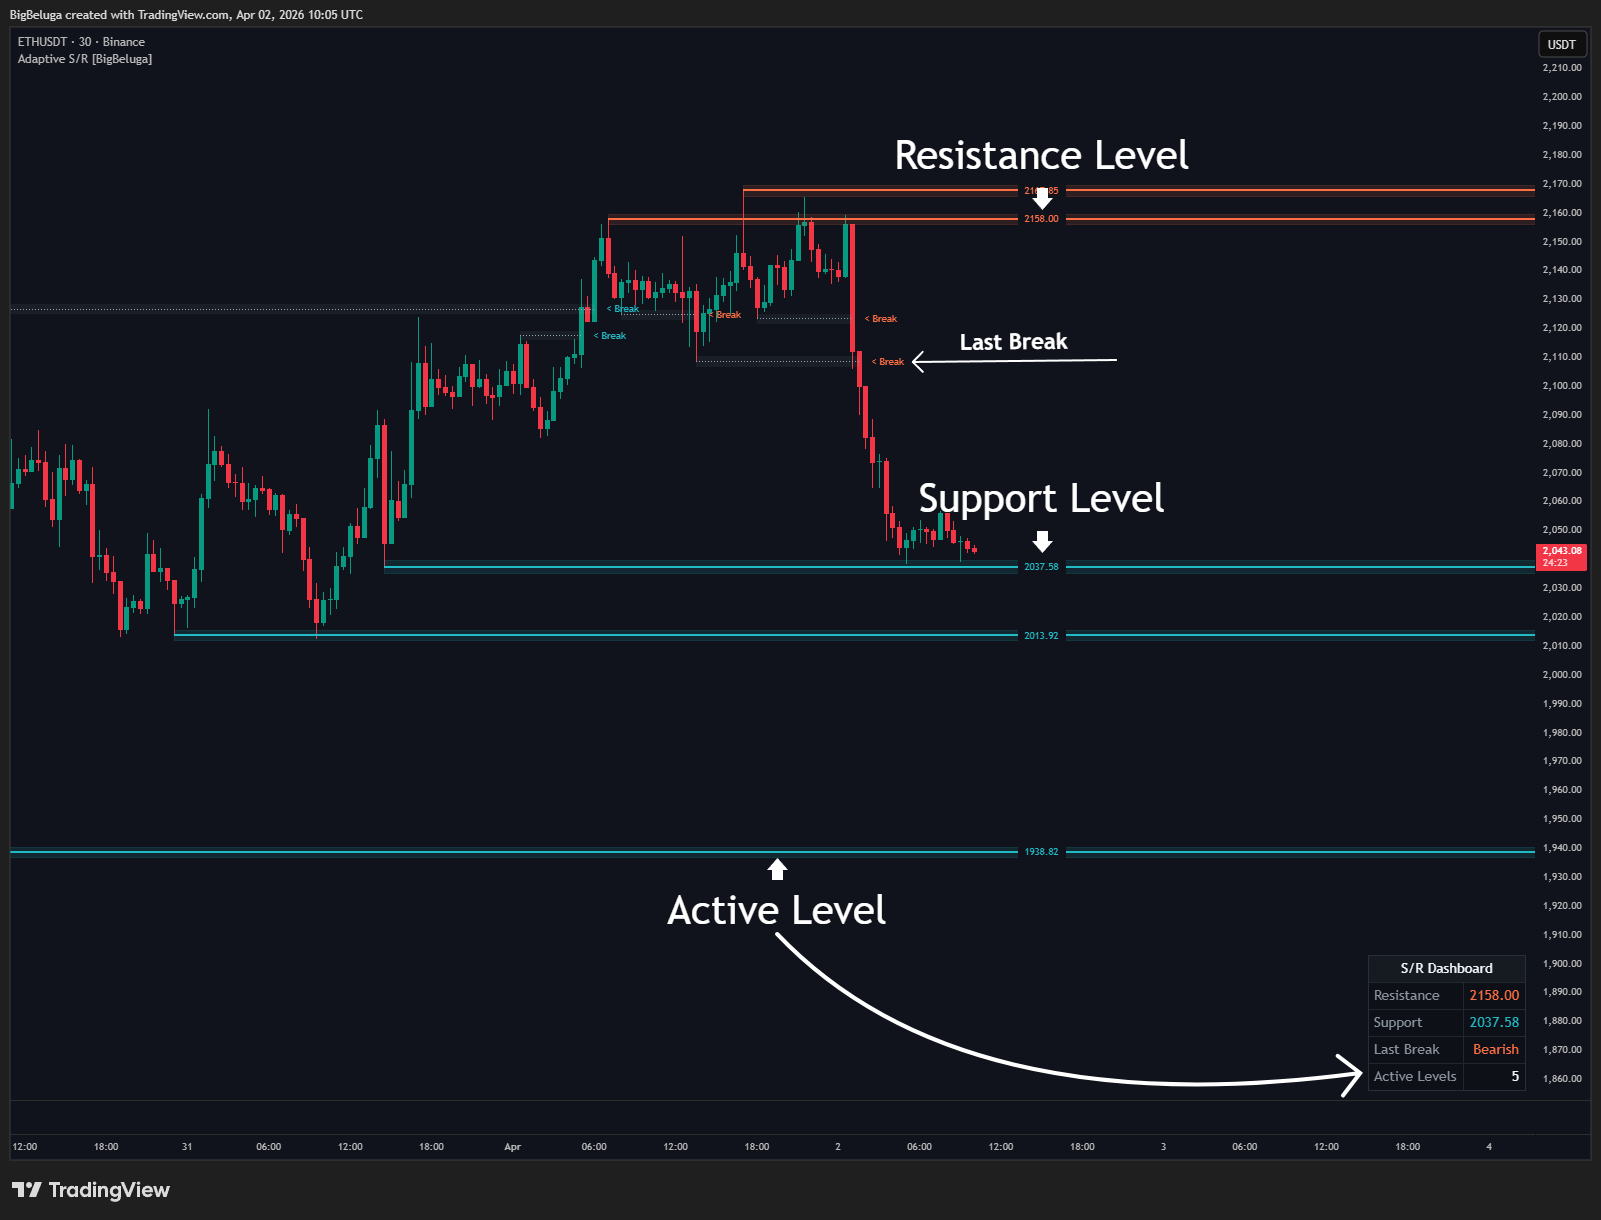
- Active S/R Level Lines: Solid horizontal lines — teal for support, orange for resistance — extending to the right from the pivot bar. Line thickness grows over time if Longevity Width is enabled.
- Level Zone Boxes: A semi-transparent shaded rectangle around each level, width controlled by zoneWidth × ATR. Provides a visual "zone" rather than a sharp line, acknowledging that S/R rarely holds at an exact price.
- Price Labels on Active Levels: A small label showing the exact price of each active level, floating 10–20 bars to the right of the current bar for easy reading.
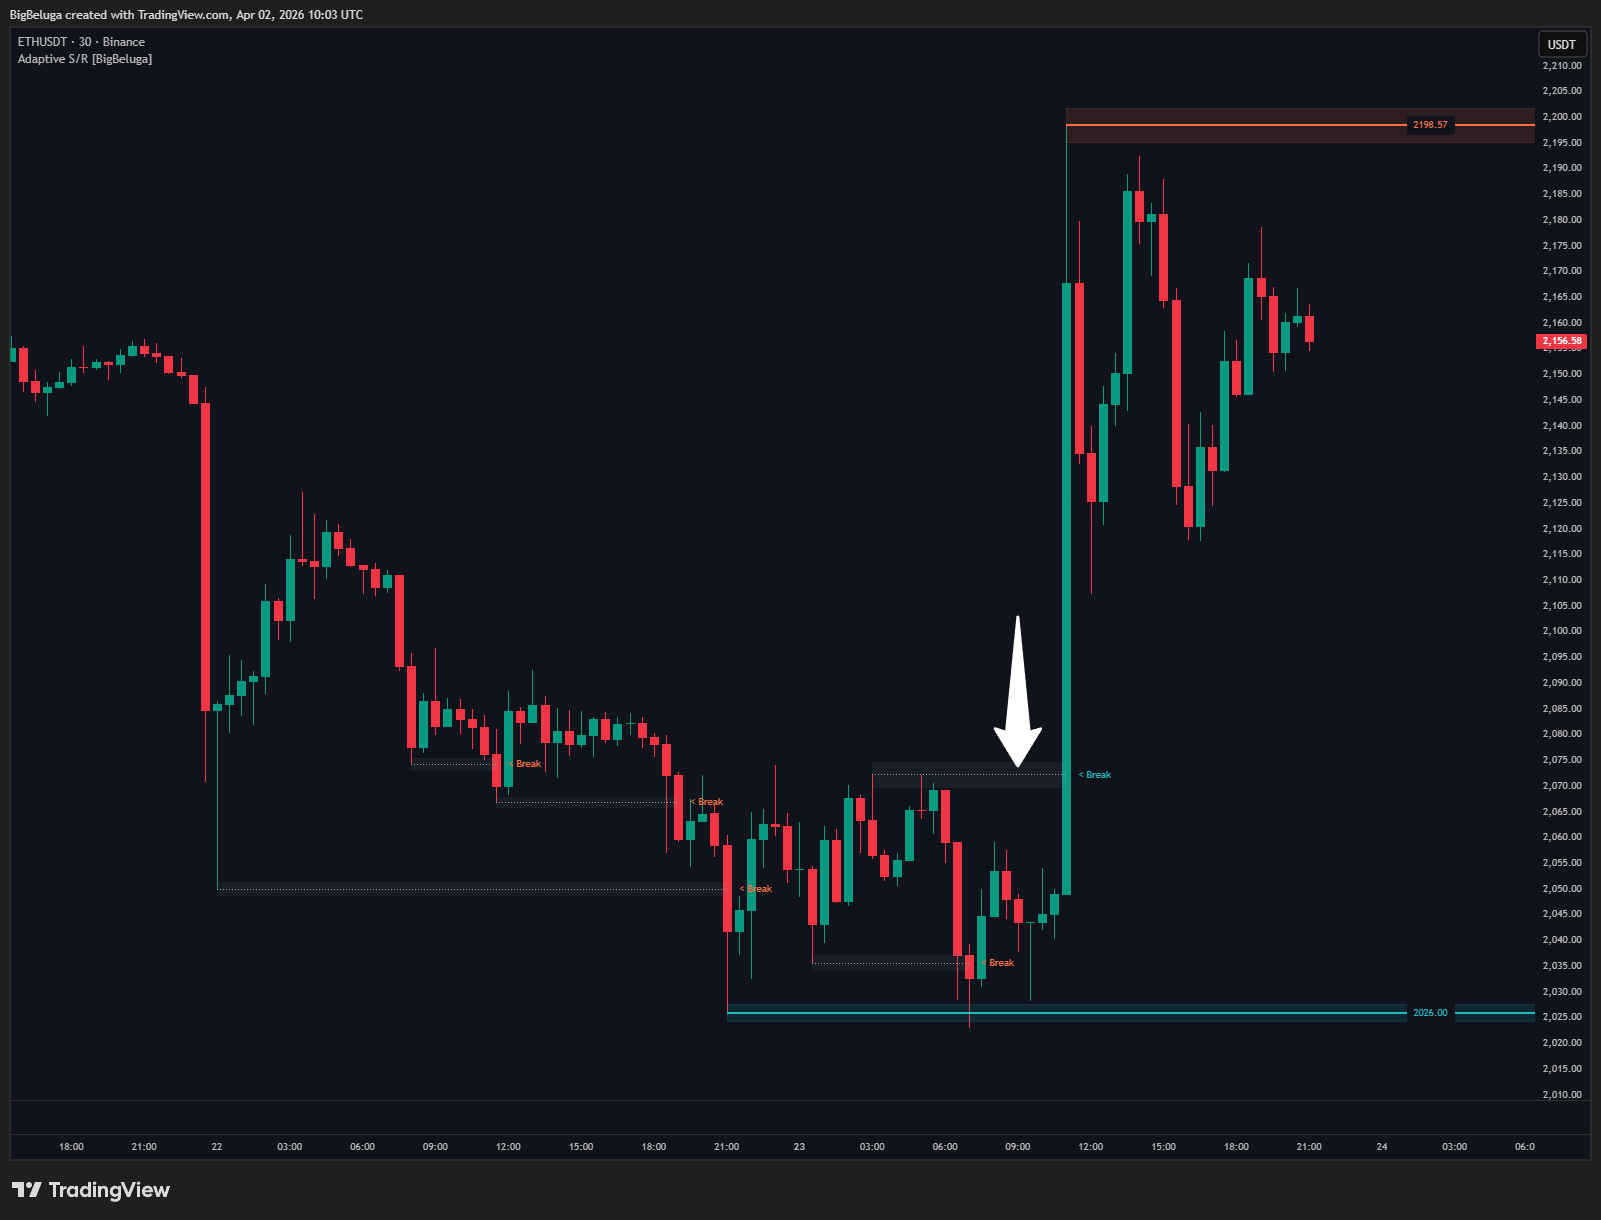
- Breakout Detection & Broken Level Display: When price closes beyond a level by more than breakSens × ATR, the level is marked as broken. Its line turns gray and dotted, the zone box shrinks to the breakout point, and a "Break" label appears. Up to maxBroken broken levels remain visible.
- Break Direction Label: A small "< Break" label at the breakout candle showing which side the break occurred on.
- Longevity Width Scaling: When enabled, line width grows from 1 up to maxLineWidth as the level ages relative to maxAgeBars.
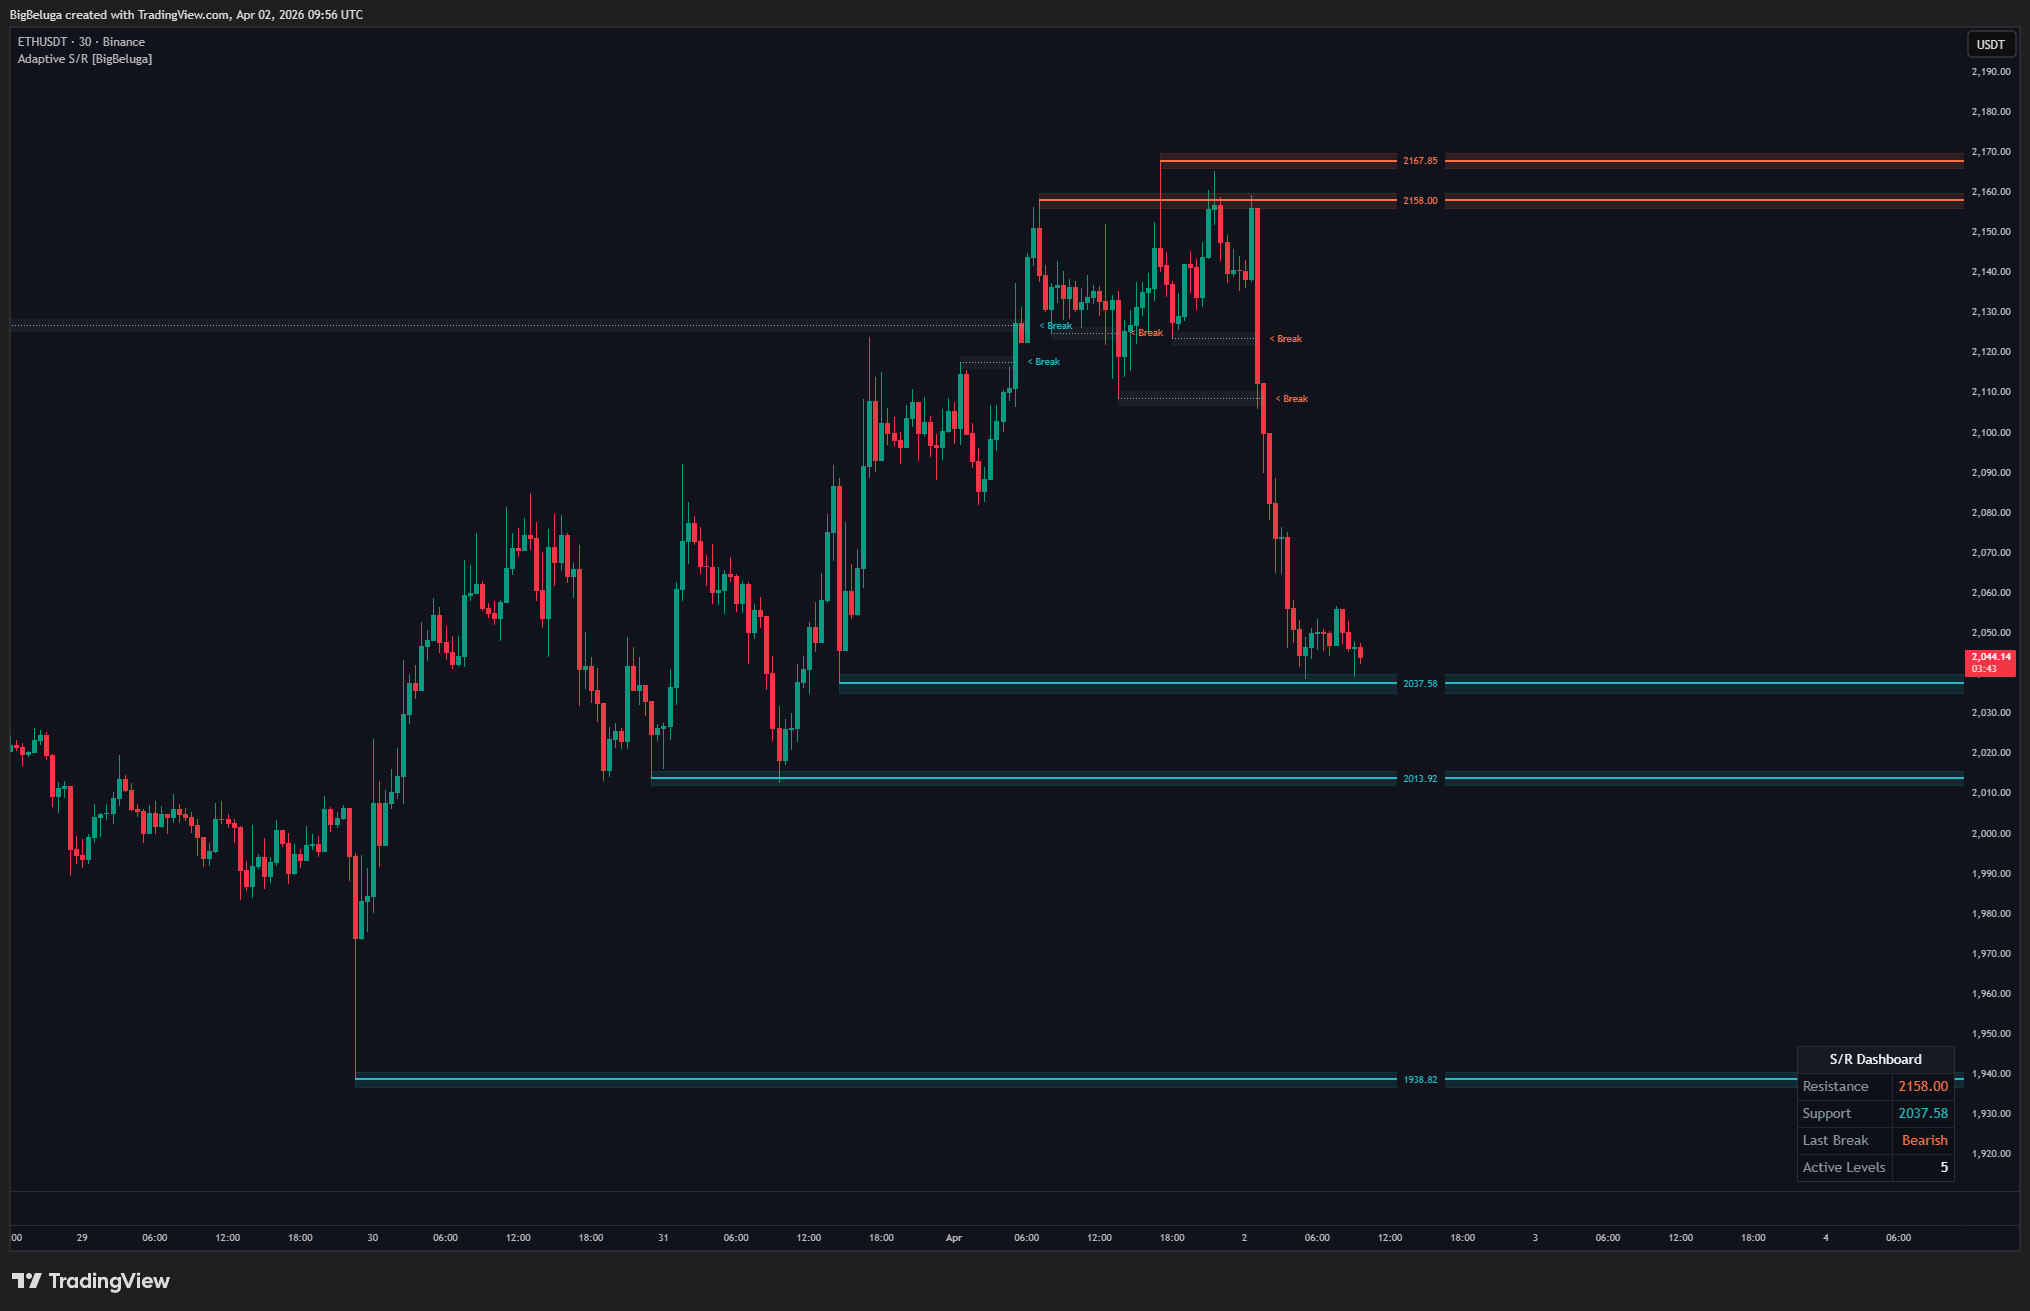
- Dashboard Table: A small table (configurable position) showing: nearest resistance price, nearest support price, direction of the last breakout (Bullish / Bearish), and total active level count.
1.3 How to Use the Indicator
- Trade bounces at active levels: When price approaches a teal support level, watch for bullish price action to enter long. When approaching an orange resistance level, watch for bearish price action to enter short or take profit.
- Prioritize thicker lines: A thick line means the level has survived many bars — more tests without being broken = more reliable. Thin lines are fresh and less proven. When entering at a level, prefer the thickest one nearest to price.
- Use the zone width as your entry/stop zone: The shaded box around each line shows the uncertainty range of the level. Place entries near the center of the zone and stops outside the full zone width.
- Trade breakouts using the Break label: When a "< Break" label appears and the level line turns gray, it signals a confirmed breakout with ATR-based confirmation. The broken resistance can be re-tested as support (role reversal), and vice versa.
- Watch the Dashboard for market structure context: The nearest support and resistance prices give instant context for where price is positioned in the current structure. The "Last Break" direction tells you which side was dominant most recently.
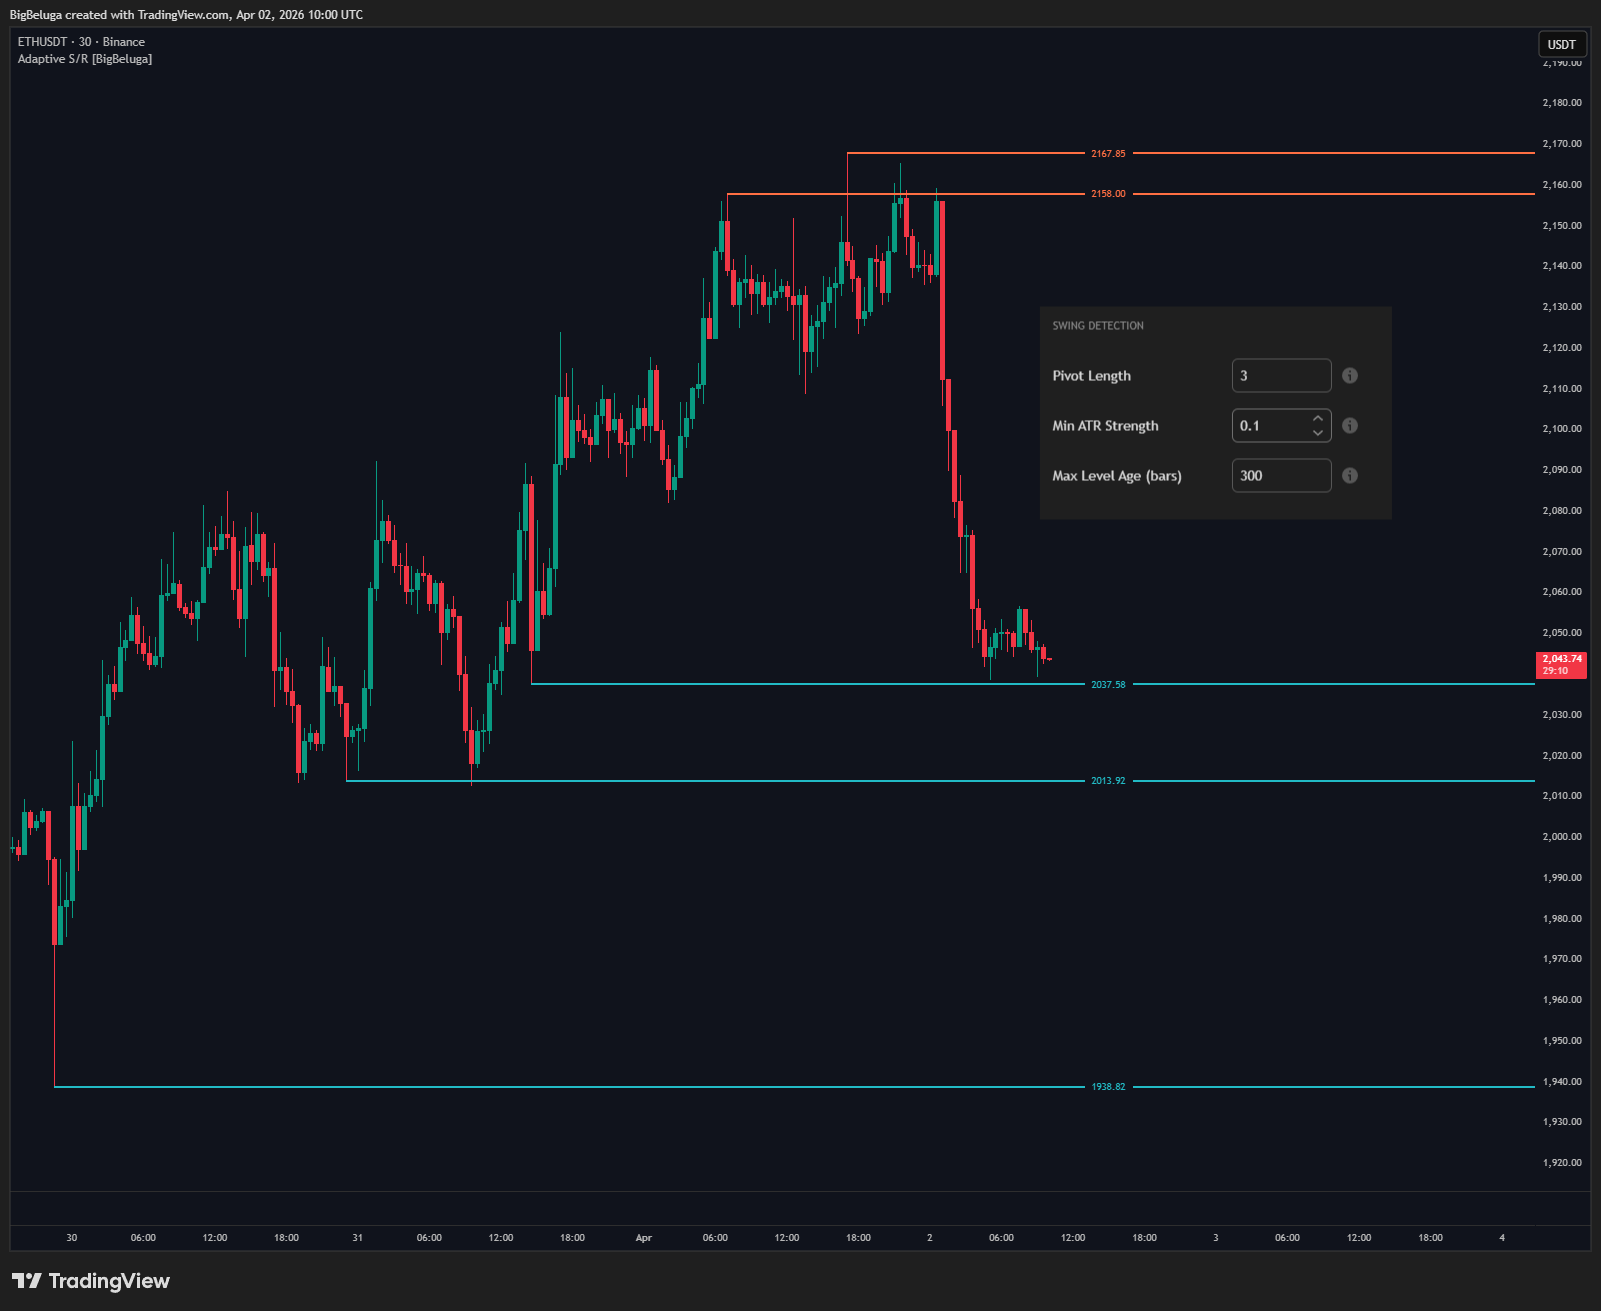
- Adjust pivotLen to match timeframe: Shorter values (e.g. 3) produce more frequent, smaller swing levels. Longer values (e.g. 10–15) produce fewer, major structural levels. Match this to your trading timeframe.
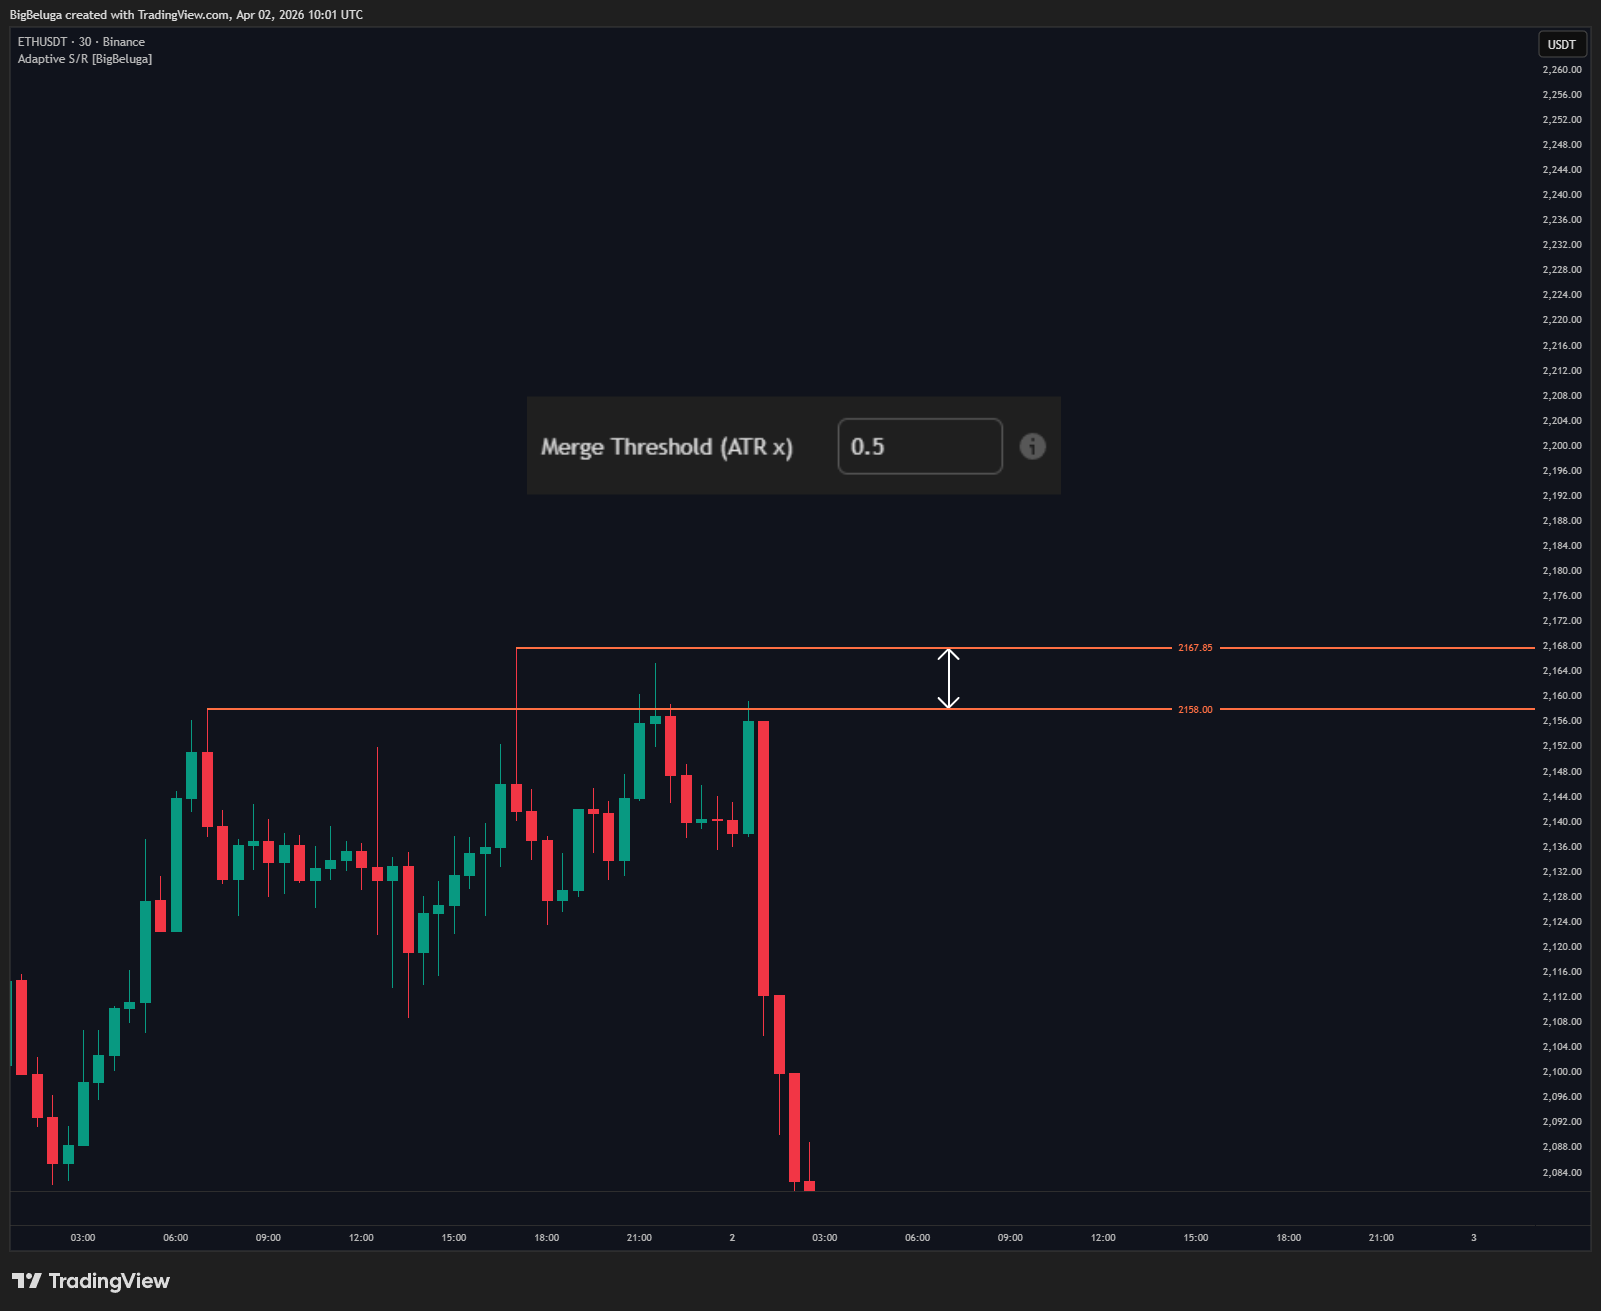
- Increase mergeThresh to reduce level clusters: In fast-moving markets, several pivots may form near the same price. Increasing the merge threshold consolidates them into one level, reducing chart noise.
1.4 How the Indicator Works
Inputs & Their Roles- pivotLen (Integer, default 5, range 2–50): The number of bars on each side required to confirm a pivot. A pivot high is confirmed when a bar's high is the highest in a window of pivotLen bars before AND after it. Larger values create fewer, more significant pivots. Note: confirmation is always delayed by pivotLen bars.
- minStrength (Decimal, default 0.1): Minimum separation between the pivot price and its immediate neighbors, expressed as a multiple of ATR. Set to 0 to accept all pivots regardless of how "sharp" they are. Higher values only accept well-defined peaks and troughs.
- maxAgeBars (Integer, default 300): Maximum number of bars a level can exist before being automatically deleted. Also used as the denominator in the longevity width calculation — a level at age 300/300 reaches maximum line thickness.
- showSupport / showResist (Checkboxes): Toggle support and resistance levels independently.
- maxLevels (Integer, default 5, range 1–20): Maximum number of active support levels AND resistance levels simultaneously. Once this cap is reached, new pivots of that type are ignored until existing ones break or age out.
- mergeThresh (Decimal, default 0.5): If a new pivot is within mergeThresh × ATR of an existing same-type level, it is discarded as a duplicate. This prevents multiple lines clustering in a narrow price range.
- showZones / zoneWidth: Toggle zone boxes and set their half-width as a multiple of ATR. Example: zoneWidth = 0.25 with ATR = 20 → zone spans ±5 points around the level price.
- breakSens (Decimal, default 0.1): How far beyond a level price must close to confirm a breakout, in ATR multiples. Small values (e.g. 0.05) trigger on any minimal close beyond; larger values (e.g. 0.5) require a strong decisive close.
- showBroken / maxBroken: Toggle visibility of broken levels and cap how many are shown. Oldest broken levels are removed first when the cap is exceeded.
- showBreakLbl: Toggle the "< Break" label that appears at the breakout candle.
- useDynamicWidth / maxLineWidth: Toggle longevity scaling and set the maximum line thickness an old level can reach.
- lineWidth: Fixed line width used when useDynamicWidth is OFF.
- showDash / dashPos: Toggle the dashboard table and position it in one of the four chart corners.
- showPriceLbl: Toggle floating price labels on active levels.
- supColor / resColor / brokenColor: Colors for support lines, resistance lines, and broken level lines respectively.
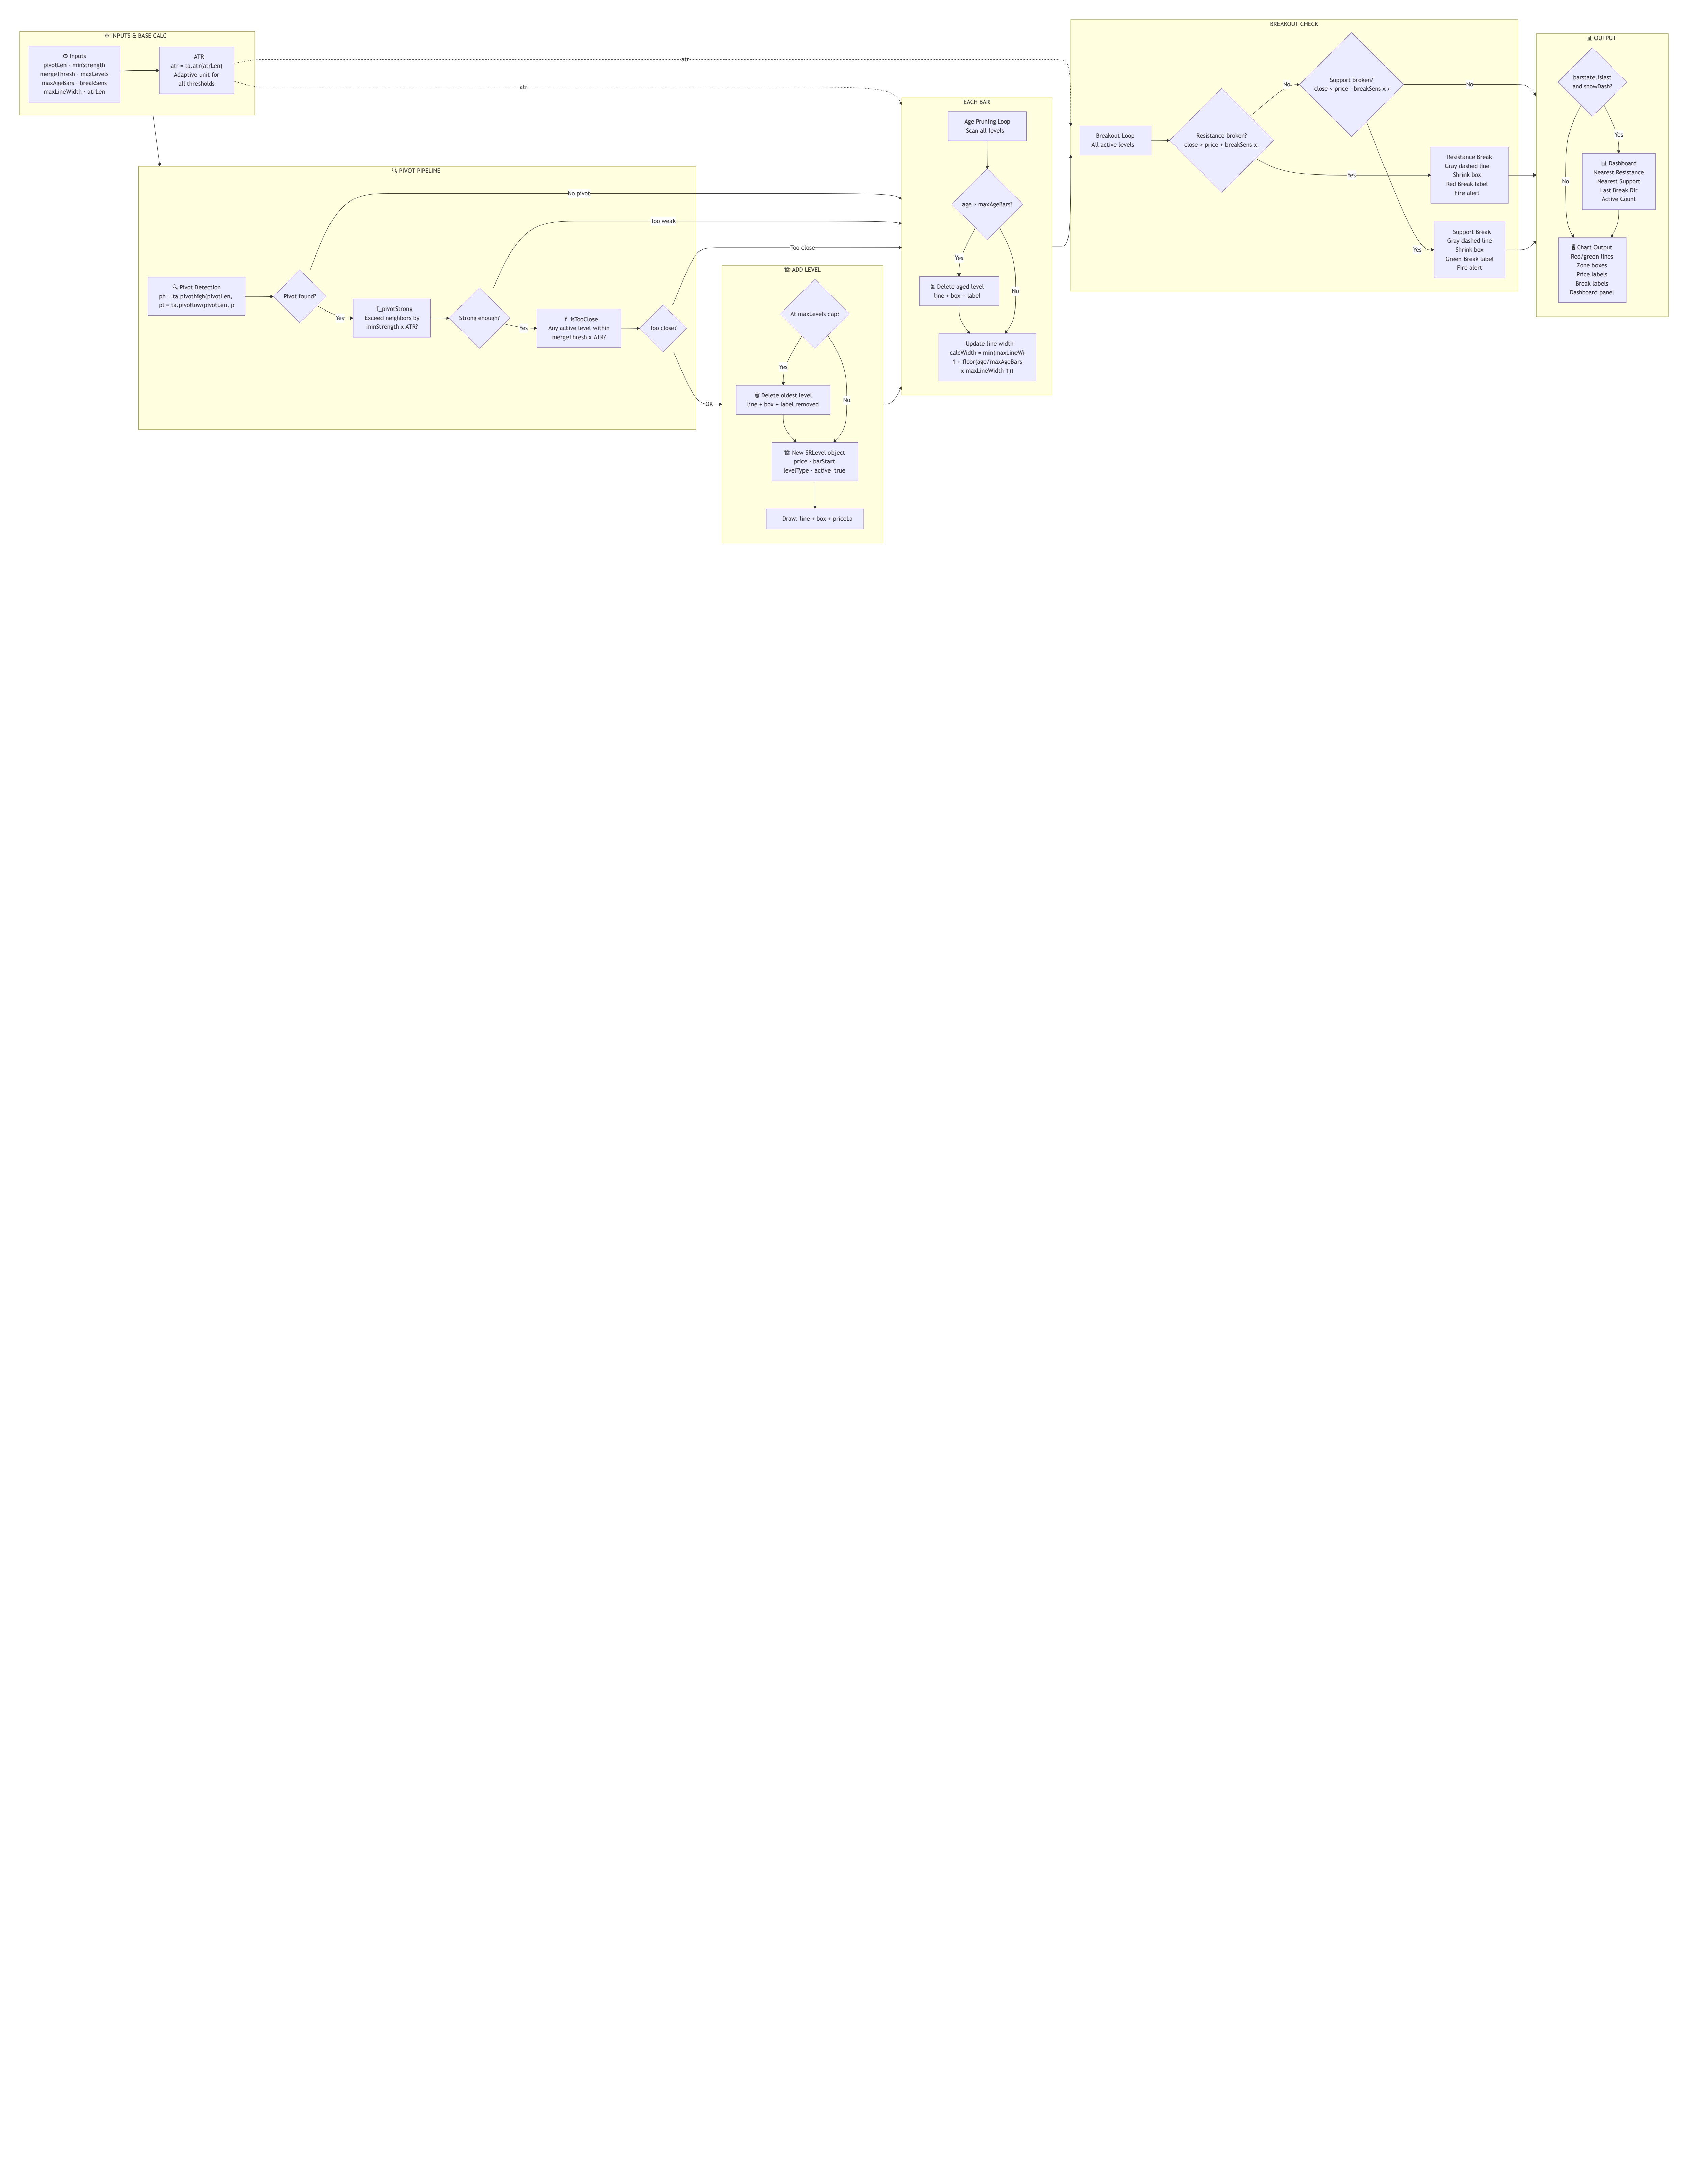
🔷 Flow 1 – Pivot Detection
On every bar, the indicator checks for confirmed pivots using PineScript's built-in functions:
ph = ta.pivothigh(high, pivotLen, pivotLen) — returns the pivot high price if bar[pivotLen] is the highest high in a window of (2 × pivotLen + 1) bars; otherwise returns na.pl = ta.pivotlow(low, pivotLen, pivotLen) — same logic for lows.
Because a pivot requires pivotLen bars on the right side to confirm, every detected pivot is actually placed pivotLen bars in the past: bar_index - pivotLen. Example: pivotLen = 5 means a swing high is confirmed 5 bars after it occurred.
🔷 Flow 2 – Pivot Strength Filter
Before adding any pivot, f_pivotStrong() checks that the pivot stands out from its immediate neighbors by at least minStrength × ATR:
| Pivot Type | Check | Meaning |
|---|---|---|
| Resistance (pivot high) | pivot price − max(high[pivotLen−1], high[pivotLen+1]) ≥ minStrength × ATR | The peak must stand meaningfully above its two immediate neighbor bars |
| Support (pivot low) | min(low[pivotLen−1], low[pivotLen+1]) − pivot price ≥ minStrength × ATR | The trough must sit meaningfully below its two immediate neighbor bars |
🔷 Flow 3 – Merge Check & Level Cap
f_isTooClose() loops through all active same-type levels. If any existing level is within mergeThresh × ATR of the new pivot → the new pivot is discarded. If the new pivot passes, f_addLevel() checks whether the count of active same-type levels has reached maxLevels. If yes → also discarded.
🔷 Flow 4 – Level Creation
When a pivot passes all filters, three chart objects are created and stored in the SRLevel object:
- Main line: A solid horizontal line from the pivot bar extending right, colored teal (support) or orange (resistance).
- Zone box: A semi-transparent rectangle centered on the level price, half-height = zoneWidth × ATR × 0.5 above and below.
- Price label: A small floating label showing the exact price, positioned 20 bars ahead of the current bar.
🔷 Flow 5 – Age Pruning
Every bar, before adding new pivots, the indicator loops through all active levels and deletes any level where (bar_index − level.barStart) > maxAgeBars. All three chart objects (line, box, label) are deleted and the level is removed from the array.
🔷 Flow 6 – Breakout Detection
Every bar, active levels are checked for breakouts using the closing price:
Resistance broken: close > level.price + breakSens × ATRSupport broken: close < level.price − breakSens × ATR
When broken, the level undergoes a visual transformation:
- Main line → gray, dotted, no longer extended, stopped at current bar
- Zone box → gray, shrunk to fit only the breakBuffer range around the level price
- "< Break" label → placed at the breakout candle
- Level moved from activeLevels array to brokenLevels array
- If brokenLevels exceeds maxBroken → oldest broken level is deleted entirely
🔷 Flow 7 – Longevity Width Scaling (per bar)
On every bar, for each active level, the current line width is recalculated:
age = bar_index − level.barStartcalcWidth = min(maxLineWidth, 1 + floor((age / maxAgeBars) × (maxLineWidth − 1)))
A brand-new level (age = 0) gets width 1. A level at age = maxAgeBars gets width = maxLineWidth. The progression is linear. Example: maxLineWidth = 7, maxAgeBars = 300 → every ~50 bars of survival, the line gains 1 pixel of thickness.
🔷 Flow 8 – Dashboard
On the last bar (barstate.islast), the dashboard scans all active levels to find:
- Nearest support: Highest support level price that is still below the current close.
- Nearest resistance: Lowest resistance level price that is still above the current close.
These, along with the last break direction and total active level count, are displayed in a 2-column, 5-row table at the chosen corner.
Outputs & Their Role in Trading- Active level lines (teal/orange): The primary visual output. Solid lines with growing thickness mark where price has structurally reversed. The thicker the line, the more time the level has survived without being broken — a measure of its reliability.
- Zone boxes: Define the "entry zone" around each level. Price entering the zone signals potential reaction. Width proportional to ATR keeps zones meaningful across all volatility regimes.
- Broken level lines (gray dotted): Historical memory of where price broke through. Former resistance becomes potential new support and vice versa — role reversal setups.
- "< Break" labels: Mark the exact candle where a breakout was confirmed. Useful for identifying momentum entries.
- Dashboard table: Instant structural context. Nearest S/R prices and last break direction give a quick read of where price stands in the current structure without scanning the full chart.

					// This work is licensed under Creative Commons Attribution-NonCommercial-ShareAlike 4.0 International
// https://creativecommons.org/licenses/by-nc-sa/4.0/
// © BigBeluga

//@version=6
indicator("Adaptive S/R Zones [BigBeluga]", shorttitle="Adaptive S/R [BigBeluga]", overlay=true, max_lines_count=500, max_labels_count=200, max_boxes_count=200)

// INPUTS ――――――――――――――――――――――――――――――――――――――――――――――――――――――――――――――――――――――――――――――――――――――――――――――――――――――――{

var grpSwing = "Swing Detection"
pivotLen     = input.int(5,   "Pivot Length",      minval=2, maxval=50,   group=grpSwing, tooltip="The number of bars on each side of a high or low to confirm a pivot point.")
minStrength  = input.float(0.1, "Min ATR Strength", minval=0.0, maxval=5.0, step=0.05, group=grpSwing, tooltip="Minimum distance required between the pivot and its neighbors.")
maxAgeBars   = input.int(300, "Max Level Age (bars)", minval=20, maxval=2000, group=grpSwing, tooltip="Maximum bars a level exists before removal. Also used to calculate longevity scaling.")

var grpLevels = "Levels"
showSupport  = input.bool(true,  "Show Support Levels",    group=grpLevels)
showResist   = input.bool(true,  "Show Resistance Levels", group=grpLevels)
maxLevels    = input.int(5,      "Max Active Levels Each", minval=1, maxval=20, group=grpLevels)
mergeThresh  = input.float(0.5,  "Merge Threshold (ATR x)", minval=0.0, maxval=3.0, step=0.05, group=grpLevels)
showZones    = input.bool(true,  "Show Level Zones",       group=grpLevels)
zoneWidth    = input.float(0.25, "Zone Width (ATR x)",     minval=0.05, maxval=2.0, step=0.05, group=grpLevels)

var grpBreak = "Breakouts"
showBroken   = input.bool(true,  "Show Broken Levels",         group=grpBreak)
breakSens    = input.float(0.1,  "Break Sensitivity (ATR x)",  minval=0.0, maxval=2.0, step=0.05, group=grpBreak)
showBreakLbl = input.bool(true,  "Show Break Labels",          group=grpBreak)
maxBroken    = input.int(4,      "Max Broken Levels Shown",    minval=0, maxval=20, group=grpBreak)

var grpVis = "Visuals"
supColor     = input.color(color.new(#22bac5, 0),  "Support Color",         group=grpVis)
resColor     = input.color(color.new(#ff6f43, 0),  "Resistance Color",      group=grpVis)
brokenColor  = input.color(color.new(#94a3b8, 0),  "Broken Level Color",    group=grpVis)
lineWidth    = input.int(2, "Base Line Width",     minval=1, maxval=5,      group=grpVis, tooltip="Used when Longevity Scaling is OFF.")

//  NEW LONGEVITY INPUTS
useDynamicWidth = input.bool(true, "Enable Longevity Width", group=grpVis, tooltip="When enabled, older levels become thicker over time.")
maxLineWidth    = input.int(7, "Max Longevity Width", minval=1, maxval=10, group=grpVis, tooltip="The maximum thickness an old level can reach.")

showDash     = input.bool(true, "Show Dashboard",   group=grpVis)
showPriceLbl = input.bool(true, "Show Price Labels on Active Levels", group=grpVis)

var grpDash = "Dashboard"
dashPos      = input.string("Bottom Right", "Dashboard Position", options=["Top Right","Bottom Right","Top Left","Bottom Left"], group=grpDash)

// }
// CALCULATIONS――――――――――――――――――――――――――――――――――――――――――――――――――――――――――――――――――――――――――――――――――――――――――――――{

type SRLevel
    float  price
    int    barStart
    int    levelType
    bool   active
    bool   broken
    int    breakBar
    bool   retested
    line   mainLine
    box    zoneBox
    label  breakLabel
    label  priceLabel

var array<SRLevel> activeLevels = array.new<SRLevel>()
var array<SRLevel> brokenLevels = array.new<SRLevel>()
var string         lastBreakDir = "—"
var int            lastBreakBar = na

atrVal  = ta.atr(14)
atrSafe = na(atrVal) or atrVal == 0 ? syminfo.mintick * 10 : atrVal

ph = ta.pivothigh(high, pivotLen, pivotLen)
pl = ta.pivotlow(low,   pivotLen, pivotLen)

f_isTooClose(_price, _type) =>
    bool tooClose = false
    int  sz = array.size(activeLevels)
    if sz > 0
        for i = 0 to sz - 1
            lvl = array.get(activeLevels, i)
            if lvl.levelType == _type and lvl.active
                if math.abs(lvl.price - _price) < mergeThresh * atrSafe
                    tooClose := true
                    break
    tooClose

f_addLevel(_price, _type, _barIdx) =>
    if not f_isTooClose(_price, _type)
        int sz  = array.size(activeLevels)
        int cnt = 0
        if sz > 0
            for i = 0 to sz - 1
                lvl = array.get(activeLevels, i)
                if lvl.levelType == _type and lvl.active
                    cnt += 1

        if cnt < maxLevels
            _baseColor = _type == 1 ? resColor : supColor
            _zoneTop   = _price + zoneWidth * atrSafe * 0.5
            _zoneBot   = _price - zoneWidth * atrSafe * 0.5

            newLine = line.new(
                 x1     = _barIdx,
                 y1     = _price,
                 x2     = _barIdx + 1,
                 y2     = _price,
                 extend = extend.right,
                 color  = color.new(_baseColor, 0),
                 width  = lineWidth,
                 style  = line.style_solid
             )

            newBox = showZones ? box.new(
                 left         = _barIdx,
                 top          = _zoneTop,
                 right        = _barIdx + 1,
                 bottom       = _zoneBot,
                 border_color = color.new(_baseColor, 90),
                 bgcolor      = color.new(_baseColor, 88),
                 extend       = extend.right
             ) : na

            newPriceLbl = showPriceLbl ? label.new(
                 x         = bar_index + 20,
                 y         = _price,
                 text      = str.tostring(_price, format.mintick),
                 style     = label.style_label_center,
                 textcolor = _baseColor,
                 color     = color.new(chart.bg_color, 0),
                 size      = size.small
             ) : na

            array.push(activeLevels, SRLevel.new(
                 price      = _price,
                 barStart   = _barIdx,
                 levelType  = _type,
                 active     = true,
                 broken     = false,
                 breakBar   = na,
                 retested   = false,
                 mainLine   = newLine,
                 zoneBox    = newBox,
                 breakLabel = na,
                 priceLabel = newPriceLbl
             ))

f_pivotStrong(_price, _type) =>
    bool strong = true
    if minStrength > 0
        if _type == 1
            nearHigh = math.max(high[pivotLen - 1], high[pivotLen + 1])
            if (_price - nearHigh) < minStrength * atrSafe
                strong := false
        else
            nearLow = math.min(low[pivotLen - 1], low[pivotLen + 1])
            if (nearLow - _price) < minStrength * atrSafe
                strong := false
    strong

// Prune old levels
int pruneSize = array.size(activeLevels)
if pruneSize > 0
    for i = pruneSize - 1 to 0
        if i < array.size(activeLevels)
            lvl = array.get(activeLevels, i)
            if lvl.active and (bar_index - lvl.barStart) > maxAgeBars
                line.delete(lvl.mainLine)
                if not na(lvl.zoneBox)
                    box.delete(lvl.zoneBox)
                if not na(lvl.priceLabel)
                    label.delete(lvl.priceLabel)
                array.remove(activeLevels, i)

// Add new pivots
if not na(ph) and showResist
    if f_pivotStrong(ph, 1)
        f_addLevel(ph, 1, bar_index - pivotLen)

if not na(pl) and showSupport
    if f_pivotStrong(pl, -1)
        f_addLevel(pl, -1, bar_index - pivotLen)

// Breakout logic
int activeSize = array.size(activeLevels)
if activeSize > 0
    for i = activeSize - 1 to 0
        if i >= array.size(activeLevels)
            continue
        lvl = array.get(activeLevels, i)
        if not lvl.active
            continue

        breakBuffer = breakSens * atrSafe

        if lvl.levelType == 1 and close > lvl.price + breakBuffer
            lvl.active   := false
            lvl.broken   := true
            lvl.breakBar := bar_index
            lastBreakDir := "Bullish"
            lastBreakBar := bar_index

            if not na(lvl.priceLabel)
                label.delete(lvl.priceLabel)
                lvl.priceLabel := na

            line.set_color(lvl.mainLine,  color.new(brokenColor, 0))
            line.set_style(lvl.mainLine,  line.style_dotted)
            line.set_width(lvl.mainLine,  1)
            line.set_extend(lvl.mainLine, extend.none)
            line.set_x2(lvl.mainLine,     bar_index)

            if not na(lvl.zoneBox)
                box.set_bgcolor(lvl.zoneBox,       color.new(brokenColor, 93))
                box.set_border_color(lvl.zoneBox,  color.new(brokenColor, 100))
                box.set_extend(lvl.zoneBox,        extend.none)
                box.set_right(lvl.zoneBox,         bar_index)
                mid = math.avg(lvl.zoneBox.get_top(), lvl.zoneBox.get_bottom())
                lvl.zoneBox.set_top(mid + breakBuffer)
                lvl.zoneBox.set_bottom(mid - breakBuffer)

            if showBreakLbl
                lvl.breakLabel := label.new(
                     x         = bar_index,
                     y         = lvl.price,
                     text      = "< Break",
                     style     = label.style_label_left,
                     textcolor = supColor,
                     color     = color.new(#22c55e, 100),
                     size      = size.small
                 )

            if showBroken
                array.push(brokenLevels, lvl)
                if array.size(brokenLevels) > maxBroken and array.size(brokenLevels) > 0
                    old = array.shift(brokenLevels)
                    if not na(old.mainLine)
                        line.delete(old.mainLine)
                    if not na(old.zoneBox)
                        box.delete(old.zoneBox)
                    if not na(old.breakLabel)
                        label.delete(old.breakLabel)
            else
                line.delete(lvl.mainLine)

                if not na(lvl.zoneBox)
                    box.delete(lvl.zoneBox)

            array.remove(activeLevels, i)

        else if lvl.levelType == -1 and close < lvl.price - breakBuffer
            lvl.active   := false
            lvl.broken   := true
            lvl.breakBar := bar_index
            lastBreakDir := "Bearish"
            lastBreakBar := bar_index

            if not na(lvl.priceLabel)
                label.delete(lvl.priceLabel)
                lvl.priceLabel := na

            line.set_color(lvl.mainLine,  color.new(brokenColor, 0))
            line.set_style(lvl.mainLine,  line.style_dotted)
            line.set_width(lvl.mainLine,  1)
            line.set_extend(lvl.mainLine, extend.none)
            line.set_x2(lvl.mainLine,     bar_index)

            if not na(lvl.zoneBox)
                box.set_bgcolor(lvl.zoneBox,       color.new(brokenColor, 93))
                box.set_border_color(lvl.zoneBox,  color.new(brokenColor, 100))
                box.set_extend(lvl.zoneBox,        extend.none)
                box.set_right(lvl.zoneBox,         bar_index)
                mid = math.avg(lvl.zoneBox.get_top(), lvl.zoneBox.get_bottom())
                lvl.zoneBox.set_top(mid + breakBuffer)
                lvl.zoneBox.set_bottom(mid - breakBuffer)

            if showBreakLbl
                lvl.breakLabel := label.new(
                     x         = bar_index,
                     y         = lvl.price,
                     text      = "< Break",
                     style     = label.style_label_left,
                     textcolor = resColor,
                     color     = color.new(#ef4444, 100),
                     size      = size.small
                 )

            if showBroken
                array.push(brokenLevels, lvl)
                if array.size(brokenLevels) > maxBroken and array.size(brokenLevels) > 0
                    old = array.shift(brokenLevels)
                    if not na(old.mainLine)
                        line.delete(old.mainLine)
                    if not na(old.zoneBox)
                        box.delete(old.zoneBox)
                    if not na(old.breakLabel)
                        label.delete(old.breakLabel)
            else
                line.delete(lvl.mainLine)
                if not na(lvl.zoneBox)
                    box.delete(lvl.zoneBox)

            array.remove(activeLevels, i)

// }
// PLOT ――――――――――――――――――――――――――――――――――――――――――――――――――――――――――――――――――――――――――――――――――――――――――――――――――――――――――――{

// Extend visuals on active levels
int extSize = array.size(activeLevels)
if extSize > 0
    for i = 0 to extSize - 1
        lvl = array.get(activeLevels, i)
        if lvl.active
            //  DYNAMIC LONGEVITY WIDTH CALCULATION
            if useDynamicWidth
                age = bar_index - lvl.barStart
                // Scale width from 1 to maxLineWidth based on maxAgeBars
                calcWidth = math.min(maxLineWidth, 1 + math.floor((age / maxAgeBars) * (maxLineWidth - 1)))
                line.set_width(lvl.mainLine, int(calcWidth))
            else
                line.set_width(lvl.mainLine, lineWidth)

            line.set_x2(lvl.mainLine, bar_index + 1)
            if not na(lvl.zoneBox)
                box.set_right(lvl.zoneBox, bar_index + 1)
            if showPriceLbl and not na(lvl.priceLabel)
                label.set_x(lvl.priceLabel, bar_index + 10)

var float nearestSup = na
var float nearestRes = na

nearestSup := na
nearestRes := na

// Dashboard scanning
int dashScanSize = array.size(activeLevels)
if dashScanSize > 0
    for i = 0 to dashScanSize - 1
        lvl = array.get(activeLevels, i)
        if not lvl.active
            continue
        if lvl.levelType == -1 and lvl.price < close
            if na(nearestSup) or lvl.price > nearestSup
                nearestSup := lvl.price
        if lvl.levelType == 1 and lvl.price > close
            if na(nearestRes) or lvl.price < nearestRes
                nearestRes := lvl.price

// Draw Dashboard
var table dashTable = na

if showDash
    tablePos = switch dashPos
        "Top Right"    => position.top_right
        "Bottom Right" => position.bottom_right
        "Top Left"     => position.top_left
        "Bottom Left"  => position.bottom_left
        => position.bottom_right

    if barstate.isfirst
        dashTable := table.new(
             position     = tablePos,
             columns      = 2,
             rows         = 5,
             bgcolor      = color.new(#0d1117, 5),
             border_color = color.new(#30363d, 40),
             border_width = 1,
             frame_color  = color.new(#30363d, 20),
             frame_width  = 1
         )

    if barstate.islast and not na(dashTable)
        table.cell(dashTable, 0, 0, "S/R Dashboard", text_color=color.new(#f0f6fc, 0), text_size=size.normal, bgcolor=color.new(#161b22, 0), text_halign=text.align_center)
        table.merge_cells(dashTable, 0, 0, 1, 0)

        table.cell(dashTable, 0, 1, "Resistance", text_color=color.new(#8b949e, 0), text_size=size.normal, bgcolor=color.new(#0d1117, 10), text_halign=text.align_left)
        table.cell(dashTable, 1, 1,
             na(nearestRes) ? "—" : str.tostring(nearestRes, format.mintick),
             text_color  = na(nearestRes) ? color.new(#484f58, 0) : resColor,
             text_size   = size.normal,
             bgcolor     = color.new(#0d1117, 10),
             text_halign = text.align_right
         )

        table.cell(dashTable, 0, 2, "Support", text_color=color.new(#8b949e, 0), text_size=size.normal, bgcolor=color.new(#0d1117, 10), text_halign=text.align_left)
        table.cell(dashTable, 1, 2,
             na(nearestSup) ? "—" : str.tostring(nearestSup, format.mintick),
             text_color  = na(nearestSup) ? color.new(#484f58, 0) : supColor,
             text_size   = size.normal,
             bgcolor     = color.new(#0d1117, 10),
             text_halign = text.align_right
         )

        table.cell(dashTable, 0, 3, "Last Break", text_color=color.new(#8b949e, 0), text_size=size.normal, bgcolor=color.new(#0d1117, 10), text_halign=text.align_left)
        breakDirColor = lastBreakDir == "Bullish" ? supColor : lastBreakDir == "Bearish" ? resColor : color.new(#484f58, 0)
        table.cell(dashTable, 1, 3, lastBreakDir, text_color=breakDirColor, text_size=size.normal, bgcolor=color.new(#0d1117, 10), text_halign=text.align_right)

        activeCnt = array.size(activeLevels)
        table.cell(dashTable, 0, 4, "Active Levels", text_color=color.new(#8b949e, 0), text_size=size.normal, bgcolor=color.new(#0d1117, 10), text_halign=text.align_left)
        table.cell(dashTable, 1, 4, str.tostring(activeCnt), text_color=color.new(#f0f6fc, 0), text_size=size.normal, bgcolor=color.new(#0d1117, 10), text_halign=text.align_right)

// }
Indicator Insider

27/01/026 Spring & Upthrust Trap
Backtest analysis of Spring & Upthrust Trap strategy: 34.9% win rate, +4.95% profit, 2.021 profit factor. Complete guide to optimal settings and risk management.

Smart Money Concepts Pro – OB, FVG, Liquidity + Trade Setups
The indicator follows Smart Money Concepts (SMC): price moves because of supply–demand imbalances and the hunt for liquidity. From there, we focus on four key pillars:
Order Block (OB): institutional order zones; price often retests them before continuing.
Fair Value Gap (FVG): a 3-candle void showing imbalance; price tends

Elliot Wave Pattern Indicator Analysis
This indicator is based on Elliott Wave Theory—one of the most well-known principles in technical analysis—which posits that markets move in repeatable, predictable wave patterns.