📊 Vùng Hỗ Trợ & Kháng Cự Thích Nghi [BigBeluga]
Phân Tích Chỉ Báo · Phiên Bản Tiếng Việt · PineScript v6
1.1 Khái Niệm Cốt Lõi
Chỉ báo tự động xác định và vẽ các vùng hỗ trợ & kháng cự thích nghi dựa trên các điểm pivot xác nhận. Không giống các đường S/R cố định, mỗi mức được tính theo ATR (Average True Range) để thích nghi với biến động thực tế của từng cặp giao dịch và khung thời gian — đảm bảo tính nhất quán trên mọi thị trường.
Mỗi mức S/R được lưu trữ qua kiểu dữ liệu tùy chỉnh (SRLevel) bao gồm giá, trạng thái sống/phá vỡ/kiểm tra lại, và các đối tượng đồ họa (đường kẻ, vùng box, nhãn giá). Khi giá phá vỡ một mức, đường kẻ chuyển sang màu xám đứt nét và xuất hiện nhãn "Break" để đánh dấu sự kiện.
1.2 Tính Năng Chính
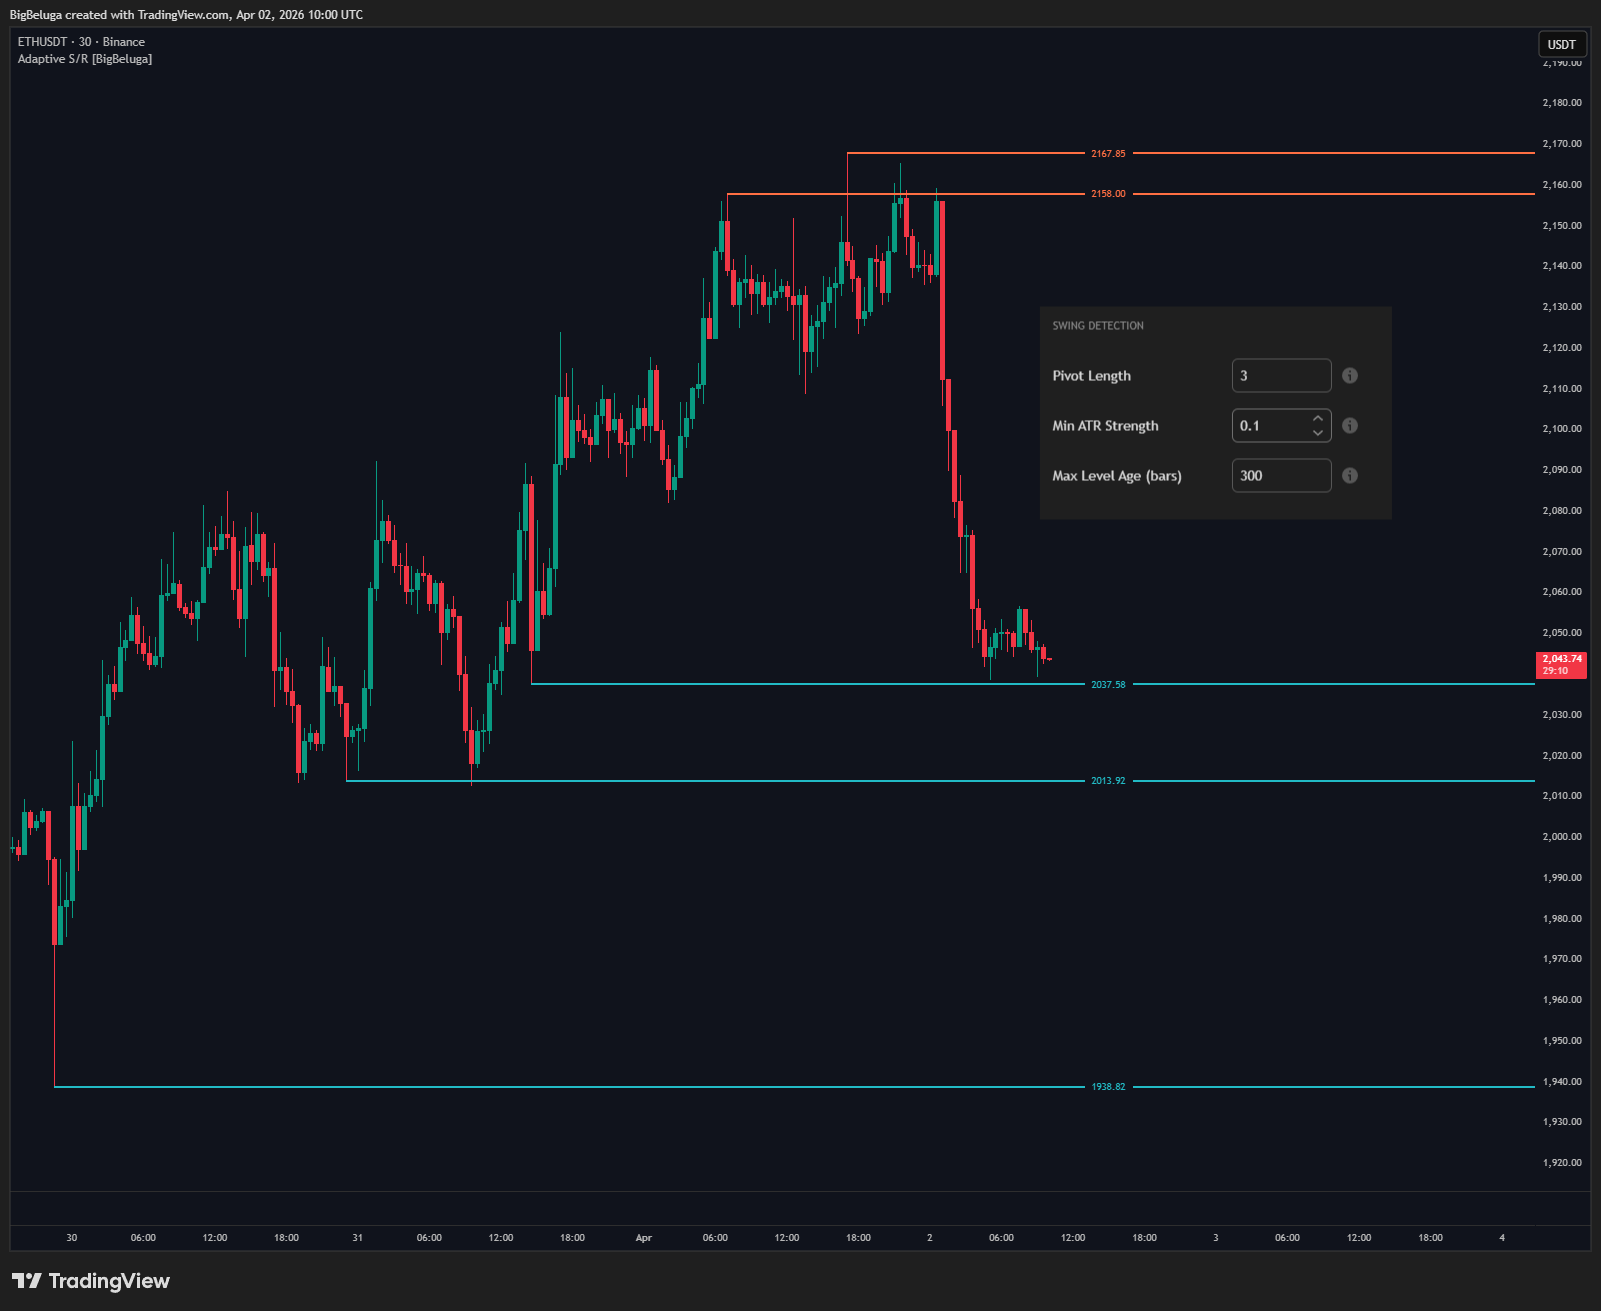
- 🔍 Phát hiện pivot tự động — dùng ta.pivothigh / ta.pivotlow với độ trễ xác nhận pivotLen nến
- 💪 Lọc độ mạnh pivot — loại bỏ pivot yếu: đỉnh/đáy phải vượt các nến lân cận tối thiểu minStrength × ATR
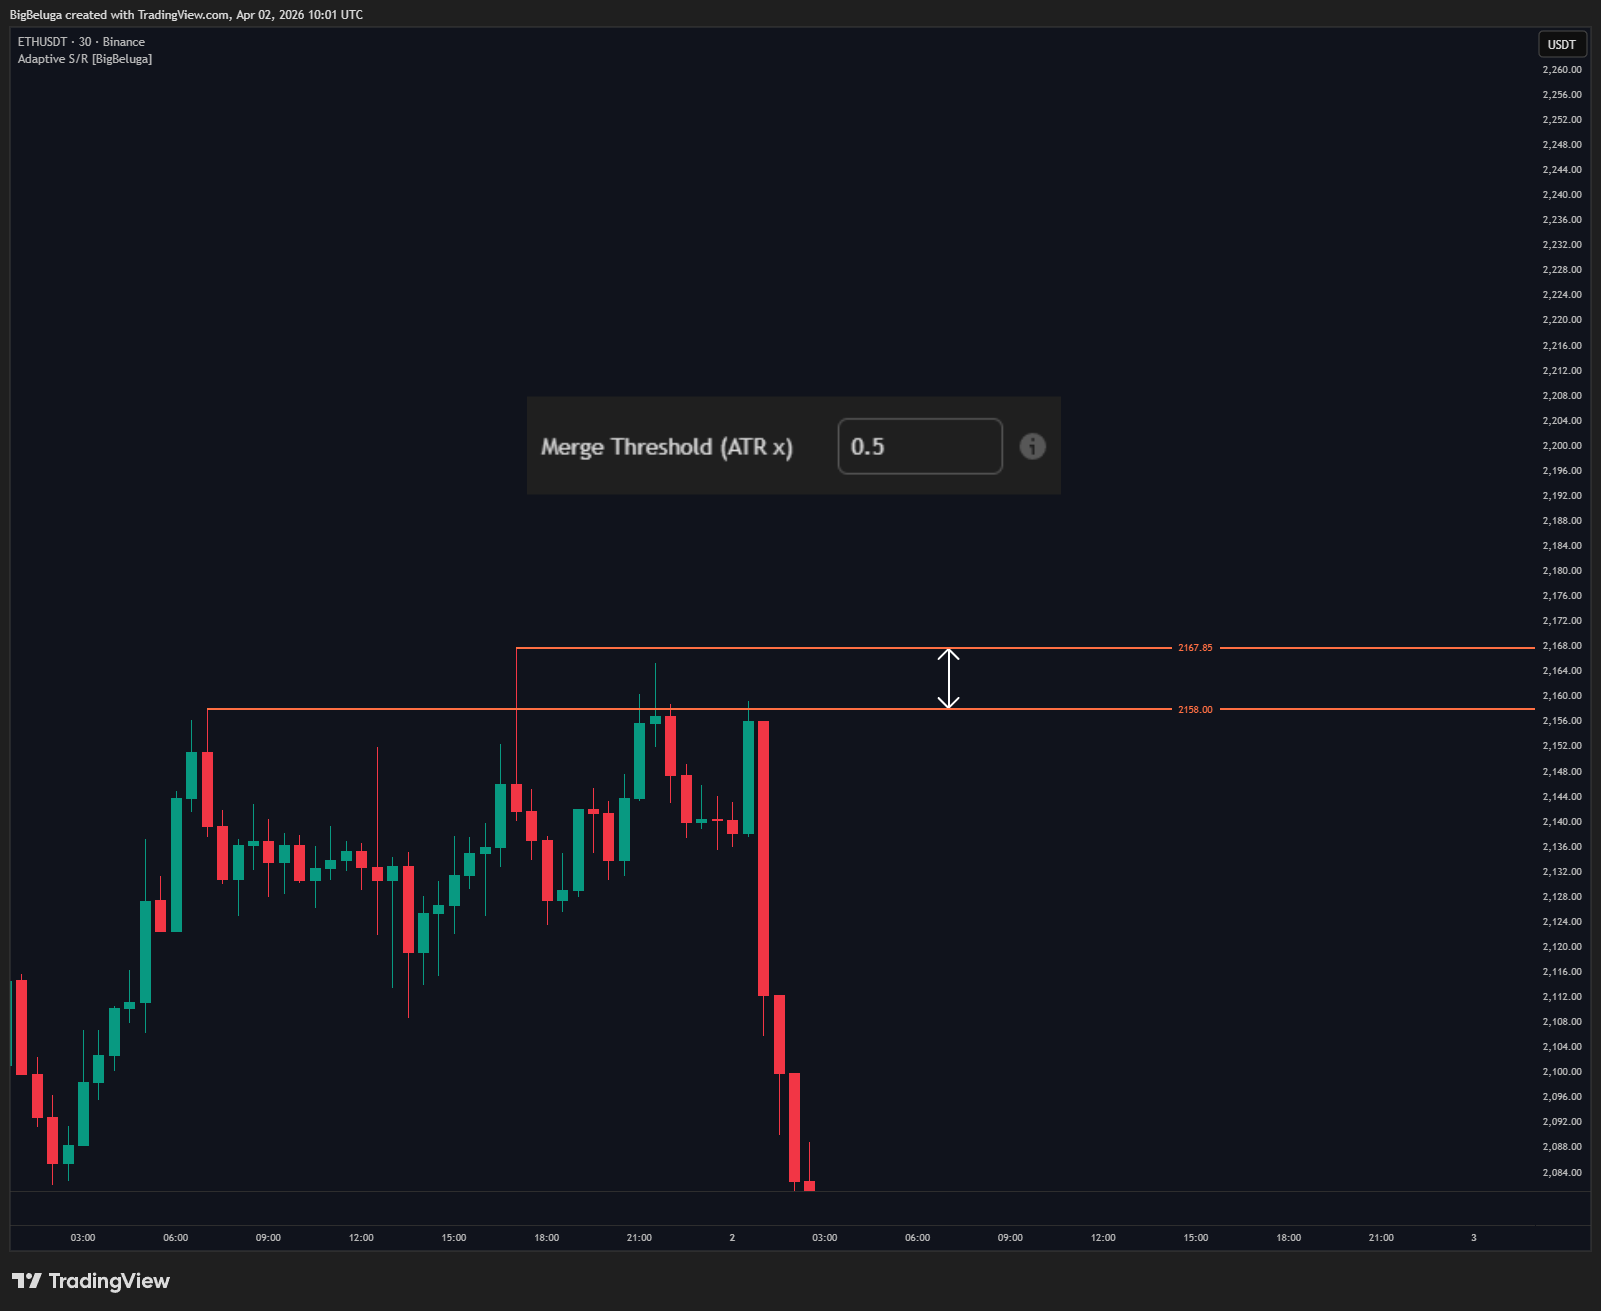
- 🔗 Gộp mức gần nhau — bỏ qua pivot mới nếu đã tồn tại mức trong phạm vi mergeThresh × ATR
- 📏 Giới hạn số lượng mức — tối đa maxLevels mức hoạt động; mức cũ nhất tự động xóa khi vượt giới hạn
- ⏳ Xóa theo tuổi — mức tồn tại quá maxAgeBars nến tự động bị xóa
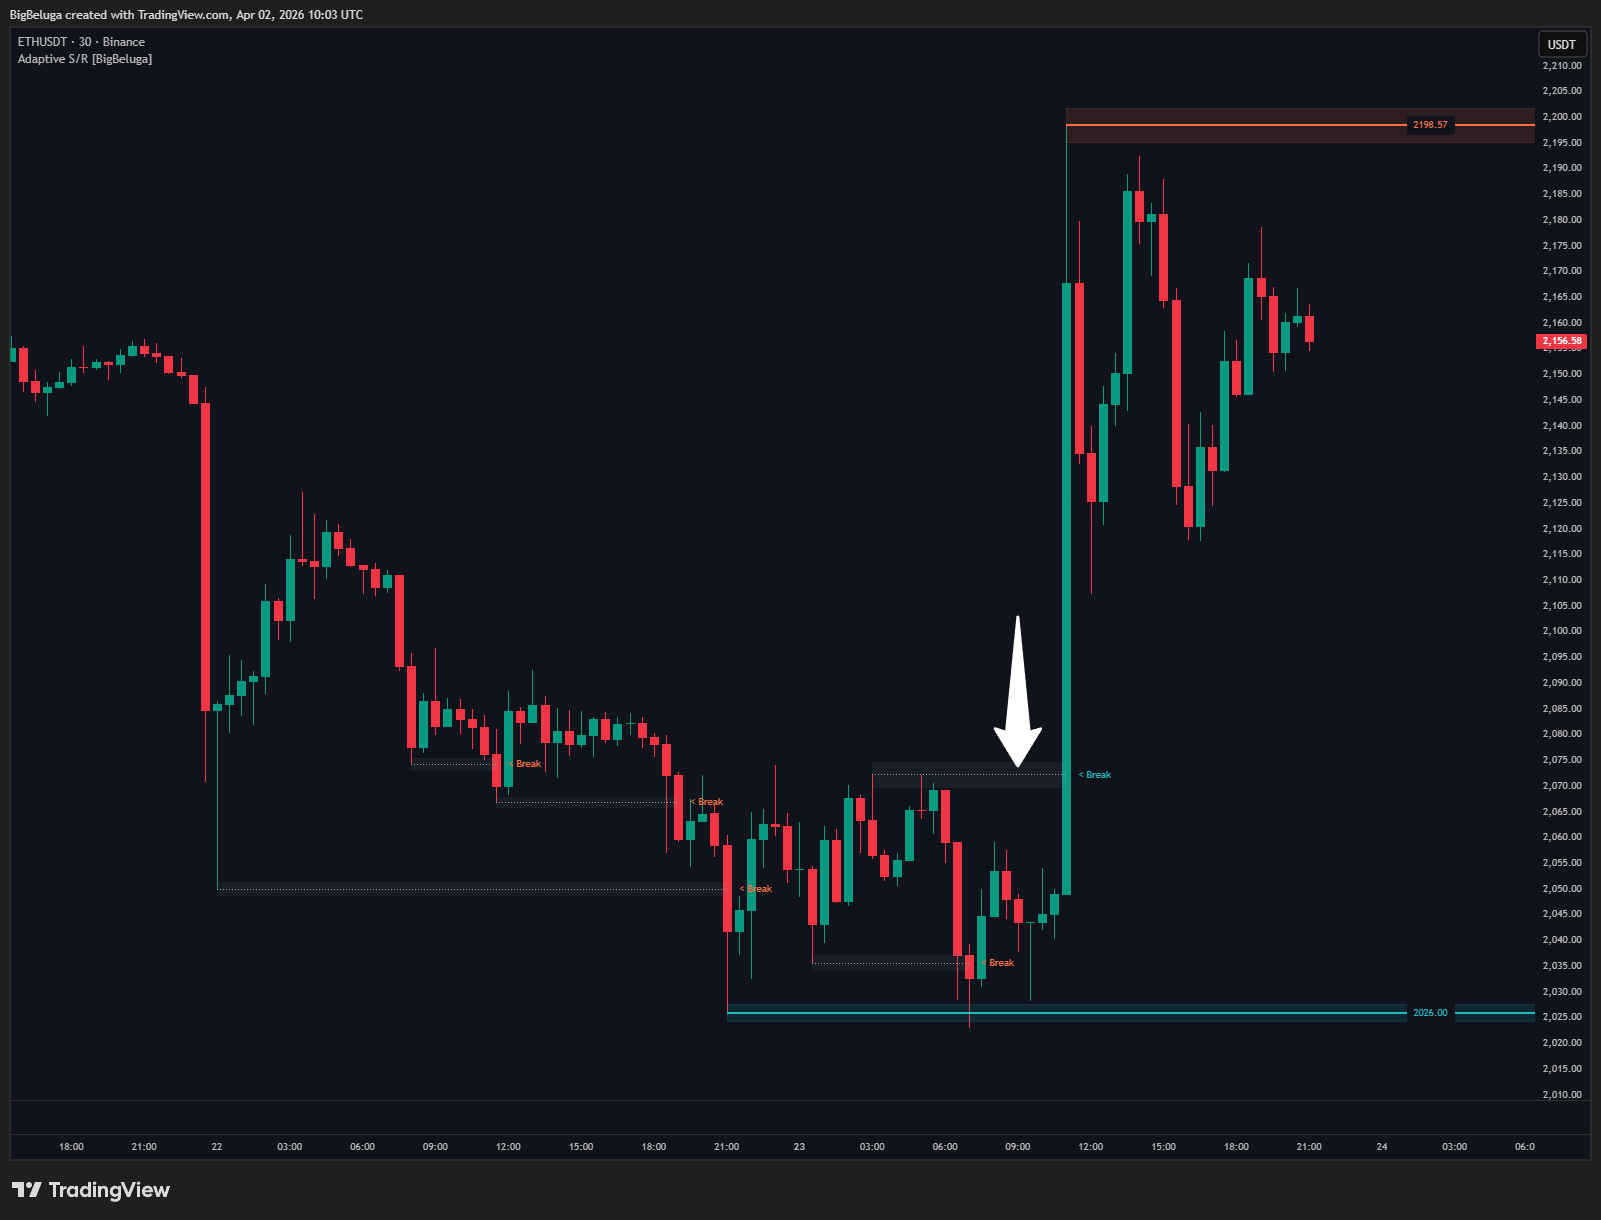
- 💥 Phát hiện phá vỡ — khi giá đóng cửa vượt mức ± breakSens × ATR, đường kẻ chuyển xám đứt nét, box thu hẹp, nhãn "Break" xuất hiện
- 📐 Độ dày tăng theo tuổi — đường kẻ dày hơn khi mức càng lâu chưa bị phá: calcWidth = min(maxLineWidth, 1 + floor((age/maxAgeBars) × (maxLineWidth−1)))
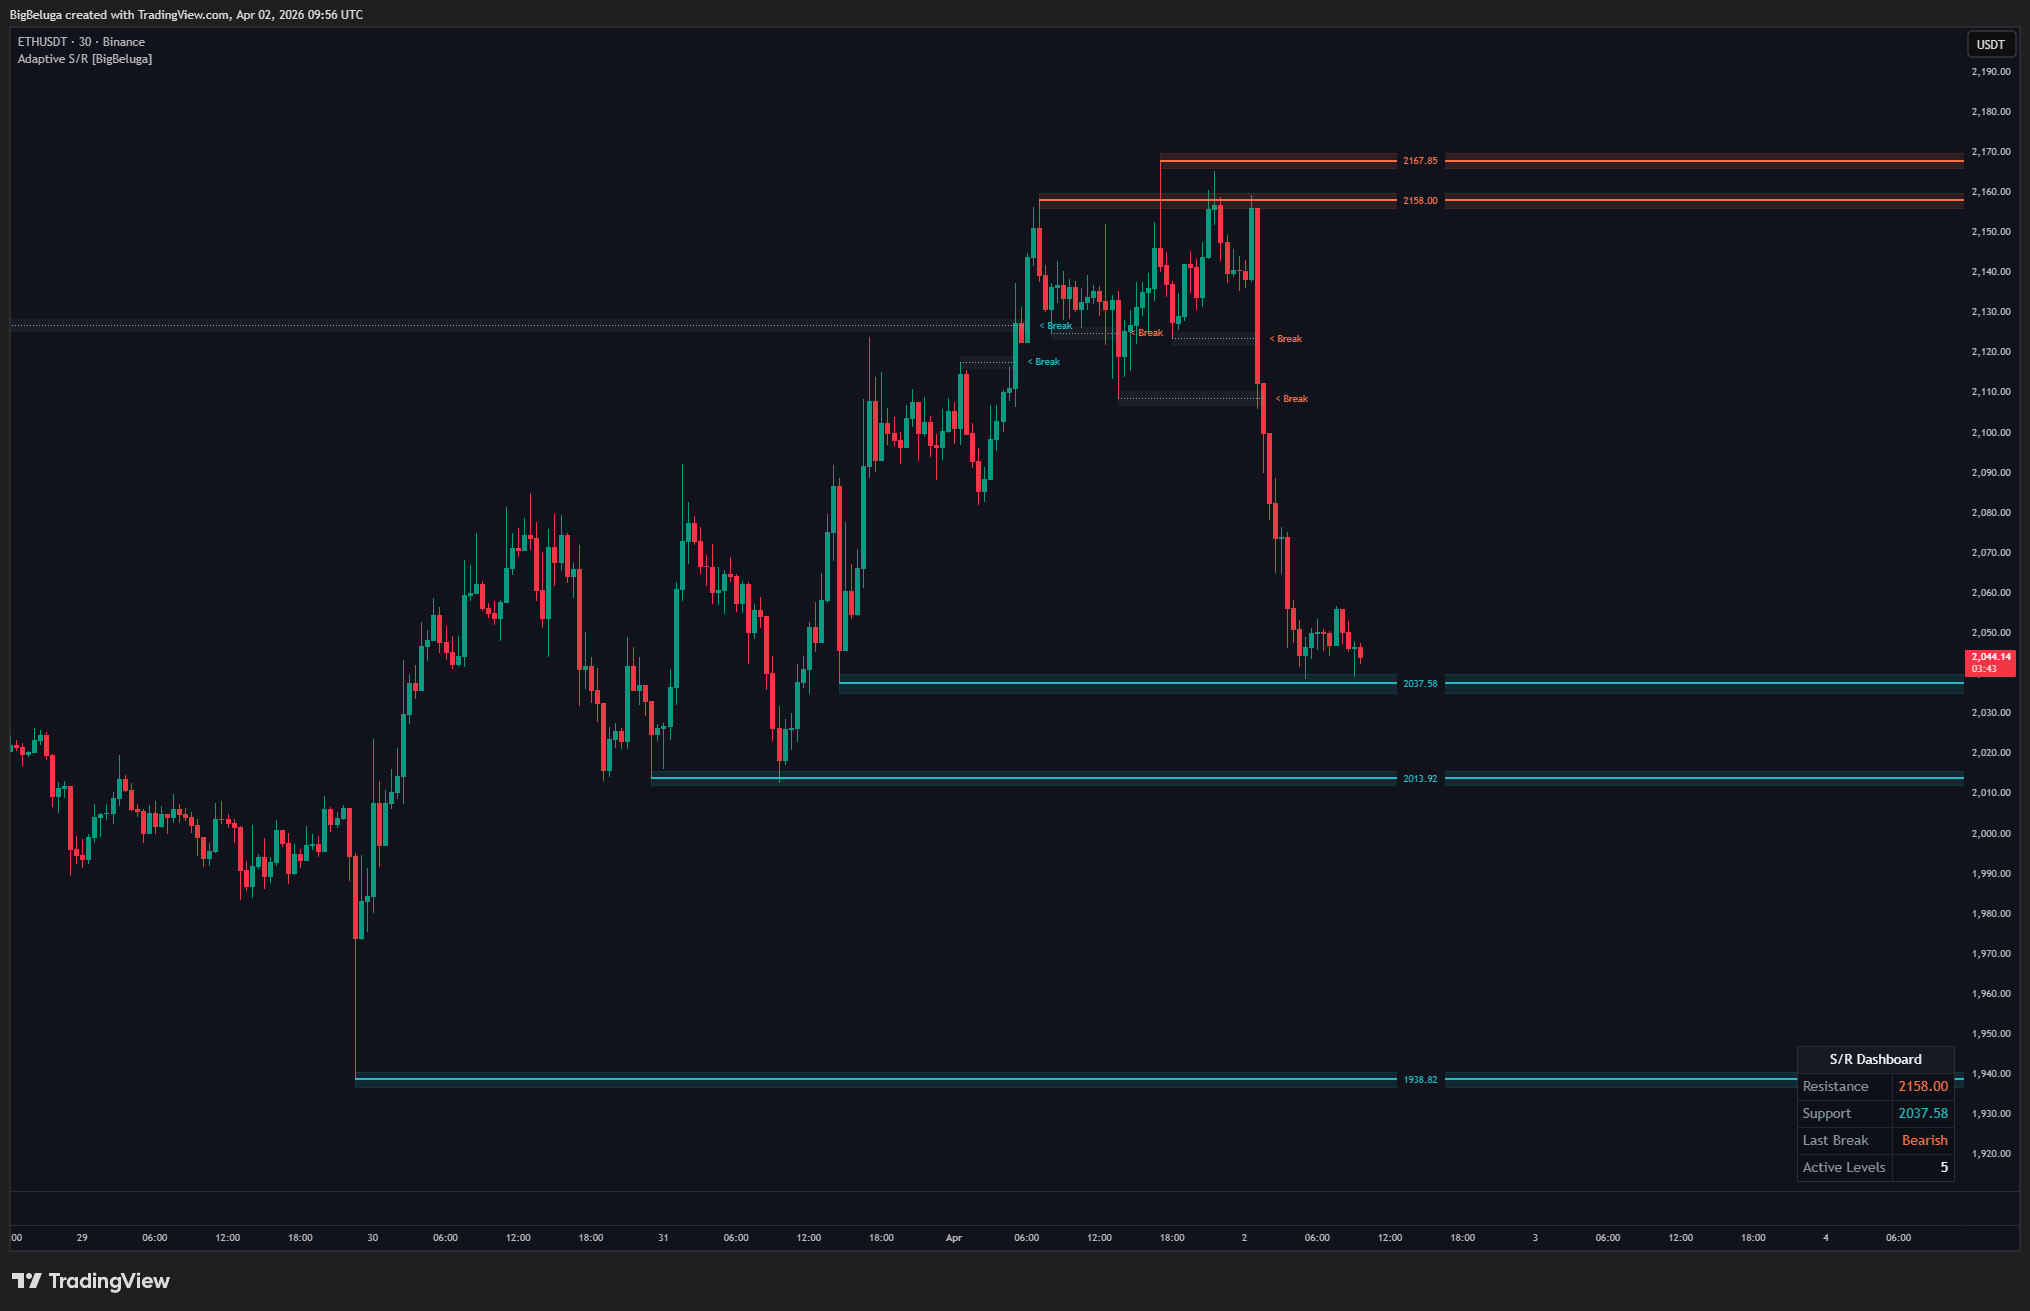
- 📊 Bảng thông tin — hiển thị giá S/R gần nhất, hướng phá vỡ cuối, số mức đang hoạt động
- 🚨 Cảnh báo — 2 điều kiện cảnh báo: kháng cự bị phá và hỗ trợ bị phá
1.3 Hướng Dẫn Sử Dụng
⚙️ Các Tham Số Đầu Vào| Tham Số | Mặc Định | Ý Nghĩa |
|---|---|---|
| pivotLen | 10 | Số nến hai bên để xác nhận pivot (độ trễ = pivotLen nến) |
| minStrength | 0.5 | Bội số ATR tối thiểu để pivot được coi là mạnh |
| mergeThresh | 0.3 | Bội số ATR — gộp hai mức nếu khoảng cách nhỏ hơn ngưỡng này |
| maxLevels | 10 | Số mức S/R hoạt động tối đa trên biểu đồ |
| maxAgeBars | 500 | Số nến tối đa mức được giữ trước khi tự xóa |
| breakSens | 0.1 | Bội số ATR xác định phá vỡ thực sự (lọc nhiễu) |
| maxLineWidth | 4 | Độ dày tối đa của đường kẻ mức S/R |
| atrLen | 14 | Chu kỳ tính ATR (RMA) |
| showDash | true | Hiện/ẩn bảng thông tin góc trên phải |
| resistCol | đỏ | Màu đường kháng cự |
| supportCol | xanh lá | Màu đường hỗ trợ |
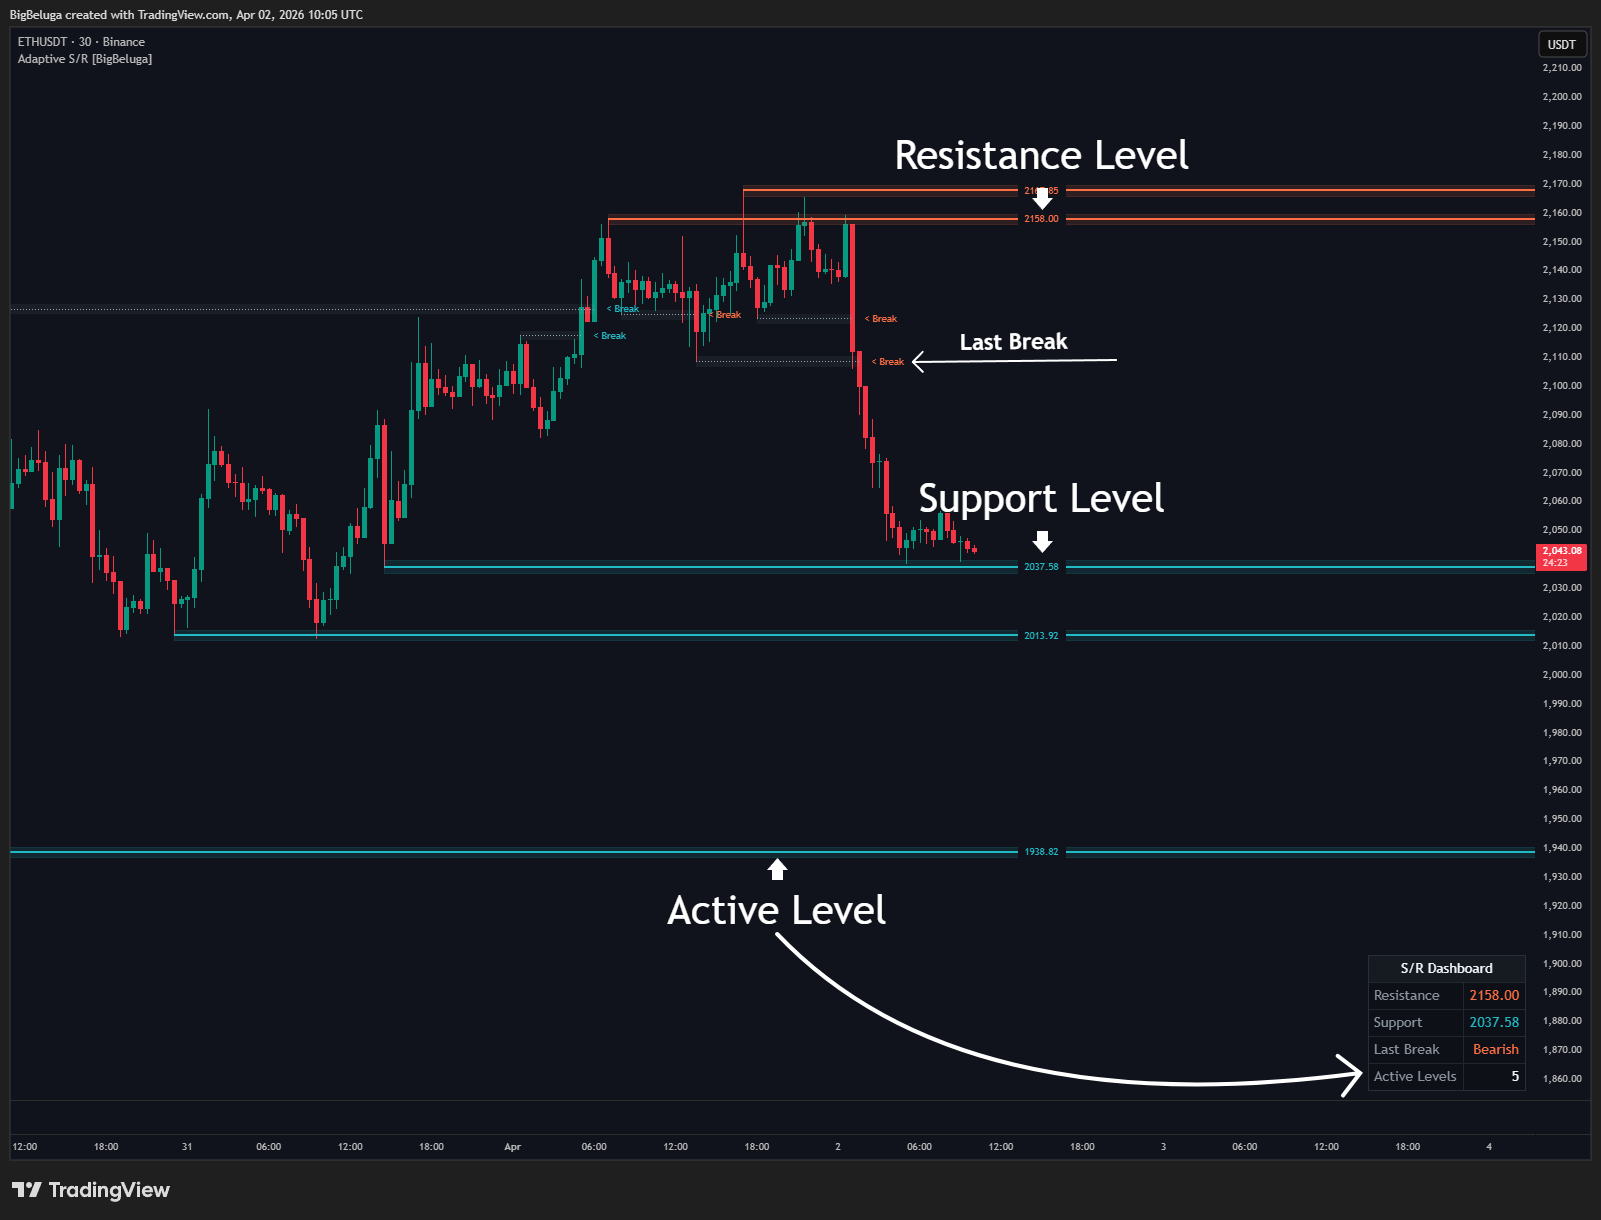
- Đường đỏ liền = Kháng cự đang hoạt động — kỳ vọng giá bật xuống
- Đường xanh liền = Hỗ trợ đang hoạt động — kỳ vọng giá bật lên
- Đường xám đứt nét + nhãn "Break" = Mức vừa bị phá vỡ
- Đường càng dày = Mức tồn tại càng lâu → độ tin cậy cao hơn
- Vùng box mờ = Trực quan hóa vùng giá quanh mức S/R
- Kết hợp với chỉ báo động lượng (RSI, MACD) để xác nhận tín hiệu tại vùng S/R
- Tăng minStrength trên thị trường sideway để lọc bỏ pivot nhiễu
- Giảm pivotLen (ví dụ: 5) trên khung thời gian ngắn để phản ứng nhanh hơn
- Dùng bảng thông tin để nhanh chóng xác định khoảng hỗ trợ/kháng cự gần nhất
- Cài cảnh báo breakout để không bỏ lỡ các phá vỡ quan trọng
1.4 Nguyên Lý Hoạt Động (Từ Đầu Ra Đến Đầu Vào)
🖥️ Đầu Ra — Những Gì Hiển Thị Trên Biểu Đồ- Đường kẻ ngang màu đỏ/xanh (liền hoặc đứt nét khi phá vỡ)
- Vùng box mờ bao quanh mức giá
- Nhãn giá tại đầu mỗi đường kẻ
- Nhãn "Break" khi phá vỡ được xác nhận
- Bảng thông tin góc trên phải (nếu showDash = true)
Khi mức S/R càng lâu chưa bị phá, đường kẻ càng dày — phản ánh tính bền vững:
age = bar_index − level.barStart
calcWidth = min(maxLineWidth, 1 + floor((age / maxAgeBars) × (maxLineWidth − 1)))
Ví dụ: maxLineWidth = 4, mức đã qua 50% tuổi thọ → calcWidth = min(4, 1 + floor(0.5 × 3)) = min(4, 2) = 2. Mức mới có width = 1, mức già có width = 4.
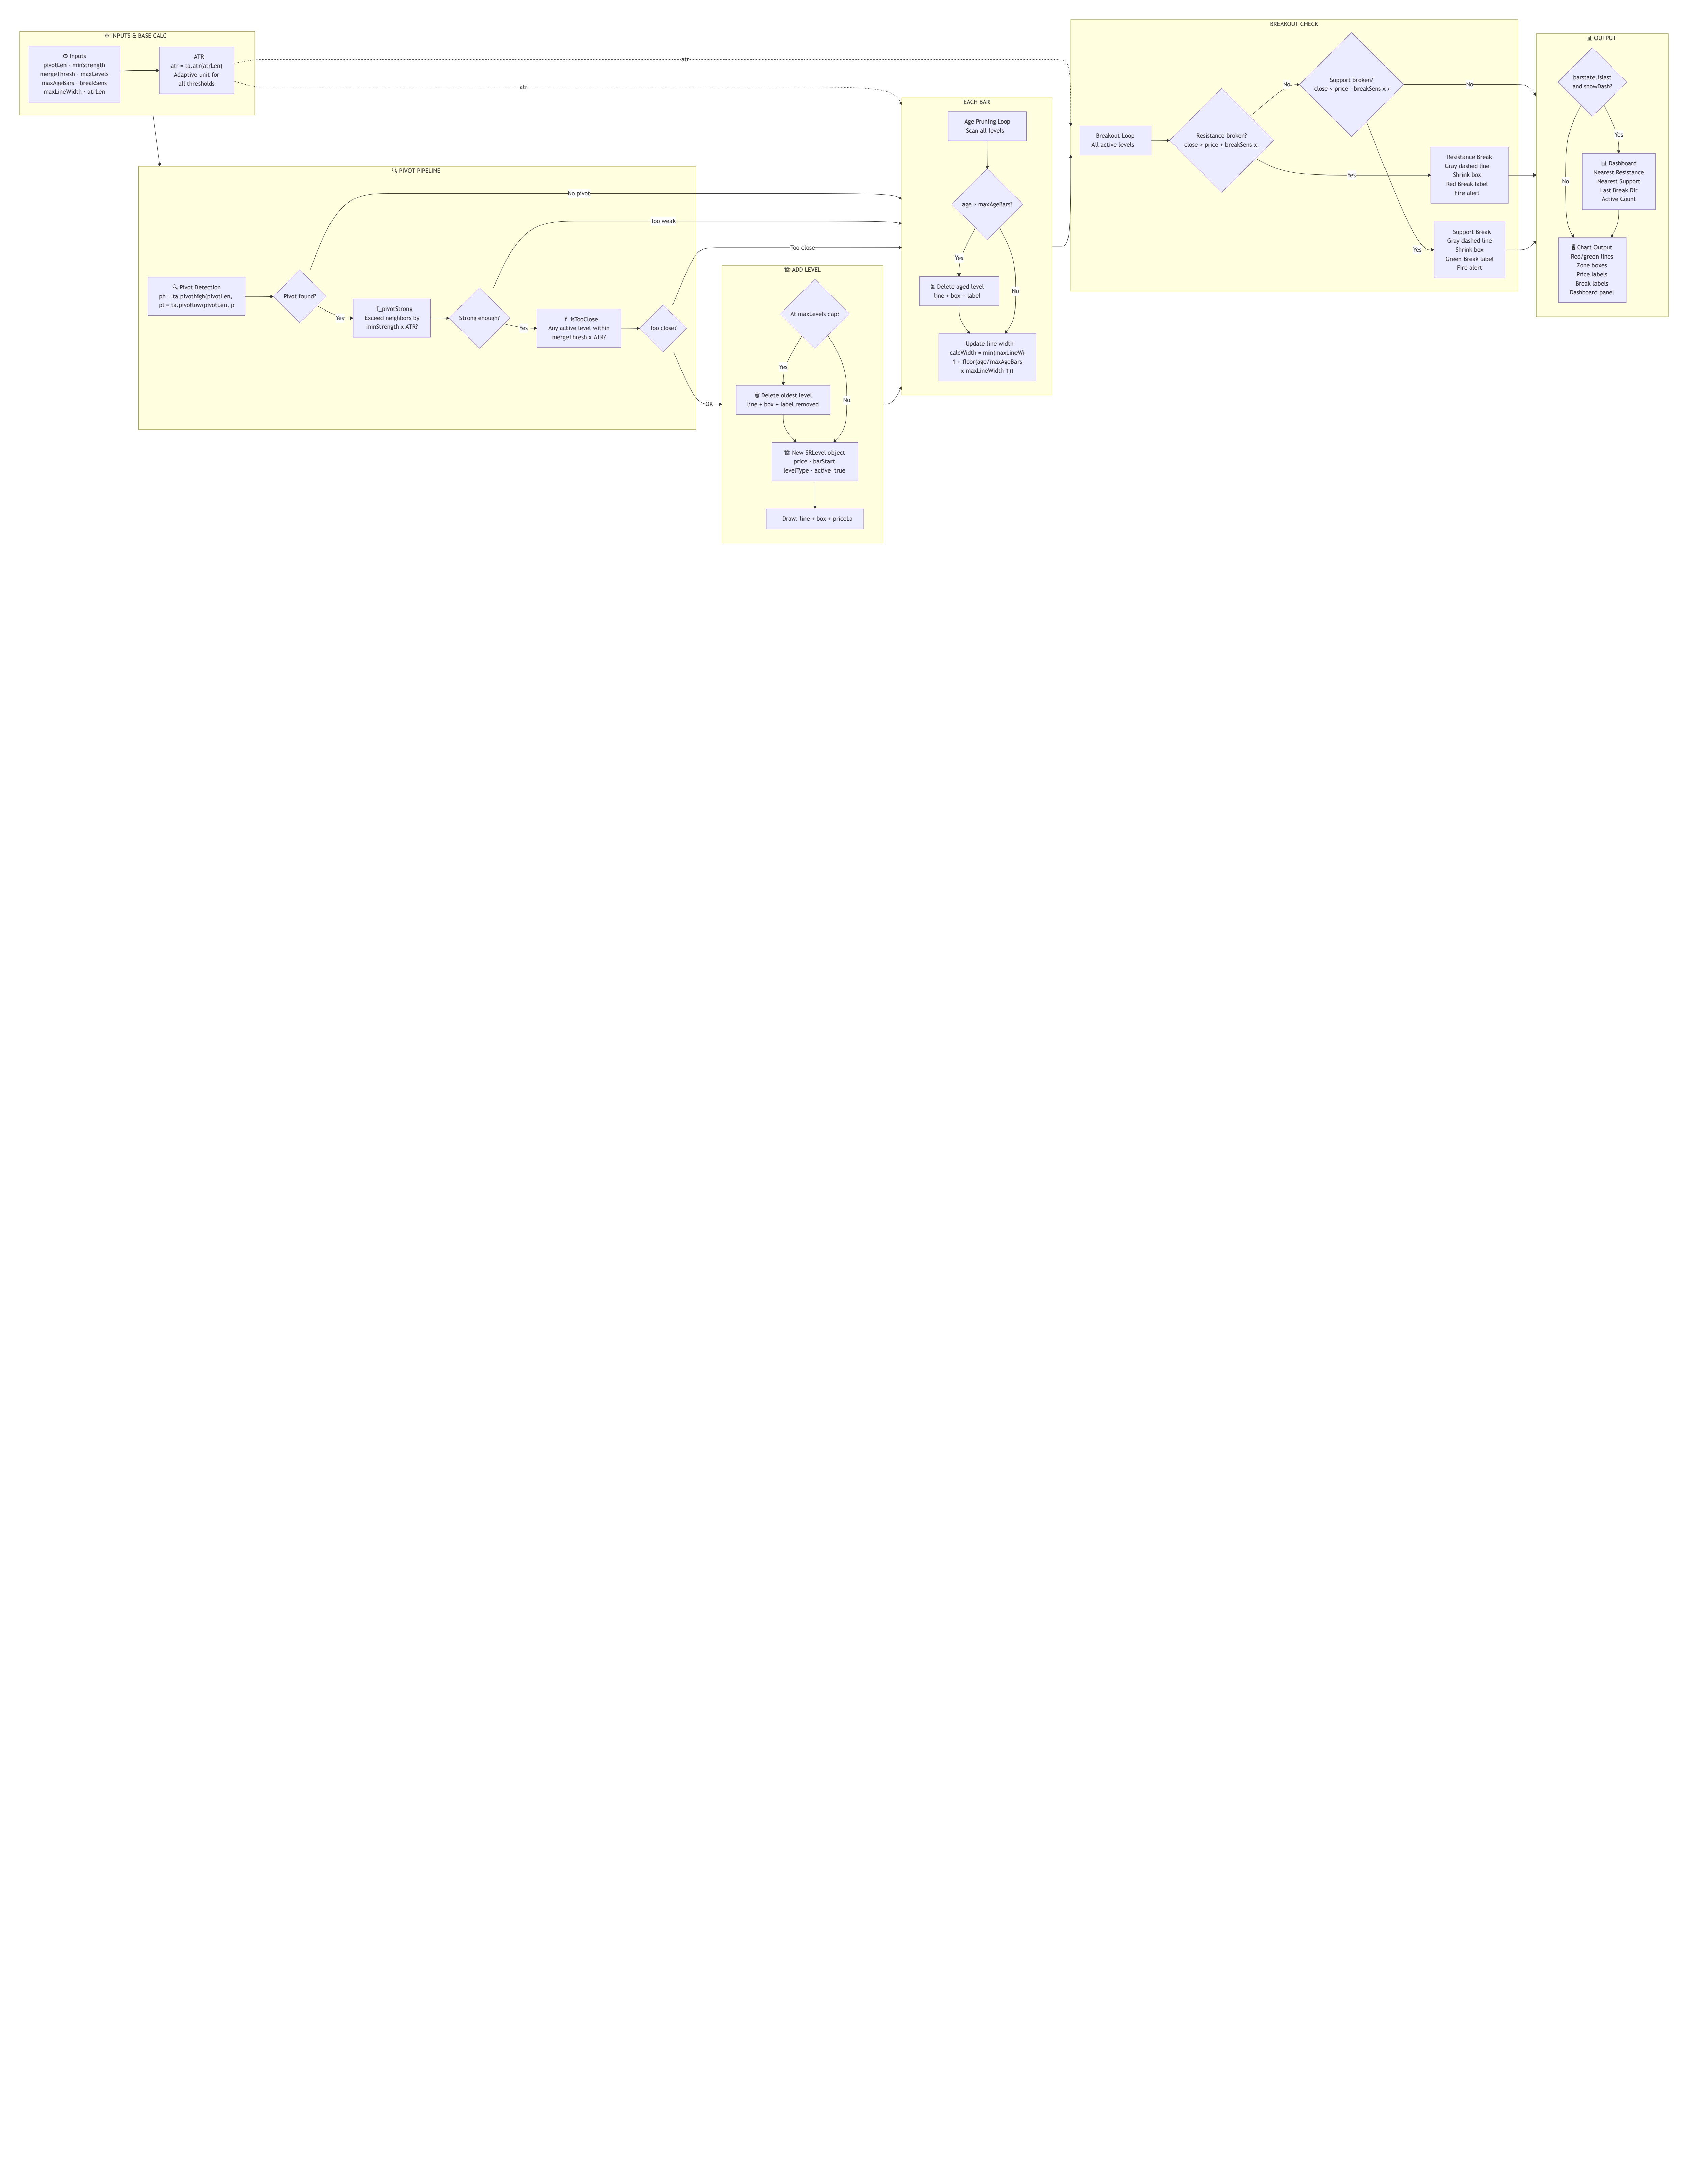
💥 Tầng 6 — Phát Hiện Phá VỡMỗi nến kiểm tra tất cả mức đang hoạt động:
- Kháng cự bị phá: close > level.price + breakSens × ATR
- Hỗ trợ bị phá: close < level.price − breakSens × ATR
Khi phá vỡ: đường kẻ → xám đứt nét, box thu hẹp, nhãn "Break" (đỏ/xanh) xuất hiện, level.broken = true, cảnh báo kích hoạt. Mức phá vỡ không bị xóa ngay — vẫn hiển thị như tham chiếu lịch sử.
⏳ Tầng 5 — Xóa Tự Động Theo TuổiTrước khi kiểm tra breakout, hệ thống quét toàn bộ mảng mức S/R:
if (bar_index − level.barStart) > maxAgeBars → xóa đường/box/nhãn, xóa khỏi mảng
Cơ chế này giữ biểu đồ gọn gàng và tránh tích tụ quá nhiều mức cũ. Chạy từ cuối mảng về đầu để tránh lỗi chỉ số khi xóa phần tử.
🏗️ Tầng 4 — Tạo Mức S/R MớiKhi pivot hợp lệ được xác nhận (đủ mạnh + không gần mức hiện có), hàm f_addLevel() được gọi:
- Nếu đã đủ maxLevels mức → xóa mức cũ nhất trước
- Tạo đối tượng SRLevel mới với: giá pivot, barStart = bar_index − pivotLen, loại (kháng cự/hỗ trợ)
- Vẽ đường ngang từ barStart đến bar_index + 50 (tương lai)
- Vẽ box bao quanh mức giá (chiều cao = 0.1 × ATR)
- Thêm nhãn giá tại điểm bắt đầu đường kẻ
Hàm f_isTooClose(price) quét toàn bộ mảng mức hiện có:
if math.abs(existingLevel.price − price) < mergeThresh × ATR → return true (quá gần, bỏ qua)
Mục đích: tránh tạo nhiều mức chồng lên nhau tại cùng vùng giá. Nếu không quá gần, hệ thống tiếp tục thêm mức mới.
💪 Tầng 2 — Lọc Độ Mạnh PivotHàm f_pivotStrong(pivotPrice, isHigh) kiểm tra pivot có thực sự nổi bật so với các nến lân cận:
- Pivot đỉnh: pivotPrice − max(high[i] for i in 1..pivotLen) > minStrength × ATR
- Pivot đáy: min(low[i] for i in 1..pivotLen) − pivotPrice > minStrength × ATR
Pivot yếu (không đủ minStrength × ATR so với các nến xung quanh) bị loại bỏ — không tạo mức S/R mới. Giá trị ATR tại thời điểm pivot được dùng để đảm bảo tính thích nghi.
🔍 Tầng 1 — Phát Hiện Pivot (Đầu Vào Gốc)Mỗi nến, hệ thống gọi:
ph = ta.pivothigh(pivotLen, pivotLen) — trả về giá đỉnh nếu nến pivotLen nến trước là đỉnh cục bộ
pl = ta.pivotlow(pivotLen, pivotLen) — trả về giá đáy nếu nến pivotLen nến trước là đáy cục bộ
Lưu ý quan trọng: pivot xác nhận tại bar_index − pivotLen (trễ pivotLen nến so với thời điểm thực), nên vị trí vẽ đường kẻ được hiệu chỉnh về thời điểm thực sự hình thành pivot.
ATR được tính: atr = ta.atr(atrLen) (RMA 14 nến mặc định) và được dùng làm đơn vị chuẩn cho tất cả ngưỡng tính toán.
📊 Bảng Thông Tin (Dashboard)Vẽ tại barstate.islast để không ảnh hưởng hiệu suất:
| Thông Tin | Cách Tính |
|---|---|
| Kháng cự gần nhất | Mức kháng cự hoạt động có giá thấp nhất phía trên close |
| Hỗ trợ gần nhất | Mức hỗ trợ hoạt động có giá cao nhất phía dưới close |
| Hướng phá vỡ cuối | Loại mức bị phá vỡ gần nhất (Kháng Cự / Hỗ Trợ) |
| Số mức hoạt động | Tổng phần tử trong mảng srLevels chưa bị phá vỡ |
| Cảnh Báo | Điều Kiện Kích Hoạt |
|---|---|
| Kháng cự bị phá | close > resistLevel.price + breakSens × ATR (nến đóng cửa trên mức kháng cự + đệm) |
| Hỗ trợ bị phá | close < supportLevel.price − breakSens × ATR (nến đóng cửa dưới mức hỗ trợ − đệm) |

// This work is licensed under Creative Commons Attribution-NonCommercial-ShareAlike 4.0 International
// https://creativecommons.org/licenses/by-nc-sa/4.0/
// © BigBeluga
//@version=6
indicator("Vùng Hỗ Trợ & Kháng Cự Thích Ứng [BigBeluga]", shorttitle="Adaptive S/R [BigBeluga]", overlay=true, max_lines_count=500, max_labels_count=200, max_boxes_count=200)
// INPUTS ――――――――――――――――――――――――――――――――――――――――――――――――――――――――――――――――――――――――――――――――――――――――――――――――――――――――{
var grpSwing = "Phát Hiện Swing"
pivotLen = input.int(
5,
"Độ Dài Pivot",
minval=2,
maxval=50,
group=grpSwing,
tooltip="Số nến ở mỗi bên của đỉnh hoặc đáy để xác nhận pivot."
)
minStrength = input.float(
0.1,
"Độ Mạnh ATR Tối Thiểu",
minval=0.0,
maxval=5.0,
step=0.05,
group=grpSwing,
tooltip="Khoảng cách tối thiểu giữa pivot và các nến lân cận."
)
maxAgeBars = input.int(
300,
"Tuổi Thọ Tối Đa Của Mức (nến)",
minval=20,
maxval=2000,
group=grpSwing,
tooltip="Số nến tối đa một mức tồn tại trước khi bị xóa. Đồng thời dùng để tính độ dày theo thời gian."
)
var grpLevels = "Các Mức Giá"
showSupport = input.bool(
true,
"Hiển Thị Hỗ Trợ",
group=grpLevels
)
showResist = input.bool(
true,
"Hiển Thị Kháng Cự",
group=grpLevels
)
maxLevels = input.int(
5,
"Số Mức Hoạt Động Tối Đa",
minval=1,
maxval=20,
group=grpLevels
)
mergeThresh = input.float(
0.5,
"Ngưỡng Gộp (ATR x)",
minval=0.0,
maxval=3.0,
step=0.05,
group=grpLevels
)
showZones = input.bool(
true,
"Hiển Thị Vùng Giá",
group=grpLevels
)
zoneWidth = input.float(
0.25,
"Độ Rộng Vùng (ATR x)",
minval=0.05,
maxval=2.0,
step=0.05,
group=grpLevels
)
var grpBreak = "Breakout"
showBroken = input.bool(
true,
"Hiển Thị Mức Đã Phá Vỡ",
group=grpBreak
)
breakSens = input.float(
0.1,
"Độ Nhạy Breakout (ATR x)",
minval=0.0,
maxval=2.0,
step=0.05,
group=grpBreak
)
showBreakLbl = input.bool(
true,
"Hiển Thị Nhãn Break",
group=grpBreak
)
maxBroken = input.int(
4,
"Số Mức Break Tối Đa",
minval=0,
maxval=20,
group=grpBreak
)
var grpVis = "Hiển Thị"
supColor = input.color(
color.new(#22bac5, 0),
"Màu Hỗ Trợ",
group=grpVis
)
resColor = input.color(
color.new(#ff6f43, 0),
"Màu Kháng Cự",
group=grpVis
)
brokenColor = input.color(
color.new(#94a3b8, 0),
"Màu Mức Đã Phá",
group=grpVis
)
lineWidth = input.int(
2,
"Độ Dày Cơ Bản",
minval=1,
maxval=5,
group=grpVis,
tooltip="Dùng khi tắt chế độ độ dày theo thời gian."
)
// LONGEVITY INPUTS
useDynamicWidth = input.bool(
true,
"Bật Độ Dày Theo Thời Gian",
group=grpVis,
tooltip="Khi bật, mức càng cũ sẽ càng dày."
)
maxLineWidth = input.int(
7,
"Độ Dày Tối Đa",
minval=1,
maxval=10,
group=grpVis,
tooltip="Độ dày tối đa mà một mức cũ có thể đạt được."
)
showDash = input.bool(
true,
"Hiển Thị Dashboard",
group=grpVis
)
showPriceLbl = input.bool(
true,
"Hiển Thị Nhãn Giá",
group=grpVis
)
var grpDash = "Dashboard"
dashPos = input.string(
"Bottom Right",
"Vị Trí Dashboard",
options=["Top Right","Bottom Right","Top Left","Bottom Left"],
group=grpDash
)
// }
// CALCULATIONS ―――――――――――――――――――――――――――――――――――――――――――――――――――――――――――――――――――――――――――――――――――――――――――――――{
type SRLevel
float price
int barStart
int levelType
bool active
bool broken
int breakBar
bool retested
line mainLine
box zoneBox
label breakLabel
label priceLabel
var array<SRLevel> activeLevels = array.new<SRLevel>()
var array<SRLevel> brokenLevels = array.new<SRLevel>()
var string lastBreakDir = "—"
var int lastBreakBar = na
atrVal = ta.atr(14)
atrSafe = na(atrVal) or atrVal == 0 ? syminfo.mintick * 10 : atrVal
ph = ta.pivothigh(high, pivotLen, pivotLen)
pl = ta.pivotlow(low, pivotLen, pivotLen)
// Kiểm tra mức quá gần
f_isTooClose(_price, _type) =>
bool tooClose = false
int sz = array.size(activeLevels)
if sz > 0
for i = 0 to sz - 1
lvl = array.get(activeLevels, i)
if lvl.levelType == _type and lvl.active
if math.abs(lvl.price - _price) < mergeThresh * atrSafe
tooClose := true
break
tooClose
// Thêm mức mới
f_addLevel(_price, _type, _barIdx) =>
if not f_isTooClose(_price, _type)
int sz = array.size(activeLevels)
int cnt = 0
if sz > 0
for i = 0 to sz - 1
lvl = array.get(activeLevels, i)
if lvl.levelType == _type and lvl.active
cnt += 1
if cnt < maxLevels
_baseColor = _type == 1 ? resColor : supColor
_zoneTop = _price + zoneWidth * atrSafe * 0.5
_zoneBot = _price - zoneWidth * atrSafe * 0.5
newLine = line.new(
x1 = _barIdx,
y1 = _price,
x2 = _barIdx + 1,
y2 = _price,
extend = extend.right,
color = color.new(_baseColor, 0),
width = lineWidth,
style = line.style_solid
)
newBox = showZones ? box.new(
left = _barIdx,
top = _zoneTop,
right = _barIdx + 1,
bottom = _zoneBot,
border_color = color.new(_baseColor, 90),
bgcolor = color.new(_baseColor, 88),
extend = extend.right
) : na
newPriceLbl = showPriceLbl ? label.new(
x = bar_index + 20,
y = _price,
text = str.tostring(_price, format.mintick),
style = label.style_label_center,
textcolor = _baseColor,
color = color.new(chart.bg_color, 0),
size = size.small
) : na
array.push(
activeLevels,
SRLevel.new(
price = _price,
barStart = _barIdx,
levelType = _type,
active = true,
broken = false,
breakBar = na,
retested = false,
mainLine = newLine,
zoneBox = newBox,
breakLabel = na,
priceLabel = newPriceLbl
)
)
// Kiểm tra pivot mạnh
f_pivotStrong(_price, _type) =>
bool strong = true
if minStrength > 0
if _type == 1
nearHigh = math.max(high[pivotLen - 1], high[pivotLen + 1])
if (_price - nearHigh) < minStrength * atrSafe
strong := false
else
nearLow = math.min(low[pivotLen - 1], low[pivotLen + 1])
if (nearLow - _price) < minStrength * atrSafe
strong := false
strong
// Xóa mức quá cũ
int pruneSize = array.size(activeLevels)
if pruneSize > 0
for i = pruneSize - 1 to 0
if i < array.size(activeLevels)
lvl = array.get(activeLevels, i)
if lvl.active and (bar_index - lvl.barStart) > maxAgeBars
line.delete(lvl.mainLine)
if not na(lvl.zoneBox)
box.delete(lvl.zoneBox)
if not na(lvl.priceLabel)
label.delete(lvl.priceLabel)
array.remove(activeLevels, i)
// Thêm pivot mới
if not na(ph) and showResist
if f_pivotStrong(ph, 1)
f_addLevel(ph, 1, bar_index - pivotLen)
if not na(pl) and showSupport
if f_pivotStrong(pl, -1)
f_addLevel(pl, -1, bar_index - pivotLen)
// BREAKOUT LOGIC
int activeSize = array.size(activeLevels)
if activeSize > 0
for i = activeSize - 1 to 0
if i >= array.size(activeLevels)
continue
lvl = array.get(activeLevels, i)
if not lvl.active
continue
breakBuffer = breakSens * atrSafe
// Break kháng cự
if lvl.levelType == 1 and close > lvl.price + breakBuffer
lvl.active := false
lvl.broken := true
lvl.breakBar := bar_index
lastBreakDir := "Bullish"
lastBreakBar := bar_index
if not na(lvl.priceLabel)
label.delete(lvl.priceLabel)
lvl.priceLabel := na
line.set_color(lvl.mainLine, color.new(brokenColor, 0))
line.set_style(lvl.mainLine, line.style_dotted)
line.set_width(lvl.mainLine, 1)
line.set_extend(lvl.mainLine, extend.none)
line.set_x2(lvl.mainLine, bar_index)
if not na(lvl.zoneBox)
box.set_bgcolor(lvl.zoneBox, color.new(brokenColor, 93))
box.set_border_color(lvl.zoneBox, color.new(brokenColor, 100))
box.set_extend(lvl.zoneBox, extend.none)
box.set_right(lvl.zoneBox, bar_index)
mid = math.avg(
lvl.zoneBox.get_top(),
lvl.zoneBox.get_bottom()
)
lvl.zoneBox.set_top(mid + breakBuffer)
lvl.zoneBox.set_bottom(mid - breakBuffer)
if showBreakLbl
lvl.breakLabel := label.new(
x = bar_index,
y = lvl.price,
text = "< Break",
style = label.style_label_left,
textcolor = supColor,
color = color.new(#22c55e, 100),
size = size.small
)
if showBroken
array.push(brokenLevels, lvl)
if array.size(brokenLevels) > maxBroken and array.size(brokenLevels) > 0
old = array.shift(brokenLevels)
if not na(old.mainLine)
line.delete(old.mainLine)
if not na(old.zoneBox)
box.delete(old.zoneBox)
if not na(old.breakLabel)
label.delete(old.breakLabel)
else
line.delete(lvl.mainLine)
if not na(lvl.zoneBox)
box.delete(lvl.zoneBox)
array.remove(activeLevels, i)
// Break hỗ trợ
else if lvl.levelType == -1 and close < lvl.price - breakBuffer
lvl.active := false
lvl.broken := true
lvl.breakBar := bar_index
lastBreakDir := "Bearish"
lastBreakBar := bar_index
if not na(lvl.priceLabel)
label.delete(lvl.priceLabel)
lvl.priceLabel := na
line.set_color(lvl.mainLine, color.new(brokenColor, 0))
line.set_style(lvl.mainLine, line.style_dotted)
line.set_width(lvl.mainLine, 1)
line.set_extend(lvl.mainLine, extend.none)
line.set_x2(lvl.mainLine, bar_index)
if not na(lvl.zoneBox)
box.set_bgcolor(lvl.zoneBox, color.new(brokenColor, 93))
box.set_border_color(lvl.zoneBox, color.new(brokenColor, 100))
box.set_extend(lvl.zoneBox, extend.none)
box.set_right(lvl.zoneBox, bar_index)
mid = math.avg(
lvl.zoneBox.get_top(),
lvl.zoneBox.get_bottom()
)
lvl.zoneBox.set_top(mid + breakBuffer)
lvl.zoneBox.set_bottom(mid - breakBuffer)
if showBreakLbl
lvl.breakLabel := label.new(
x = bar_index,
y = lvl.price,
text = "< Break",
style = label.style_label_left,
textcolor = resColor,
color = color.new(#ef4444, 100),
size = size.small
)
if showBroken
array.push(brokenLevels, lvl)
if array.size(brokenLevels) > maxBroken and array.size(brokenLevels) > 0
old = array.shift(brokenLevels)
if not na(old.mainLine)
line.delete(old.mainLine)
if not na(old.zoneBox)
box.delete(old.zoneBox)
if not na(old.breakLabel)
label.delete(old.breakLabel)
else
line.delete(lvl.mainLine)
if not na(lvl.zoneBox)
box.delete(lvl.zoneBox)
array.remove(activeLevels, i)
// }
// PLOT ――――――――――――――――――――――――――――――――――――――――――――――――――――――――――――――――――――――――――――――――――――――――――――――――――――――――――――{
// Mở rộng hiển thị các mức đang hoạt động
int extSize = array.size(activeLevels)
if extSize > 0
for i = 0 to extSize - 1
lvl = array.get(activeLevels, i)
if lvl.active
// Độ dày động theo thời gian
if useDynamicWidth
age = bar_index - lvl.barStart
calcWidth = math.min(
maxLineWidth,
1 + math.floor(
(age / maxAgeBars) * (maxLineWidth - 1)
)
)
line.set_width(lvl.mainLine, int(calcWidth))
else
line.set_width(lvl.mainLine, lineWidth)
line.set_x2(lvl.mainLine, bar_index + 1)
if not na(lvl.zoneBox)
box.set_right(lvl.zoneBox, bar_index + 1)
if showPriceLbl and not na(lvl.priceLabel)
label.set_x(lvl.priceLabel, bar_index + 10)
var float nearestSup = na
var float nearestRes = na
nearestSup := na
nearestRes := na
// Quét dashboard
int dashScanSize = array.size(activeLevels)
if dashScanSize > 0
for i = 0 to dashScanSize - 1
lvl = array.get(activeLevels, i)
if not lvl.active
continue
if lvl.levelType == -1 and lvl.price < close
if na(nearestSup) or lvl.price > nearestSup
nearestSup := lvl.price
if lvl.levelType == 1 and lvl.price > close
if na(nearestRes) or lvl.price < nearestRes
nearestRes := lvl.price
// Vẽ Dashboard
var table dashTable = na
if showDash
tablePos = switch dashPos
"Top Right" => position.top_right
"Bottom Right" => position.bottom_right
"Top Left" => position.top_left
"Bottom Left" => position.bottom_left
=> position.bottom_right
if barstate.isfirst
dashTable := table.new(
position = tablePos,
columns = 2,
rows = 5,
bgcolor = color.new(#0d1117, 5),
border_color = color.new(#30363d, 40),
border_width = 1,
frame_color = color.new(#30363d, 20),
frame_width = 1
)
if barstate.islast and not na(dashTable)
table.cell(
dashTable,
0,
0,
"Bảng Điều Khiển S/R",
text_color=color.new(#f0f6fc, 0),
text_size=size.normal,
bgcolor=color.new(#161b22, 0),
text_halign=text.align_center
)
table.merge_cells(dashTable, 0, 0, 1, 0)
table.cell(
dashTable,
0,
1,
"Kháng Cự",
text_color=color.new(#8b949e, 0),
text_size=size.normal,
bgcolor=color.new(#0d1117, 10),
text_halign=text.align_left
)
table.cell(
dashTable,
1,
1,
na(nearestRes) ? "—" : str.tostring(nearestRes, format.mintick),
text_color=na(nearestRes) ? color.new(#484f58, 0) : resColor,
text_size=size.normal,
bgcolor=color.new(#0d1117, 10),
text_halign=text.align_right
)
table.cell(
dashTable,
0,
2,
"Hỗ Trợ",
text_color=color.new(#8b949e, 0),
text_size=size.normal,
bgcolor=color.new(#0d1117, 10),
text_halign=text.align_left
)
table.cell(
dashTable,
1,
2,
na(nearestSup) ? "—" : str.tostring(nearestSup, format.mintick),
text_color=na(nearestSup) ? color.new(#484f58, 0) : supColor,
text_size=size.normal,
bgcolor=color.new(#0d1117, 10),
text_halign=text.align_right
)
table.cell(
dashTable,
0,
3,
"Break Gần Nhất",
text_color=color.new(#8b949e, 0),
text_size=size.normal,
bgcolor=color.new(#0d1117, 10),
text_halign=text.align_left
)
breakDirColor =
lastBreakDir == "Bullish"
? supColor
: lastBreakDir == "Bearish"
? resColor
: color.new(#484f58, 0)
table.cell(
dashTable,
1,
3,
lastBreakDir,
text_color=breakDirColor,
text_size=size.normal,
bgcolor=color.new(#0d1117, 10),
text_halign=text.align_right
)
activeCnt = array.size(activeLevels)
table.cell(
dashTable,
0,
4,
"Mức Đang Hoạt Động",
text_color=color.new(#8b949e, 0),
text_size=size.normal,
bgcolor=color.new(#0d1117, 10),
text_halign=text.align_left
)
table.cell(
dashTable,
1,
4,
str.tostring(activeCnt),
text_color=color.new(#f0f6fc, 0),
text_size=size.normal,
bgcolor=color.new(#0d1117, 10),
text_halign=text.align_right
)
// }
Indicator Insider
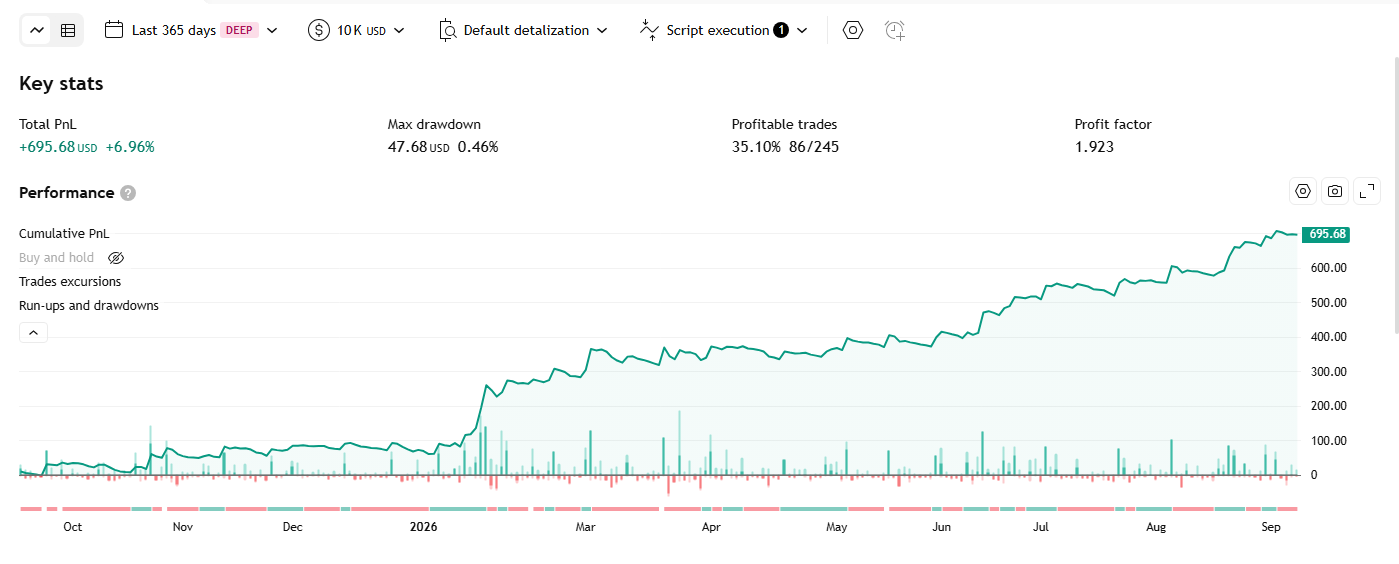
Chỉ Báo TP RSI – Strategy
RSI mở rộng: vùng trung tính thích nghi theo biến động riêng của RSI, dải ribbon 5 lớp EMA đắp lên chính RSI, bộ phát hiện phân kỳ Regular/Hidden, và 1 dải Bollinger Bands thứ 2 hiển thị trực quan.
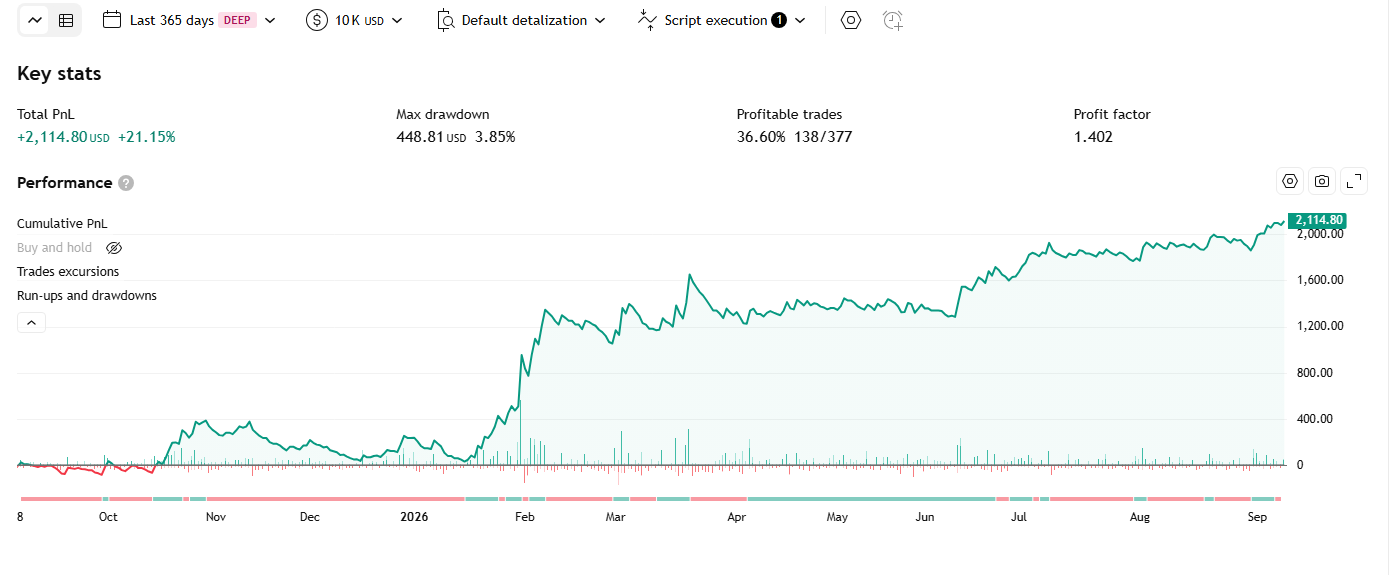
Chỉ Báo ICT Anchored Market Structures with Validation – Strategy
Chỉ báo theo phương pháp ICT (Inner Circle Trader) theo dõi cấu trúc thị trường ở 3 cấp độ lồng nhau (Ngắn/Trung/Dài hạn), xác định BoS/CHoCH tại mỗi cấp, và tự động phát hiện breakout giả (liquidity sweep) trước khi công nhận là phá vỡ cấu trúc thật.
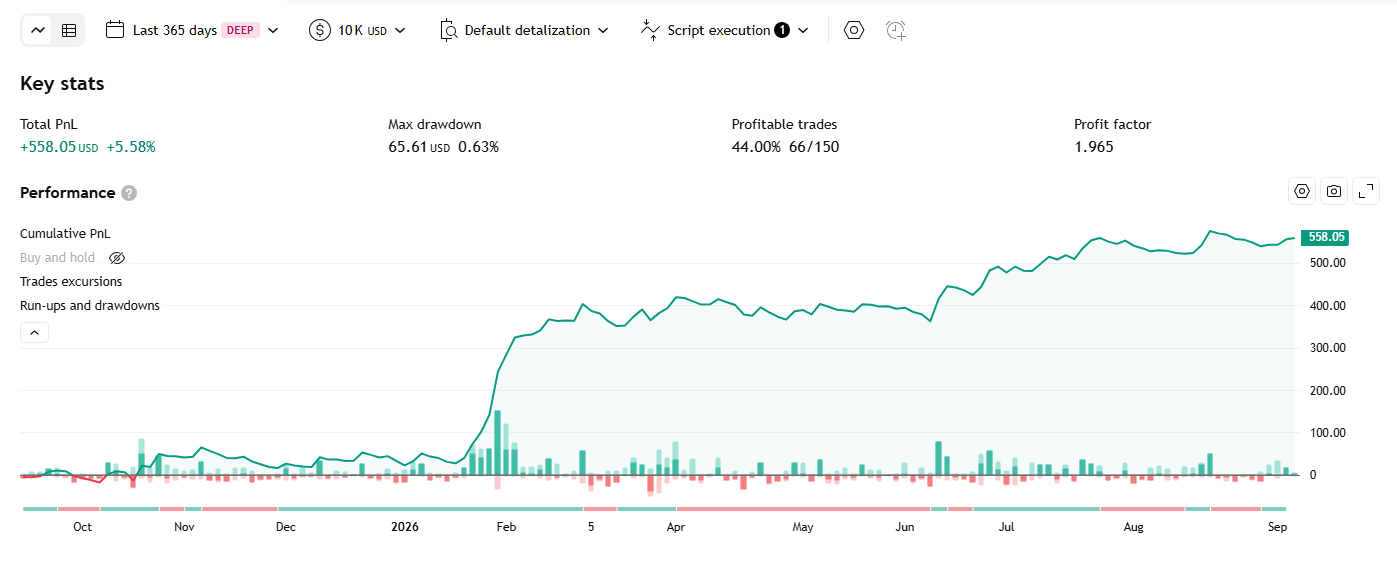
Chỉ Báo Trend Duration Forecast – Strategy
Xác định xu hướng qua độ dốc đường Hull Moving Average (HMA), đo thời lượng thực tế của mỗi xu hướng, lưu lại lịch sử thời lượng theo từng hướng, rồi dùng trung bình lịch sử đó để “dự báo” xu hướng hiện tại có thể kéo dài thêm bao