


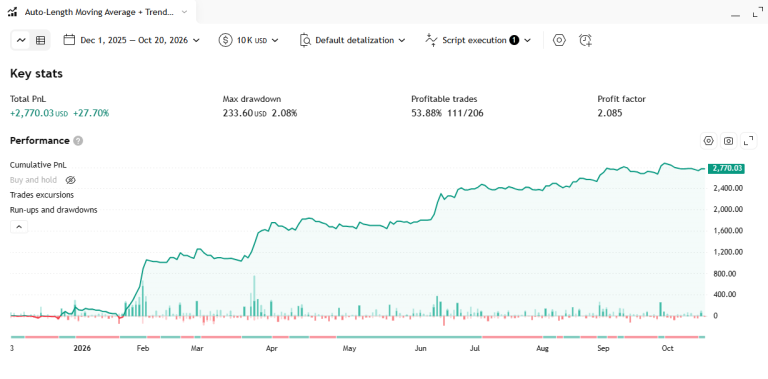
Auto-Length Moving Average + Trend Signals Indicator – Strategy
A moving average whose own length stretches or snaps back bar by bar, driven by whichever market condition you pick (slope, RSI, volume, Bollinger, MACD, Stochastic, CCI, momentum, or none at all). On top of that adaptive line sits a second, smoother line used only to judge direction and to colour circles, triangles and a 0–100 “trend score” shown in two on-chart tables.
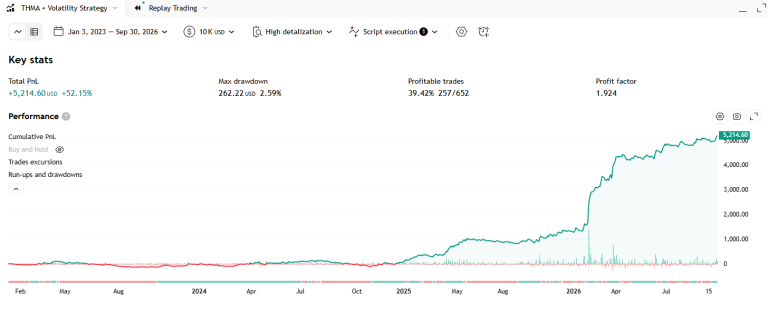
Triangular Hull Moving Average + Volatility Indicator – Strategy
A Triangular Hull Moving Average (a fast, low-lag smoothing of price) drawn as a strip of candle-shaped bars whose body tracks the line’s own last two bars of movement and whose wicks stretch out by a Hull-smoothed measure of recent candle range. The colour flips the moment the line’s slope reverses, triangle markers mark that exact bar, and a small dashboard reports the current trend arrow and how high today’s volatility sits relative to the last 1000 bars.
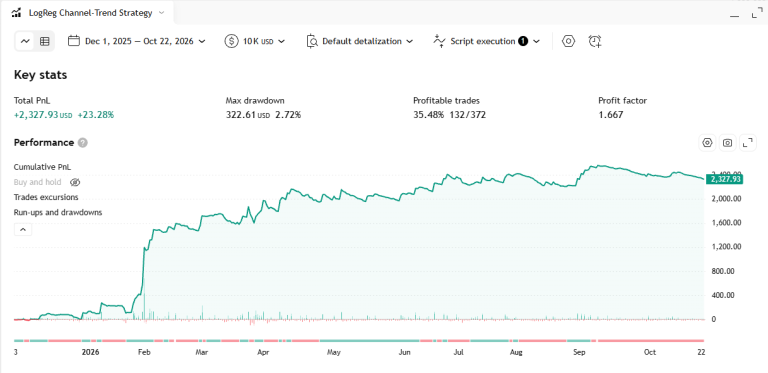
Logarithmic Regression Channel-Trend Indicator – Strategy
A straight regression line fitted through the logarithm of price over a lookback window, drawn from today back to a chosen number of bars, with two colour-coded outer boundary lines offset by a multiple of price’s own standard deviation, X-mark crossover signals on its short-term direction, and a small dashboard summarising all three readings at once.
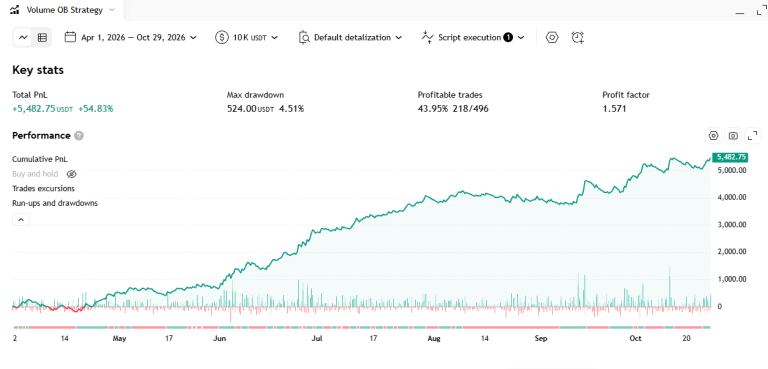
Volume Order Blocks Indicator – Strategy
Whenever a fast EMA crosses a slower one, the indicator scans back over the leg that just ended to find the candle that set its extreme, builds an Order Block box from that candle, and tags the box with the volume accumulated over the whole leg leading up to the crossover. Overlapping or invalidated boxes are pruned continuously, and only the surviving ones (up to 15 per side) are drawn, each labelled with its share of the total volume among the boxes currently on screen.
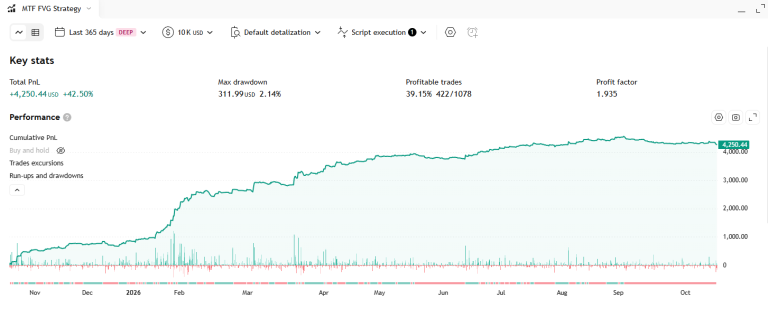
Multitimeframe Fair Value Gap Strategy – FVG Indicator – Strategy
On a chosen timeframe, the indicator watches for the classic three-candle “gap” — the current candle starts completely above (or below) the range of the candle two bars earlier — and keeps it only if the current candle’s body is big enough compared with the average body. Each surviving gap is drawn as a grey box with a dashed midline and two half-boxes showing how the candle closed, stays on the chart until price fills it, and can be listed in a side table. A smoothed trend line, pulled by every new gap, runs on top.
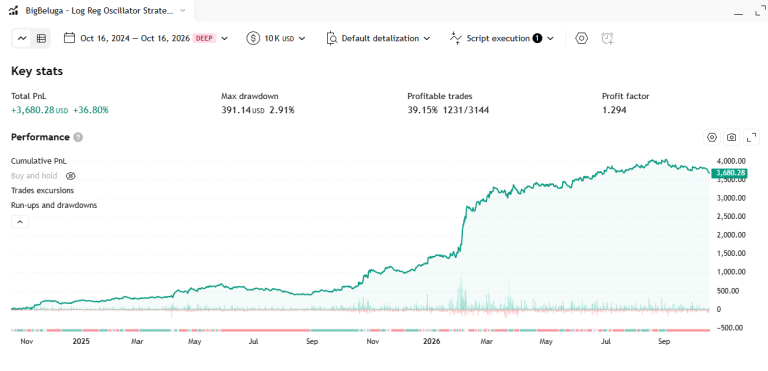
Log Regression Oscillator Channel Indicator – Strategy
The indicator fits a sloping channel to the last 150 candles (a logarithmic regression line with a band of 1.5 standard deviations on each side), then draws an oscillator (RSI by default) and its signal line INSIDE that channel, tilted to follow it: oscillator 30 sits on the lower line, 70 on the upper line, 50 on the middle line.