1. Indicator Overview – MA Oscillator Map (ChartPrime)
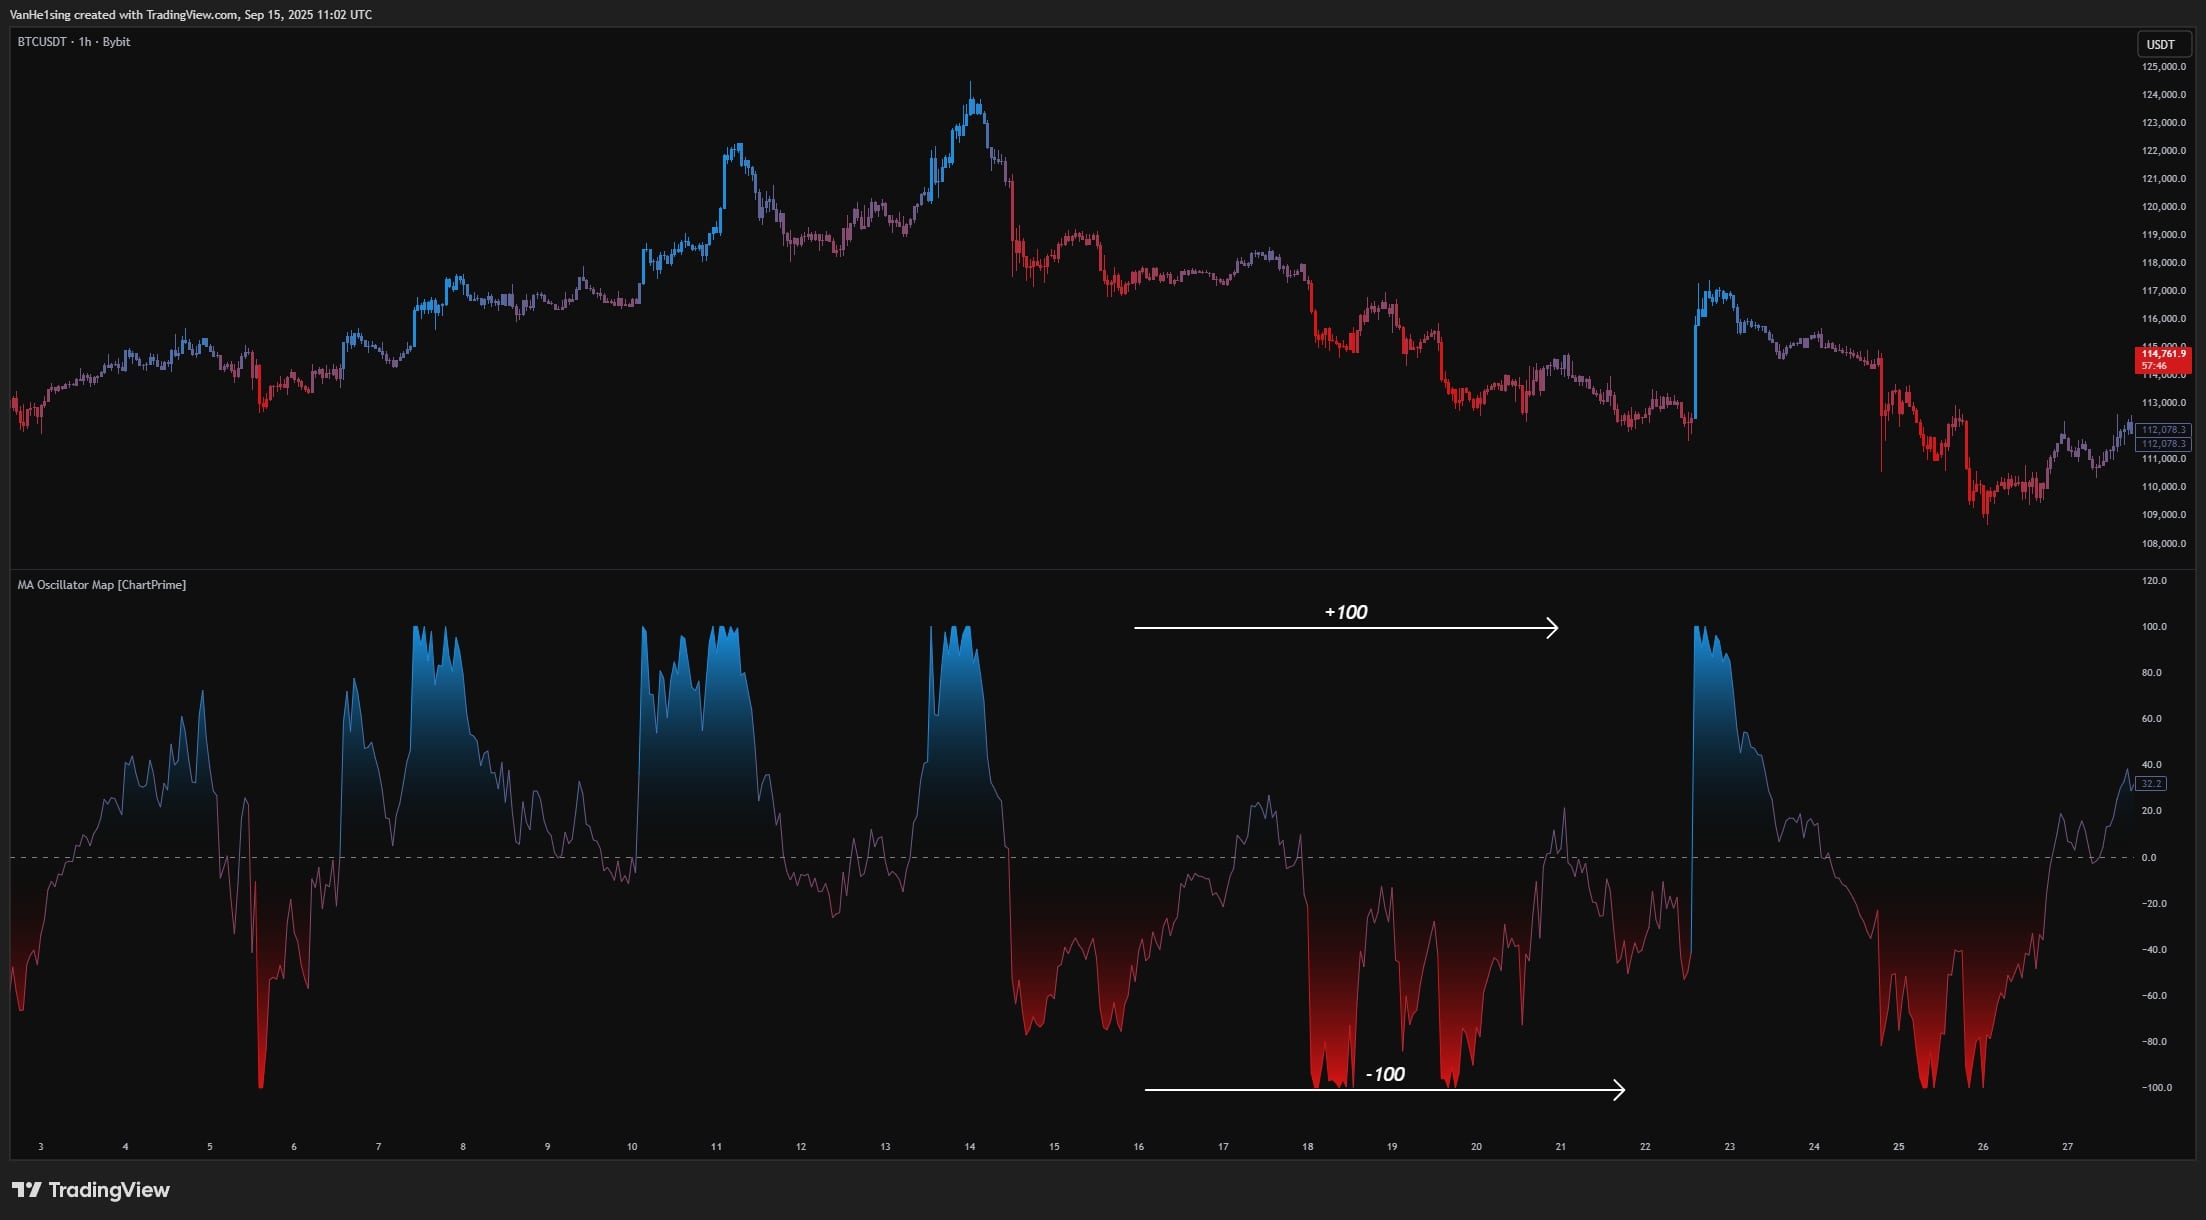
Transforms the deviation from a Moving Average (MA) into a ±100 “oscillator” to visualize overbought/oversold zones, exhaustion points, and reversal rhythms.
1.1 Indicator Concept
Core idea: take the deviation between price and a moving average (MA), normalize it to a ±100 scale so that overbought/oversold conditions are consistent across symbols and timeframes. When the oscillator (osc) “cools off” from the extreme +100 or −100, the indicator flags potential exhaustion and reversal. From these extremes, it also extends short-term reference levels (dotted lines) acting as temporary barriers until price breaks them.
1.2 Indicator Features
- ±100 Oscillator: displays osc in a separate panel, making overbought/oversold zones easy to read.
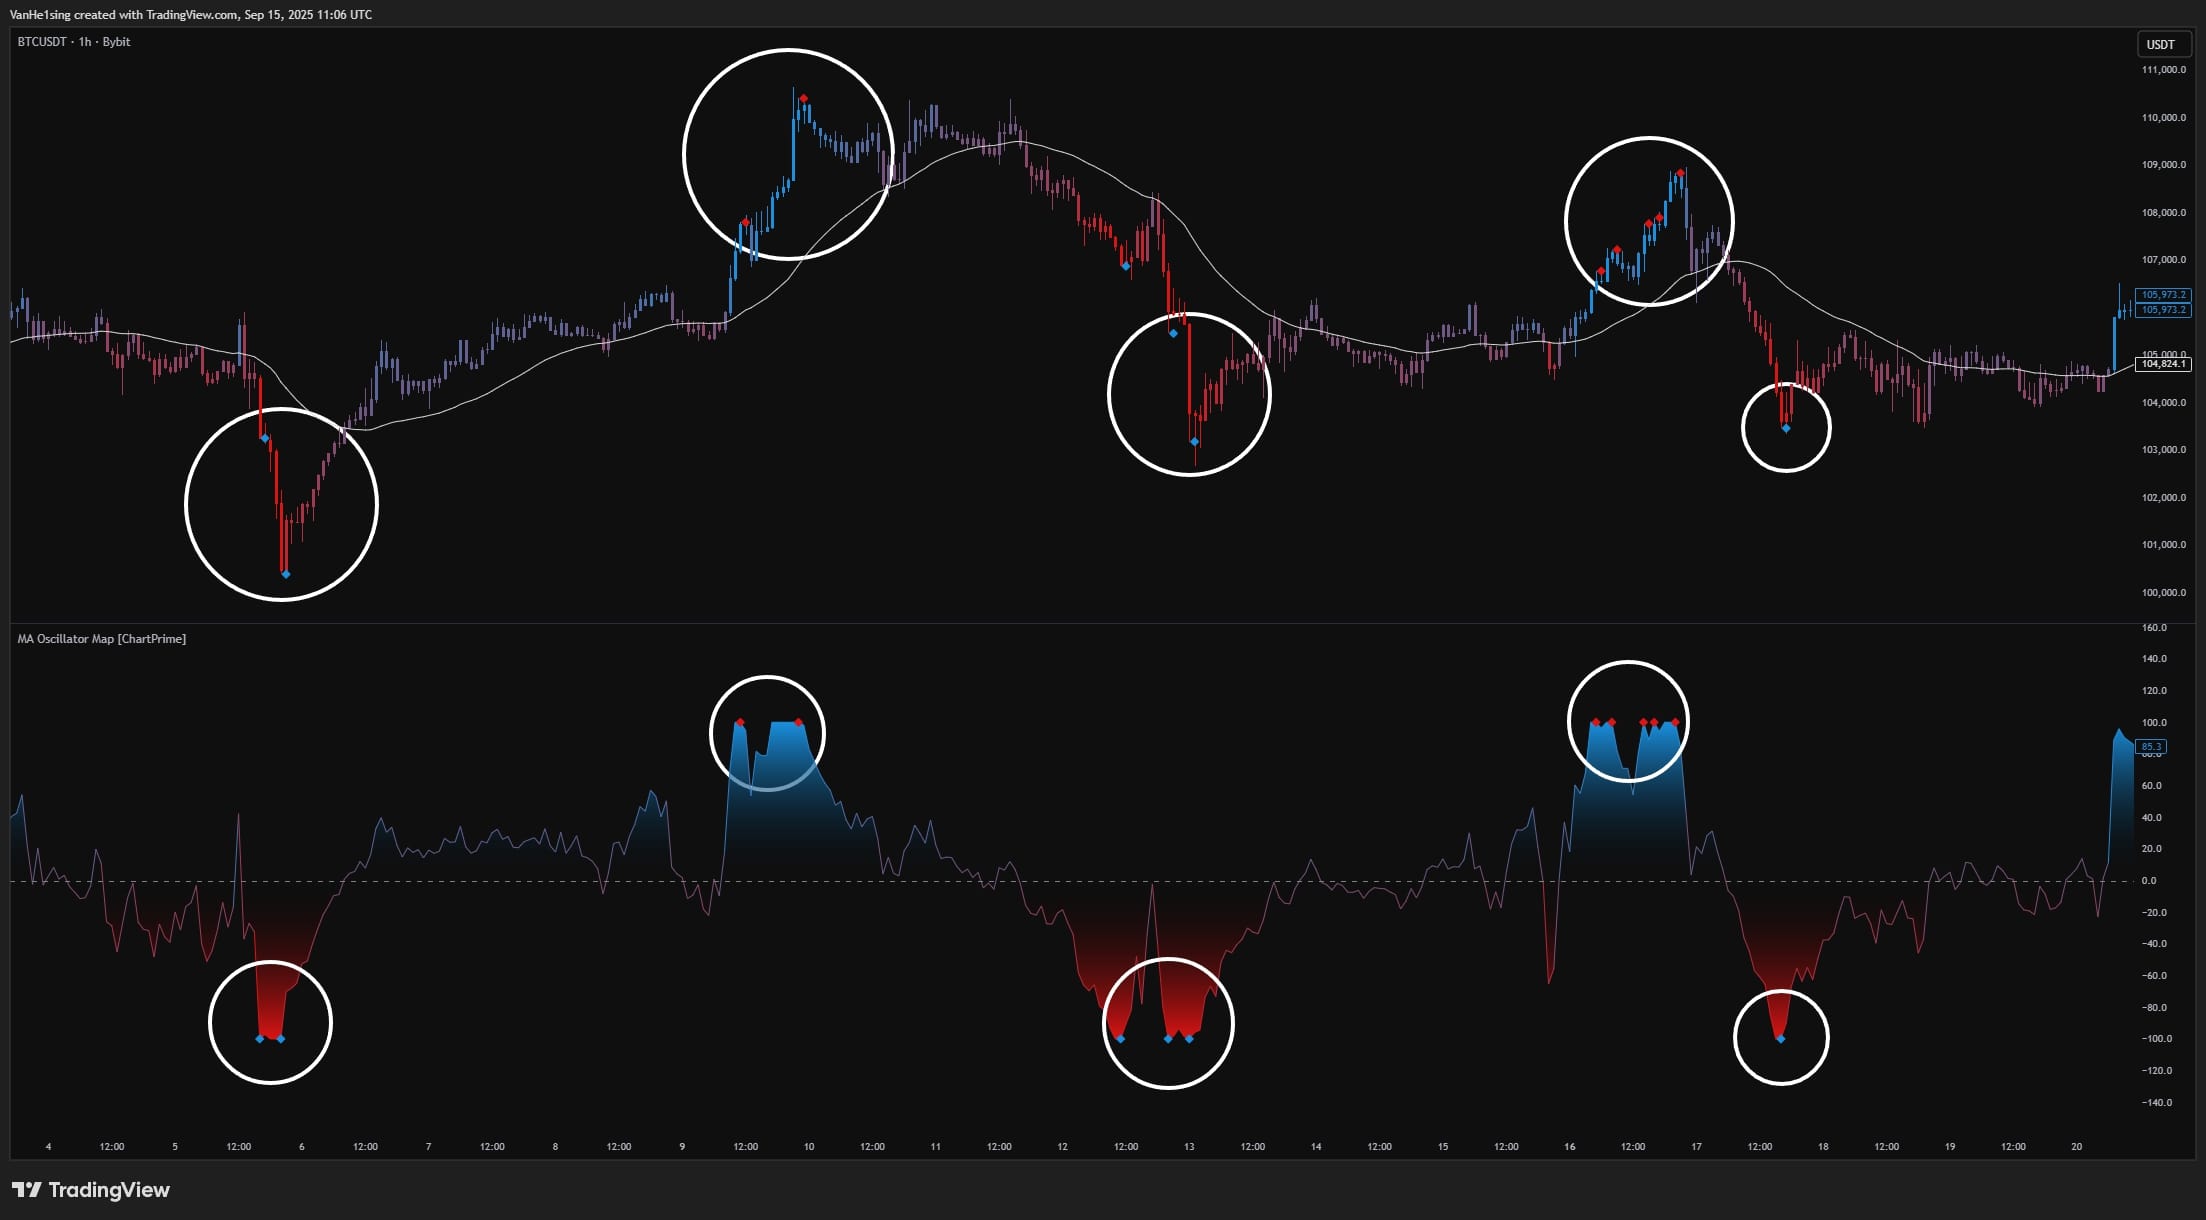
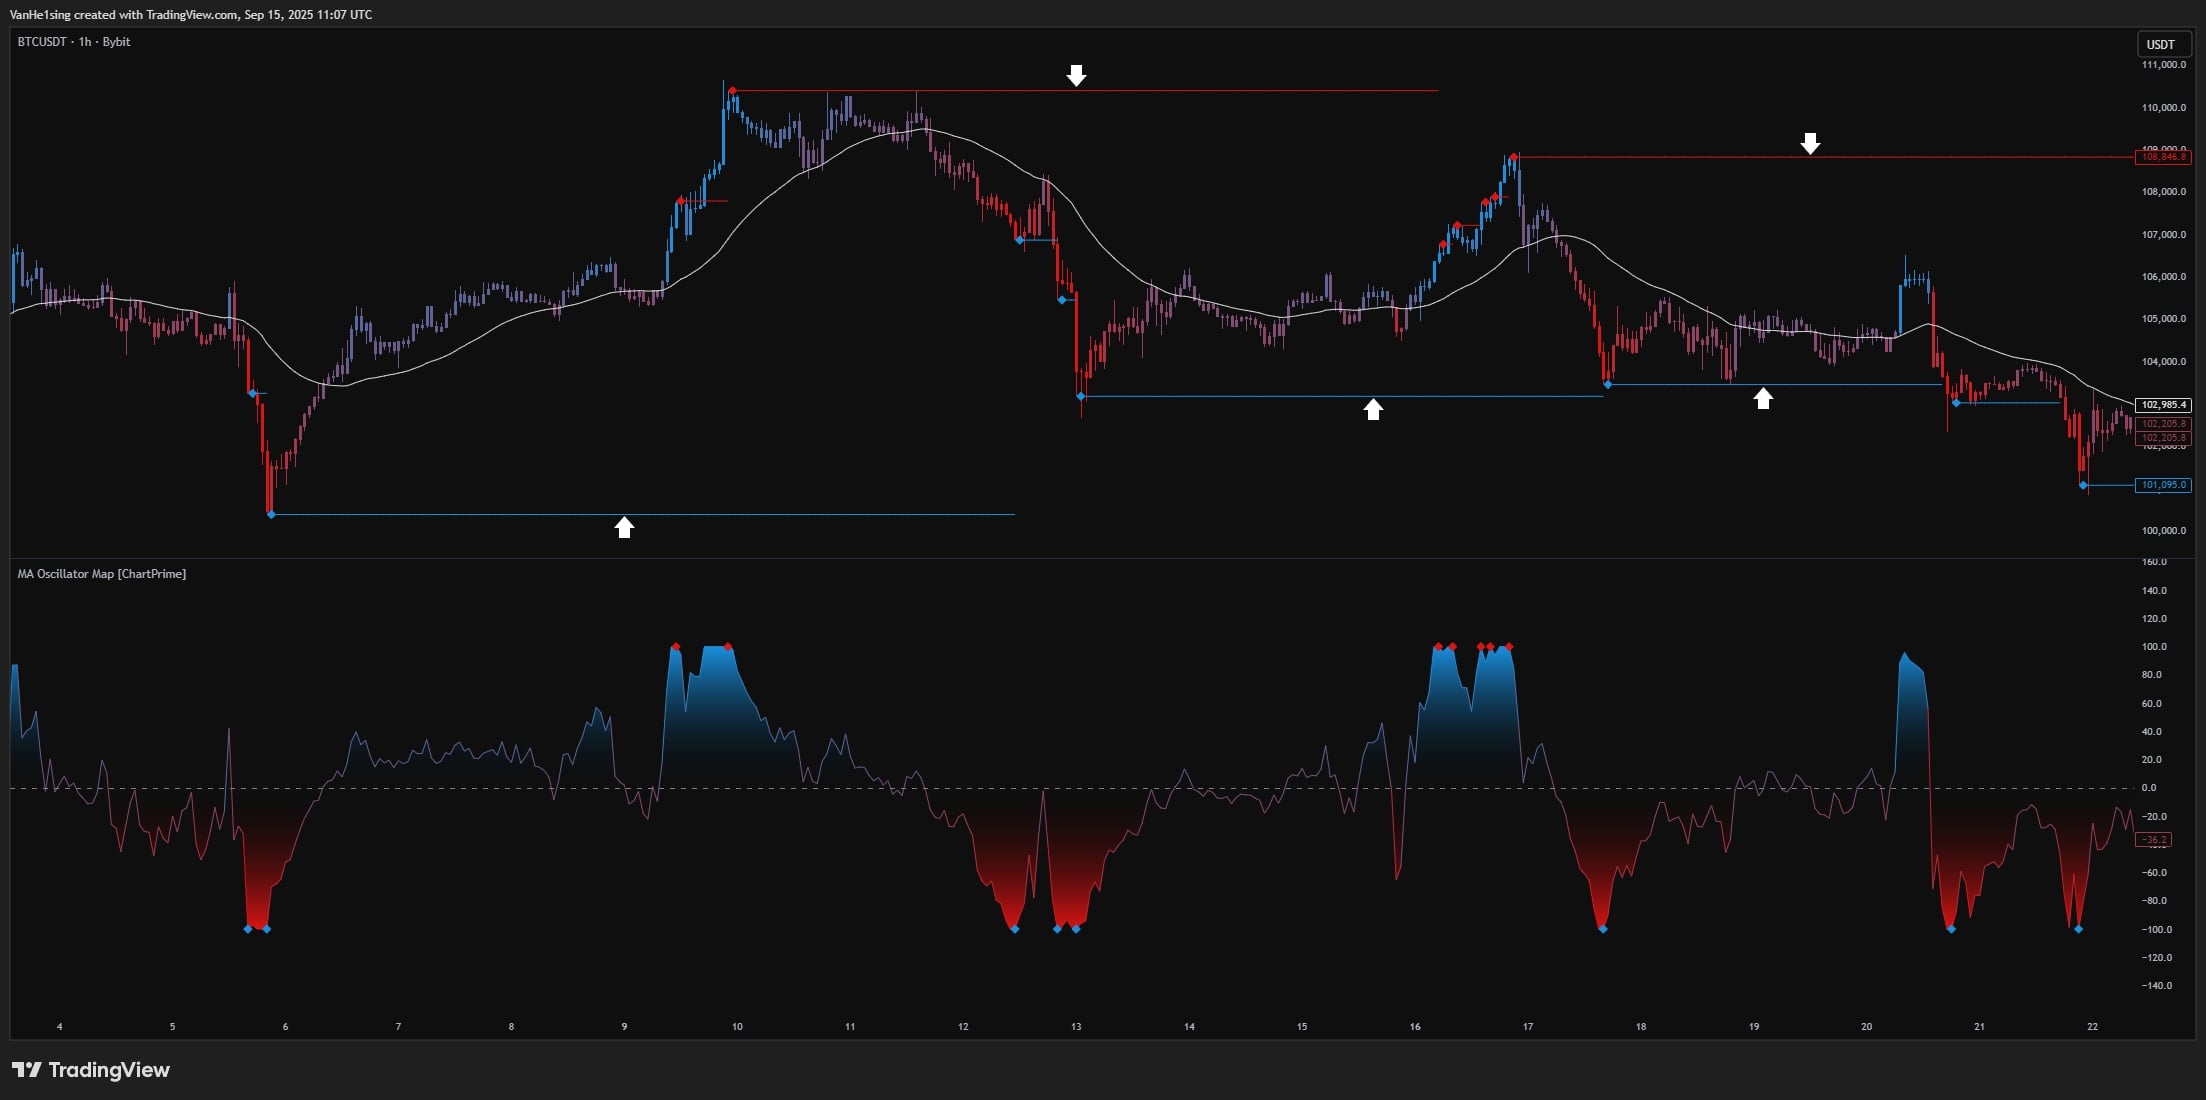
- Diamond signals: shows a diamond when osc leaves +100 or −100 → hinting possible exhaustion/reversal.
- Dotted levels from extremes: extends upper/lower levels from the latest overextended point to form temporary barriers.
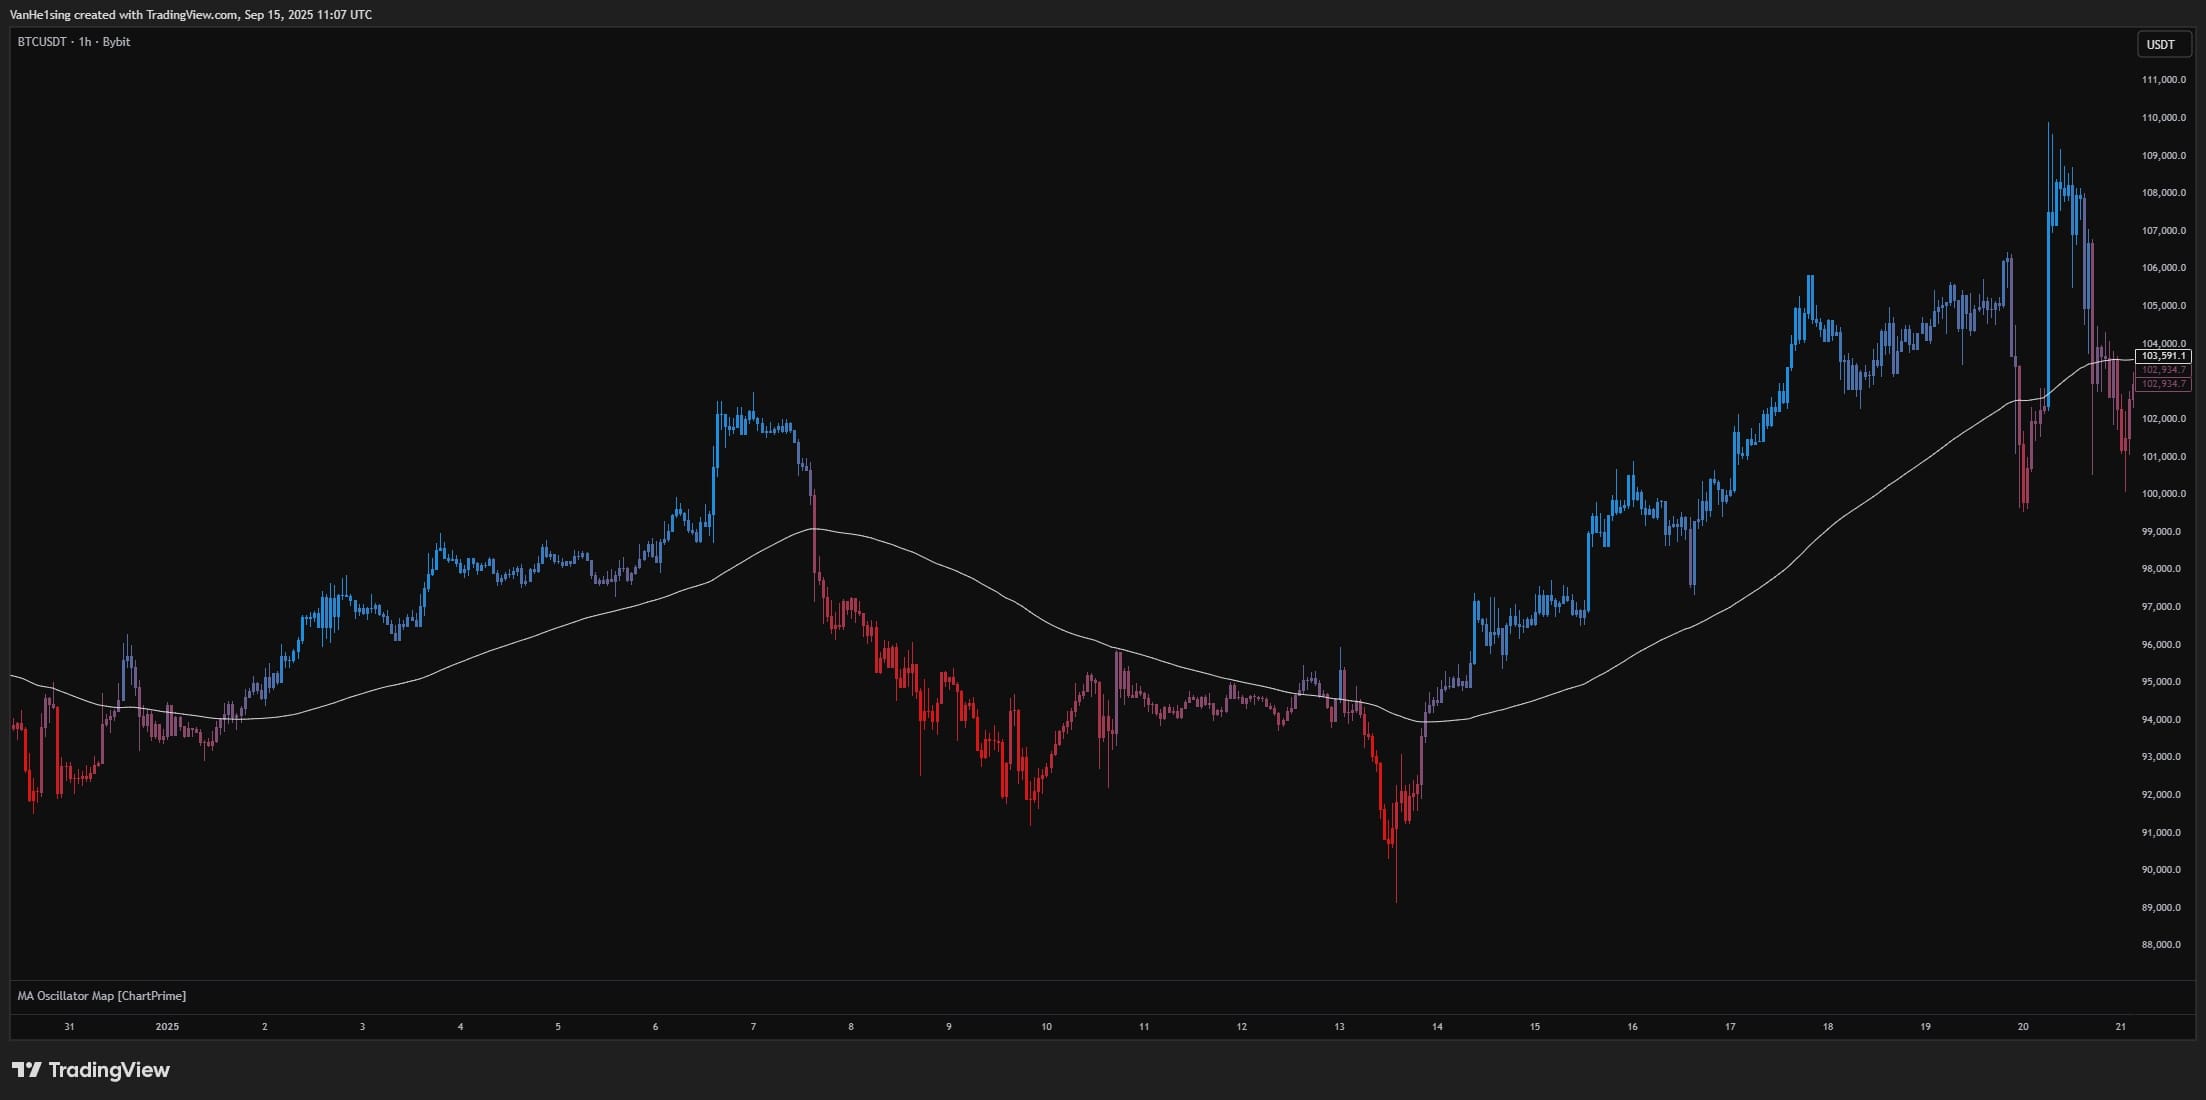
- Candlestick coloring by momentum: candles and oscillator color dynamically via gradient to show “momentum phase shifts.”
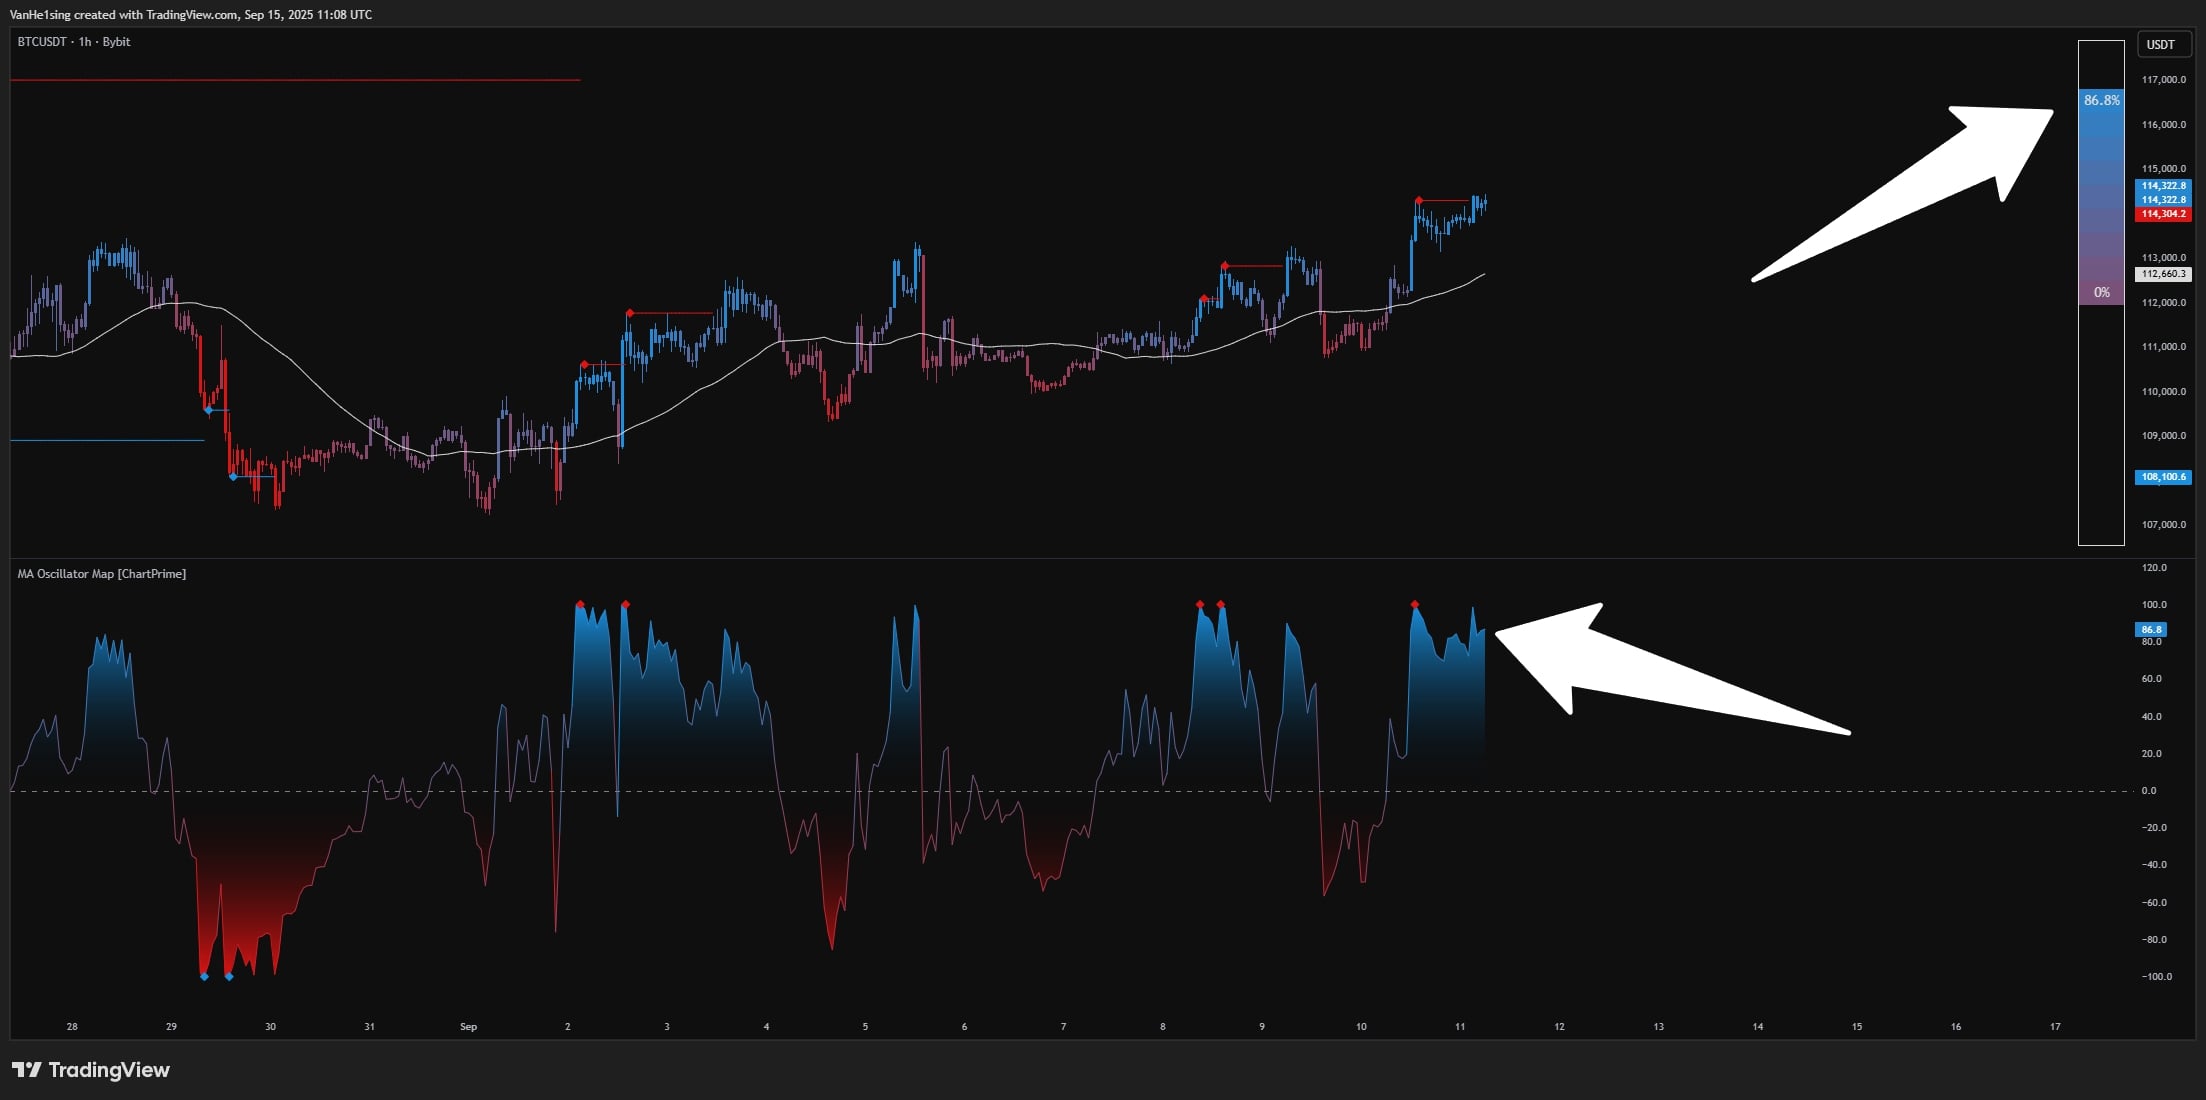
- Momentum Bar (right side): a mini panel showing osc position on a color bar and its current momentum percentage.
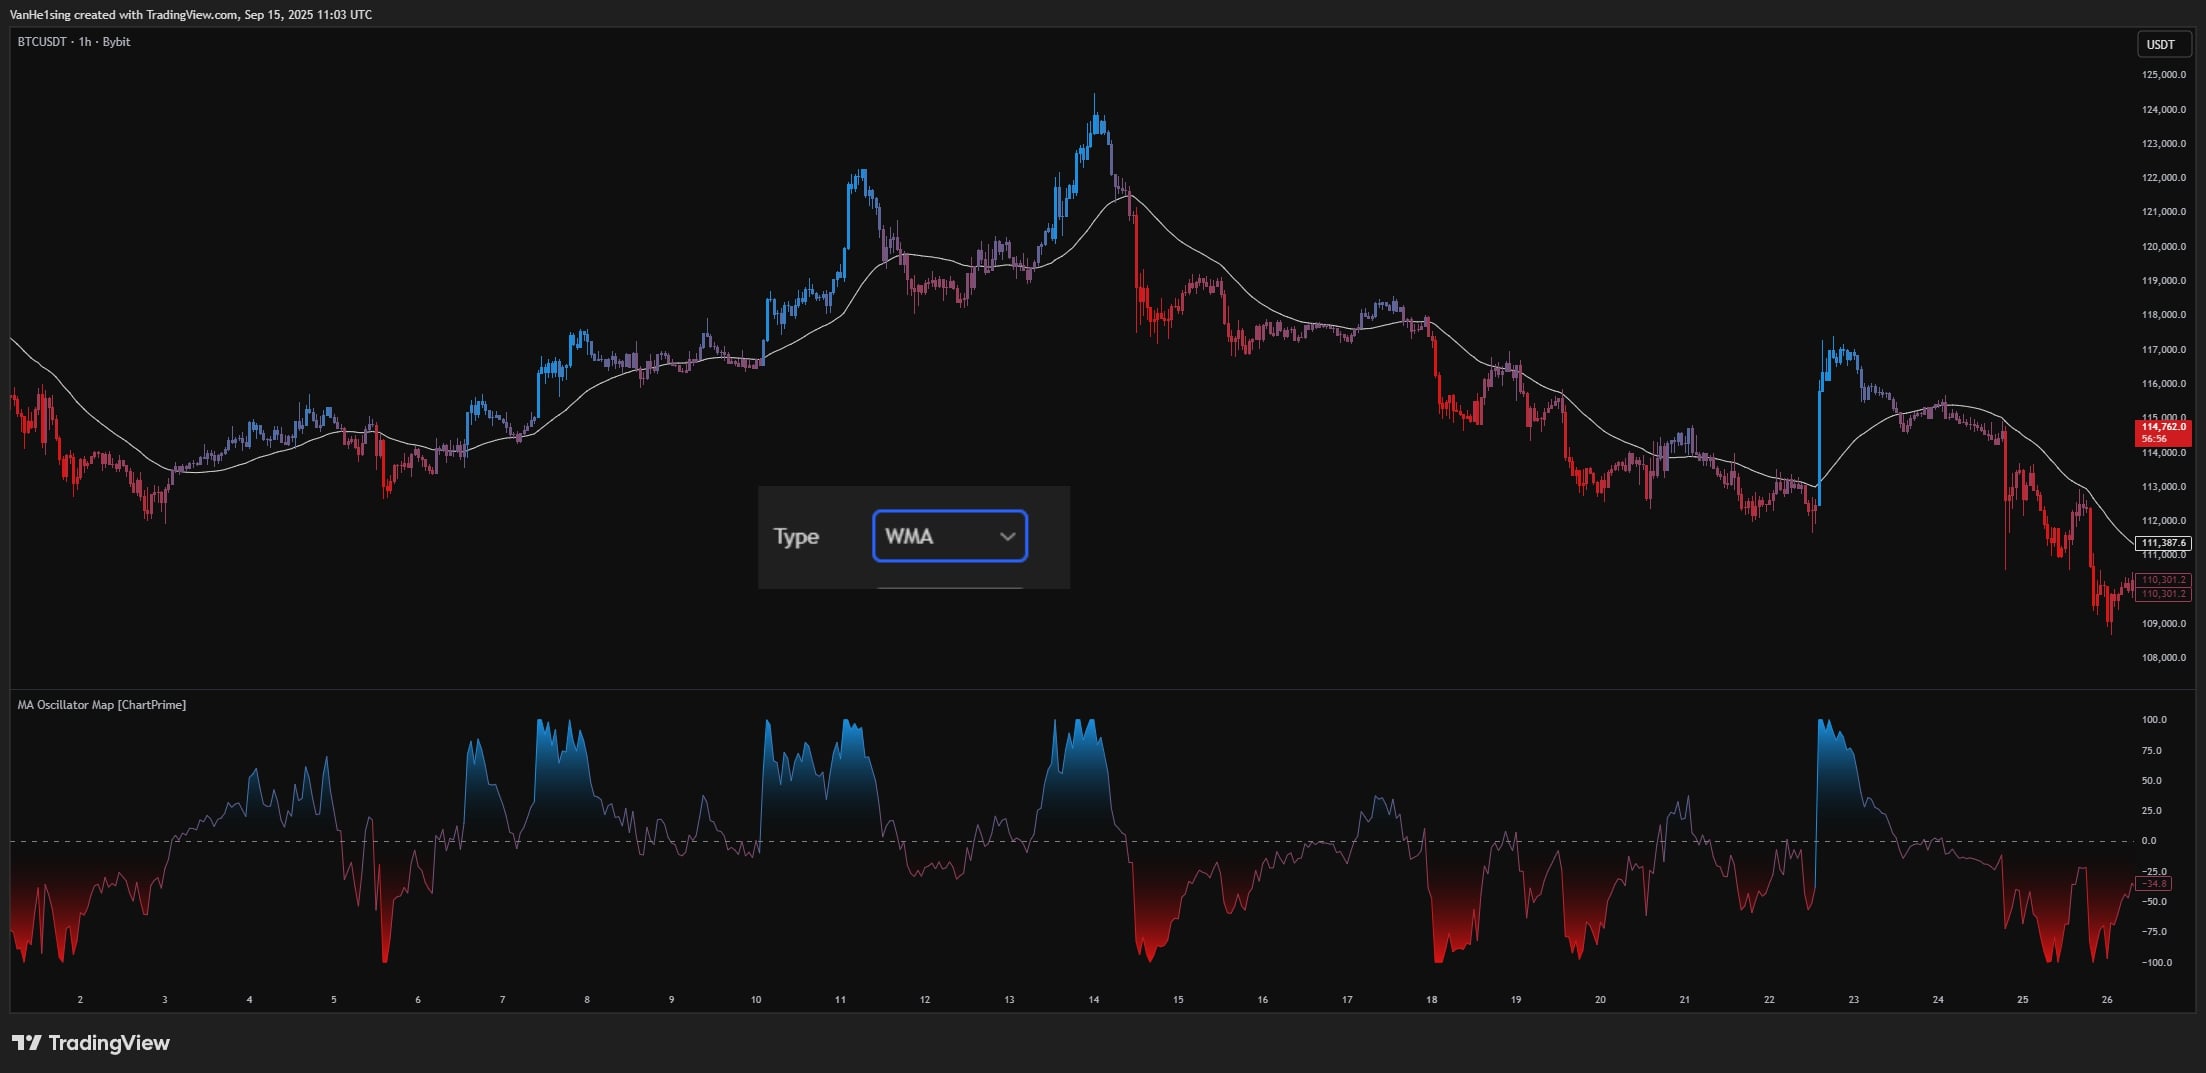
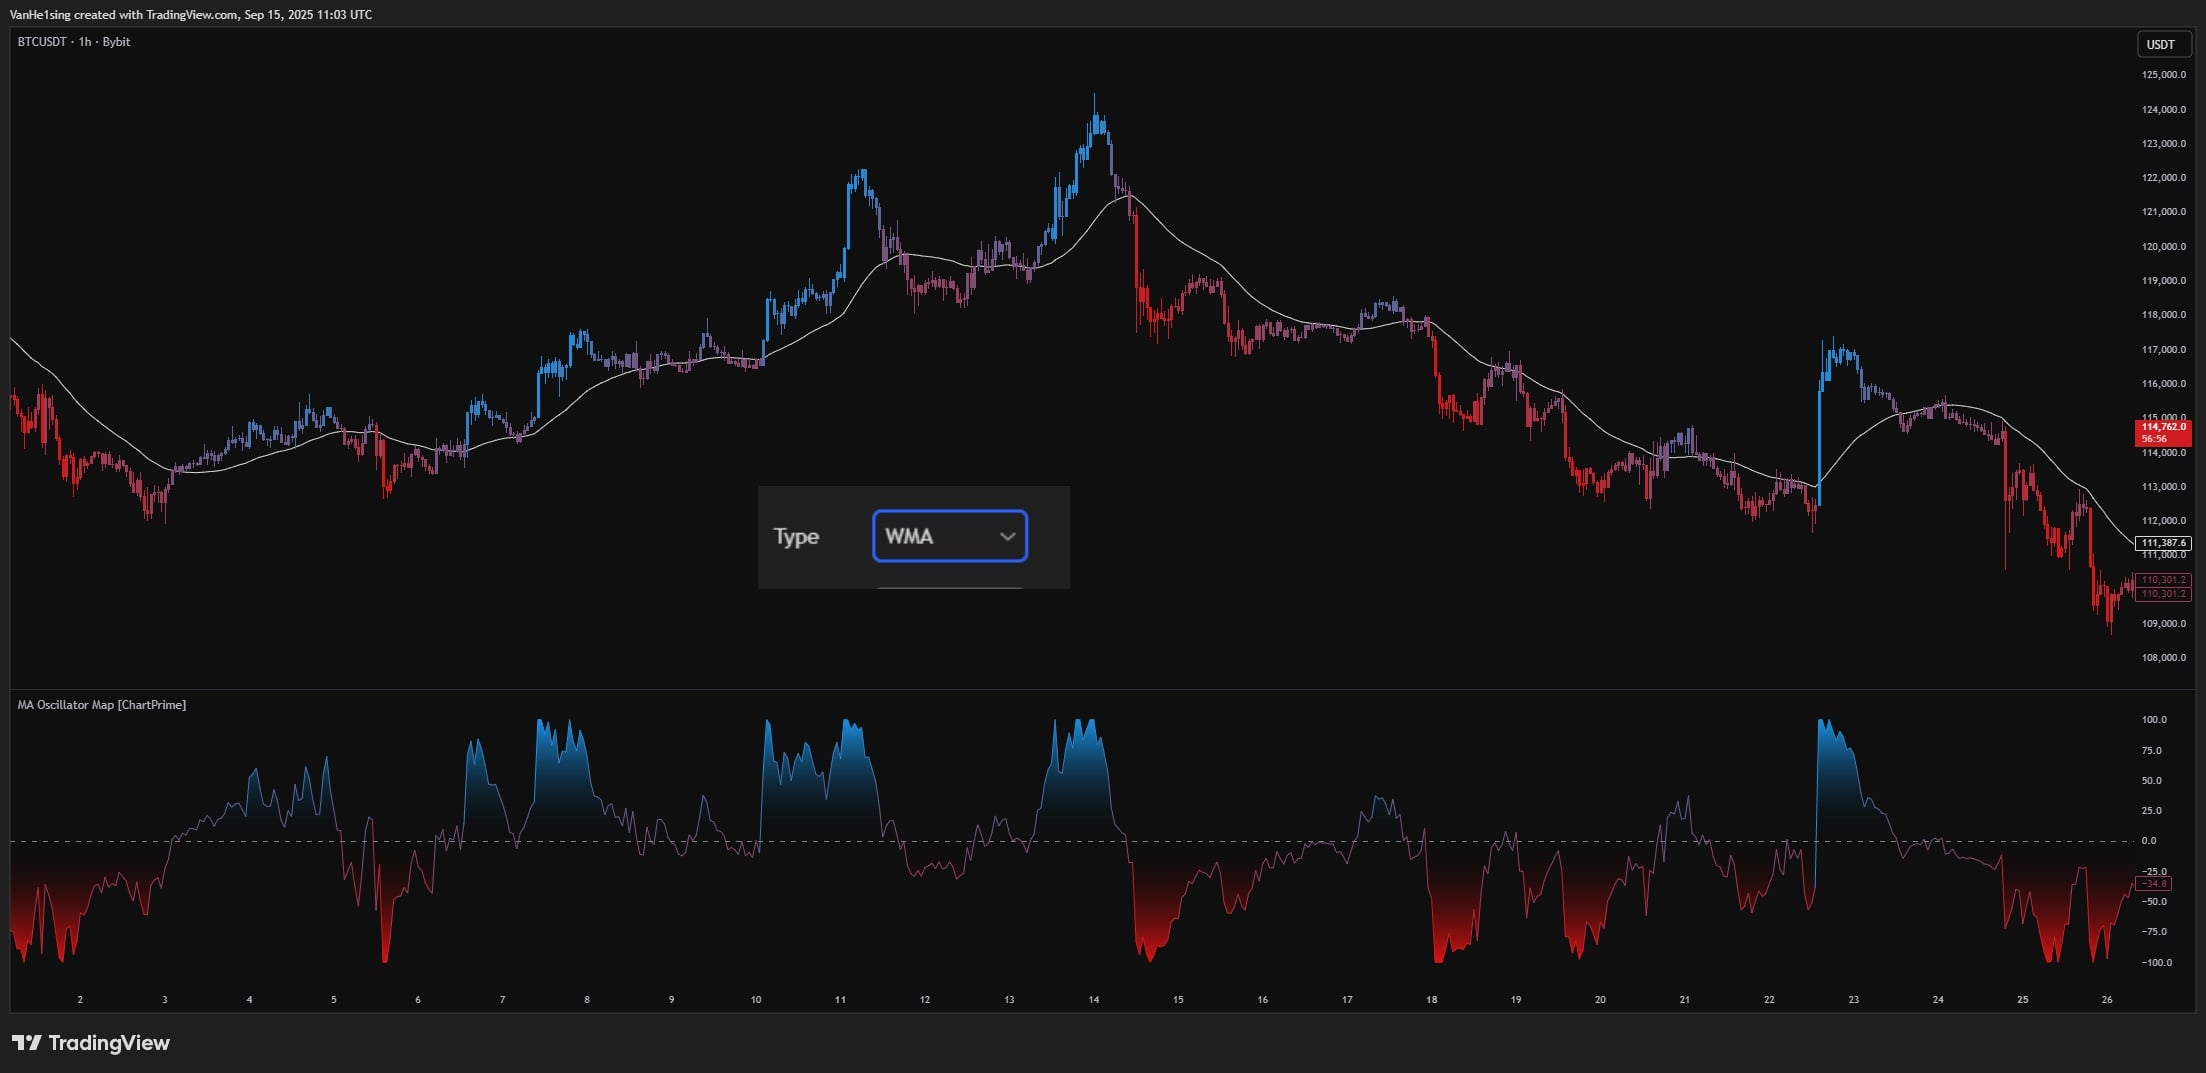
- Multiple MA options: SMA, EMA, SMMA (RMA), WMA, VWMA → choose per market sensitivity preference.
1.3 How to Use
- Hunt for “cool-downs” after extremes: When osc exits +100 (overbought) or −100 (oversold), a diamond appears → serves as a reversal warning signal.
- Use dotted levels as guides: Treat them as temporary support/resistance. If price breaks them early → favor trend continuation; if it holds → favor short-term pullback/reversal.
- Combine candle + oscillator color: When both shift tone together (“hot to cool”), it confirms momentum phase changes better than one signal alone.
- Pick MA type by market: In trending conditions use EMA/SMMA; in sideways markets use SMA/WMA to reduce noise.
- Quick momentum reading: glance at the right-hand momentum bar to gauge current “wind strength,” avoiding premature counter-trend entries.
1.4 How It Works
Inputs & Roles
- Price source (src): default close – basis for MA comparison.
- MA Type (maTypeInput): SMA/EMA/SMMA/WMA/VWMA – defines smoothness/lag.
- MA Length (maLengthInput): default 50 – reference window for momentum.
- Up/Down colors (colUp/colDn): gradient colors for candles & oscillator.
Main Logic Blocks
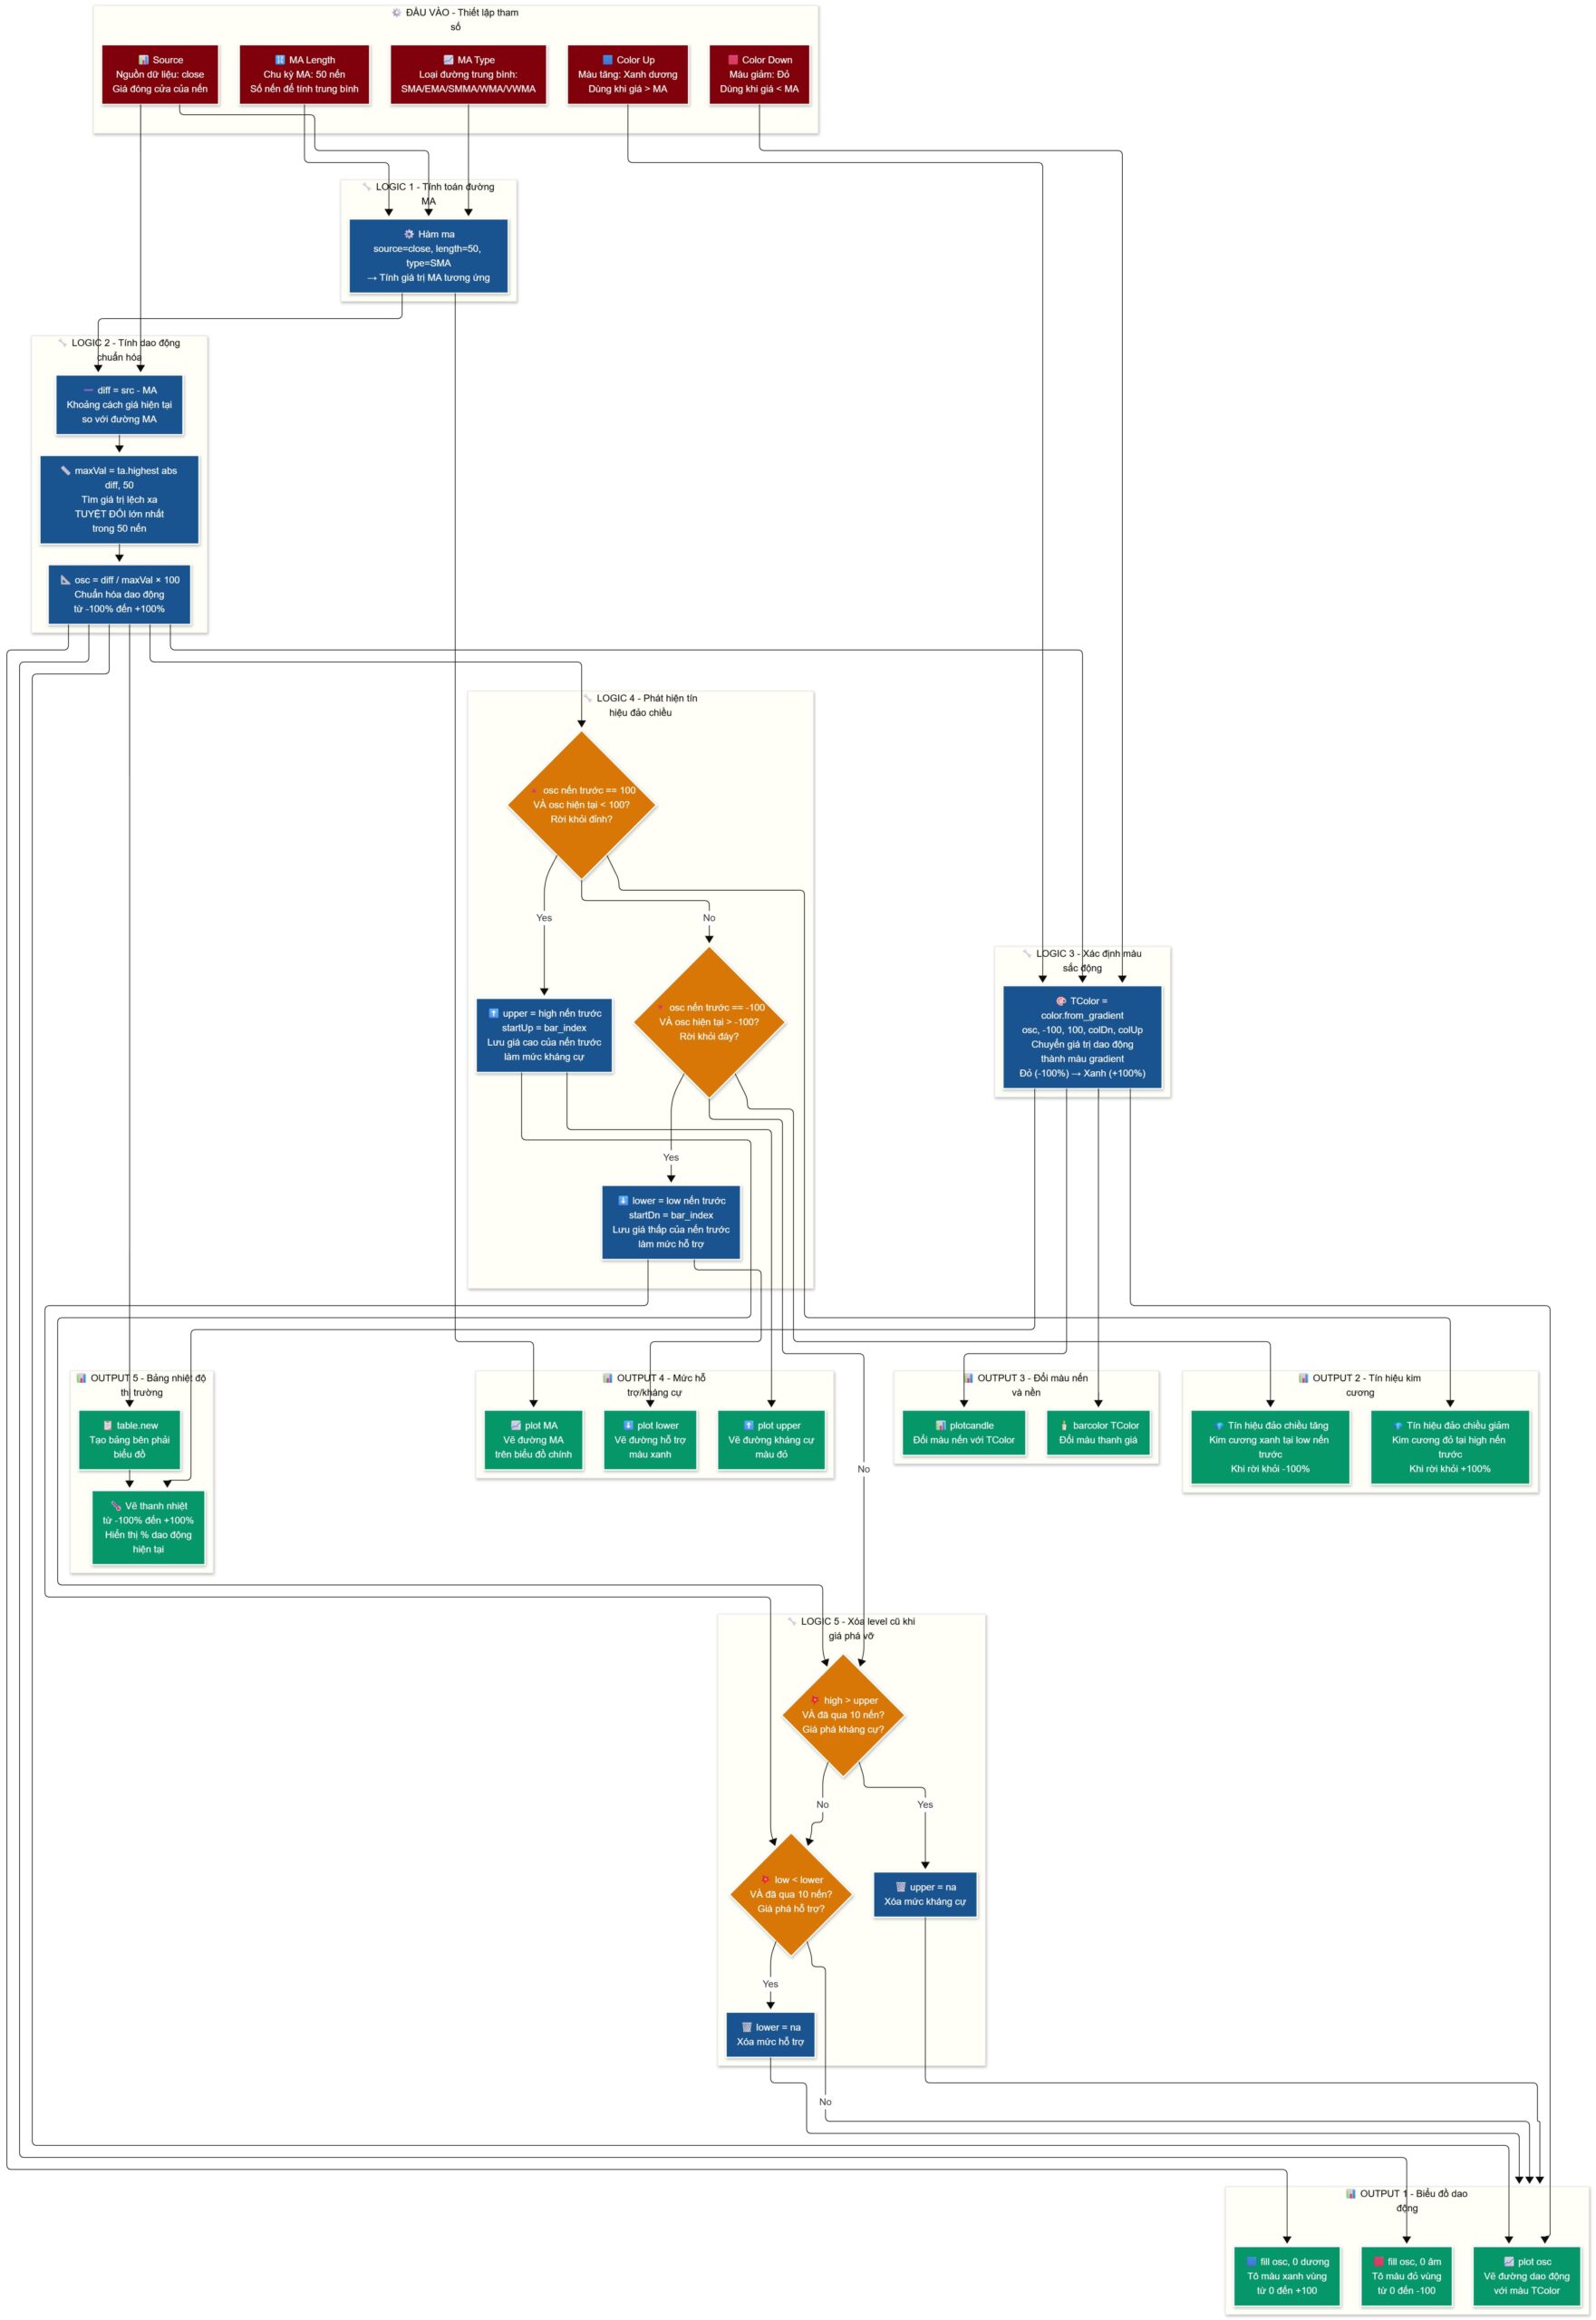
- Calculate MA (MA = ma(src, length, type)).
- Compute deviation: diff = src − MA; normalize via maxVal = highest(abs(diff), 50) → osc = diff / maxVal * 100.
- Detect leaving extremes: if osc[1] == 100 and osc < 100 → record upper = high[1]; similarly for −100 → lower = low[1].
- Expire dotted levels: if price breaks them or 10 candles pass → reset level (na).
- Color candles & fill ±100 zone: based on osc values.
- Momentum Bar: draws color scale + % label showing osc position on the right.
Outputs & Usage Roles
- Oscillator line (osc): normalized momentum between ±100.
- Diamond markers: signal “cool-down” after extremes → likely reversal/pullback zones.
- Dotted levels (upper/lower): short-term barriers until broken or expired.
- Candle coloring: visualizes momentum phase shifts directly on chart.
- Momentum % bar: color bar + % label for quick strength glance.
Quick Example (for clarity)
- Suppose using SMA(50). Current candle: src = 102, MA = 100 → diff = 2. Within last 50 candles, maxVal = 4 → osc = 2/4*100 = 50.
- Previous candle osc[1] = 100 and now osc < 100 → draw a diamond and set upper = high[1].
- If price approaches upper but doesn’t break, candle colors fade “cooler” and osc drops → consider short pullback/exit long.
- If price breaks upper early → discard reversal setup, favor trend continuation.

Use the analysis above + the code below to instruct AI to modify the indicator and turn it into a trading bot—no coding required!
How to do it here -> 👉ZERO2HERO👈
					// This Pine Script™ code is subject to the terms of the Mozilla Public License 2.0 at https://mozilla.org/MPL/2.0/
// © ChartPrime

//@version=6
indicator("MA Oscillator Map [ChartPrime]", overlay=false)

// --------------------------------------------------------------------------------------------------------------------}
// --------------------------------------------------------------------------------------------------------------------{

src 			= input(close, title="Source")
GRP 			= "MA Settings"
maTypeInput 	= input.string("SMA", "Type", options = ["SMA", "EMA", "SMMA (RMA)", "WMA", "VWMA"], group = GRP, display = display.data_window)
maLengthInput 	= input.int(50, "Length", group = GRP, display = display.data_window, active = maTypeInput != "None")

colUp = input.color(color.rgb(26, 144, 223), "", inline = "c", group = GRP)
colDn = input.color(color.rgb(219, 20, 20), "", inline = "c", group = GRP)

var upper = float(na)
var lower = float(na)
var startUp = 0
var startDn = 0

// --------------------------------------------------------------------------------------------------------------------}
// --------------------------------------------------------------------------------------------------------------------{

// Smoothing MA Calculation
ma(source, length, MAtype) =>
	switch MAtype
		"SMA"                   => ta.sma(source, length)
		"SMA + Bollinger Bands" => ta.sma(source, length)
		"EMA"                   => ta.ema(source, length)
		"SMMA (RMA)"            => ta.rma(source, length)
		"WMA"                   => ta.wma(source, length)
		"VWMA"                  => ta.vwma(source, length)

// MA
MA = ma(close, maLengthInput, maTypeInput)

diff   = src - MA
maxVal = ta.highest(math.abs(diff), 50)
osc    = diff / maxVal * 100
TColor = color.from_gradient(osc, -100, 100, colDn, colUp)

if osc[1] == 100 and osc < 100
	upper  := high[1]
	startUp := bar_index
if osc[1] == -100 and osc > -100
	startDn := bar_index
	lower  := low[1]

if high > upper and bar_index - startUp > 10
	upper := float(na)
if low < lower and bar_index - startDn > 10
	lower := float(na)

// --------------------------------------------------------------------------------------------------------------------}
// --------------------------------------------------------------------------------------------------------------------{

var tbl = table.new(position.middle_right, 100, 100, force_overlay = true, frame_color = chart.fg_color, frame_width = 1)

if barstate.islast
	for i = 0 to 20
		tbl.cell(1, i, i == 10 ? "x" : "", bgcolor = chart.bg_color, text_color = chart.fg_color, height = 3)

	for i = 0 to int(math.abs(osc/10))
		val = int(osc/10) > 0
		index = val ? 10 - i : 10 + i
		BGColor = color.from_gradient(index, 0, 20, colUp, colDn)

		tbl.cell(1, index,  i == 0 ? "0%" : (i == int(math.abs(osc/10)) ? str.tostring(osc/100, "##.#%") : ""), bgcolor = BGColor, text_color = chart.fg_color, height = 3)

posc = plot(osc, "Oscillator", force_overlay = false, color = TColor)
pcls = plot(0, "", display = display.none, editable = false)
hline(0)
fill(posc, pcls, 100, 0, colUp, color(na))
fill(posc, pcls, 0, -100, color(na), colDn)

barcolor(TColor)
plotcandle(open, high, low, close, title='Candles Color', color = TColor, wickcolor=TColor, bordercolor = TColor, force_overlay = true)

plotshape(osc[1] == 100 and osc < 100 ? high[1] : float(na), "Upper Signals Chart", shape.diamond, force_overlay = true, location = location.absolute, size = size.tiny, color = colDn)
plotshape(osc[1] == 100 and osc < 100 ? osc[1] : float(na), "Upper Signals", shape.diamond, force_overlay = false, location = location.absolute, size = size.tiny, color = colDn, offset = -1)

plotshape(osc[1] == -100 and osc > -100 ? low[1] : float(na), "Lower Signals Chart", shape.diamond, force_overlay = true, location = location.absolute, size = size.tiny, color = colUp)
plotshape(osc[1] == -100 and osc > -100 ? osc[1] : float(na), "Lower Signals", shape.diamond, force_overlay = false, location = location.absolute, size = size.tiny, color = colUp, offset = -1)

plot(upper[1] != upper ? float(na) : upper, "Upper Level", force_overlay = true, style = plot.style_linebr, offset = 0, color = colDn)
plot(lower[1] != lower ? float(na) : lower, "Lower Level", force_overlay = true, style = plot.style_linebr, offset = 0, color = colUp)
plot(MA, "MA", color=chart.fg_color, force_overlay = true)

// --------------------------------------------------------------------------------------------------------------------}