1. Volume Profile, Pivot Anchored — Indicator Description
Distribution of traded volume by price level between pivot points
1.1 Indicator Concept
This indicator is based on the principle that "Trading volume clusters at key prices" combined with "Pivot Point theory".
Core idea:
- Pivot Points: The highest (pivot high) and lowest (pivot low) prices within a defined lookback/forward window. These are locations where trend reversals often occur.
- Volume Profile: Shows the distribution of traded volume by price, revealing where the most buyers/sellers acted.
- Value Area: The price range containing 68% (default) of total traded volume — the “accepted” price zone for most of the market.
- Point of Control (PoC): The price level with the highest traded volume — the strongest consensus price.
Working hypothesis: When price returns to zones that historically carried large volume (especially the PoC), the market tends to react strongly — either bouncing (support/resistance) or breaking through to continue the trend. By anchoring the volume profile to pivot points, we precisely define the important price range between swing highs/lows to find optimal entries.
1.2 Indicator Features
Displayed components and their roles:
-
Volume Profile (horizontal yellow/gray bars):
- Yellow: Inside the Value Area (68% of volume)
- Gray: Outside the Value Area
- Bar length: Proportional to traded volume at that price level
- Point of Control — PoC (red horizontal bar): Marks the price with the largest traded volume within the pivot span. Acts like a “magnet” — price often gravitates back to it.
- Value Area High — VAH (blue line): The upper boundary of the Value Area. A break above VAH may signal strong bullish momentum.
- Value Area Low — VAL (blue line): The lower boundary of the Value Area. A break below VAL may signal strong bearish momentum.
- Light blue background (optional): Shades the entire Value Area for quick recognition of the “fair value” zone.
- Info labels: Display the profile’s high/low, % price change, and total volume.
-
Candle coloring by volume (optional):
- Dark green/red candles: Extremely high volume (> 1.618× average)
- Light green/red candles: Weak volume (< 0.618× average)
- Regular green/red: Average volume
Auto alerts:
- Alert when price touches/crosses PoC
- Alert when price touches/crosses VAH
- Alert when price touches/crosses VAL
- Alert on abnormal volume spikes
1.3 How to Use the Indicator
- Identify strong support/resistance: PoC, VAH, and VAL are likely hold/break zones. Traders can place pending orders around these levels.
-
Entry points:
- Buy when price retests PoC or VAL from above (in an uptrend)
- Sell when price retests PoC or VAH from below (in a downtrend)
- Enter on breakouts above VAH (buy) or below VAL (sell) with high volume
-
Stop Loss:
- Longs: SL below VAL or the nearest pivot low
- Shorts: SL above VAH or the nearest pivot high
-
Take Profit:
- Longs: TP at VAH, the next pivot high, or the profile’s highest price
- Shorts: TP at VAL, the next pivot low, or the profile’s lowest price
-
Trend analysis:
- Price above VAH: Strong market — favor longs
- Price below VAL: Weak market — favor shorts
- Price oscillating within the Value Area: Range-bound — wait for breakout
- Combine with volume: When dark-colored candles (extremely high volume) appear at PoC/VAH/VAL, it’s a strong signal for a reversal or trend continuation.
- Naked PoC (untested PoC): If price moves away from PoC without retesting it, that level acts as a strong “magnet” — price often returns to retest it later.
1.4 How the Indicator Works
Inputs and their roles:
- Pivot Points Left/Right Length (pvtLength): The number of bars to the left and right used to define a pivot. Default is 20, meaning a pivot high is confirmed when there are 20 bars on each side with no higher high. Larger values make pivots “stronger” but slower to appear.
- Value Area Volume % (isValueArea): The % of total volume to include in the Value Area. Default 68% (per normal distribution). Adjustable 0–100%.
- Profile Levels (profileLevels): The number of “price levels” (bins) in the profile. Default 20. More levels give finer detail but require more resources.
- Profile Length & Width: The length (bars) and width (% of chart width) of drawn volume bars.
- Volume Moving Average Length: The volume MA period (default 89) used to define average volume for candle coloring.
- Data sources: High, low, close, open, and volume of each bar.
Main logic blocks:
-
Block 1: Detect Pivot Points
- Functions ta.pivothigh() and ta.pivotlow() scan bars to find local highs and lows.
- pvtHigh stores pivot-high price; pvtLow stores pivot-low price.
- pvtLength and pvtLengthR set pivot strength (left/right bars).
- Result: Defines the price span from pivot low to pivot high over which the volume profile is drawn.
-
Block 2: Split the span into Price Levels
- Compute priceHighest and priceLowest within the pivot span.
- Formula: priceStep = (priceHighest - priceLowest) / profileLevels to create evenly spaced levels.
- Example: If price ranges from 100 to 120 and we use 20 levels → each level = 1 price unit.
-
Block 3: Aggregate volume for each price level
- Iterate over bars in the pivot span and determine which levels each bar traverses.
- Use array volumeStorageT to accumulate volume per level.
- Allocation rule: If a bar spans multiple levels, split the volume proportionally to the portion of the bar falling in each level.
- Example: Bar from 100–102 with volume 500 → if level 1 is 100–101, it receives 250; level 2 (101–102) receives 250.
-
Block 4: Determine the Point of Control (PoC)
- Find the level with the maximum volume in volumeStorageT.
- pocLevel = index of the level with max volume.
- PoC price = priceLowest + (pocLevel + 0.5) * priceStep.
-
Block 5: Compute the Value Area (VAH and VAL)
- Start at PoC and expand upward (levelAbovePoc) and downward (levelBelowPoc) by one level at a time.
- At each step, choose the side with greater volume to expand.
- Stop when cumulative volume reaches 68% (or user-defined %) of the total profile volume.
- VAH = price at the topmost included level; VAL = price at the bottommost included level.
-
Block 6: Draw the Volume Profile and lines
- Each level is drawn with box.new(), a horizontal bar whose length is proportional to volume.
- Colors: Levels inside the Value Area use totalVolumeColor (yellow); outside use vaVolumeColor (gray).
- PoC is drawn as a prominent red bar (pocColor).
- VAH and VAL are drawn as blue lines (vahColor, valColor).
- Optional: Fill the Value Area background via linefill.new().
-
Block 7: Color candles by volume
- Compute volume SMA(89) (vSMA).
- Compare current bar’s volume to MA:
- If > 1.618 × MA: Dark candle (green #00be9f or red #ff0015)
- If < 0.618 × MA: Faded/translucent candle
- Else: Average-colored candle
-
Block 8: Alerts
- ta.cross() checks whether price crosses PoC, VAH, or VAL.
- If true, send an alert including the current price.
- High-volume alert when volume > 1.618 × MA.
Outputs and how they’re used:
- Volume Profile (horizontal bars): Lets traders see the volume distribution → Identify key price zones.
- PoC (red bar): The “magnet” price → Use as a target or entry on retests.
- VAH, VAL (blue lines): Value Area boundaries → Entries on breakouts or pullbacks into these zones.
- Labels: Show stats (high/low, % change, volume) → Assess the strength of the pivot span.
- Candle colors: Quickly spot abnormal volume → Potential reversal or breakout signals.
- Alerts: Timely notifications at key zones → Don’t miss trade opportunities.
Assume: The indicator detects a pivot low at 1800 and a pivot high at 2000. Within this span, there are 20 price levels.
- Step 1: Split into 20 levels → Each level = (2000−1800)/20 = 10 price units (level 1: 1800–1810, level 2: 1810–1820, ...)
- Step 2: Volume calc: Suppose there are 100 bars. Bar 1 ranges 1805–1815 with volume 500 → Allocate 250 to level 1, 250 to level 2.
- Step 3: After aggregating, say level 10 (1890–1900) has the largest volume of 5000 → PoC = 1895.
- Step 4: Value Area: Total volume = 50,000. Need 68% = 34,000. Start from level 10 (5,000), expand to level 9 (3,000), level 11 (4,000), ... until 34,000 → Suppose VAH = 1950, VAL = 1850.
- Step 5: Draw the profile: Level 10 has the longest bar (red PoC), levels 5–15 are yellow (Value Area), levels 1–4 and 16–20 are gray.
- Usage: If current price is 1920 and drops toward 1895 (PoC) → A potential long since PoC often provides strong support. Place SL below 1850 (VAL), TP at 1950 (VAH) or 2000 (pivot high).


Use the analysis above + the code below to instruct AI to modify the indicator and turn it into a trading bot—no coding required!
How to do it here -> 👉ZERO2HERO👈
					//@version=5
// ══════════════════════════════════════════════════════════════════════════════════════════════════ //
//# * ══════════════════════════════════════════════════════════════════════════════════════════════
//# *
//# * Study       : Volume Profile, Pivot Anchored
//# * Author      : © dgtrd
//# *
//# * Revision History
//# *  Release    : Jun 06, 2022 : Initial Release
//# *  Update     : Sep 19, 2022 : Alerts addition, Improved labels, Naked PoC option, Bug correction
//# *
//# * ══════════════════════════════════════════════════════════════════════════════════════════════
// ══════════════════════════════════════════════════════════════════════════════════════════════════ //

// ---------------------------------------------------------------------------------------------- //
// Functions  ----------------------------------------------------------------------------------- //

f_drawOnlyLineX(_x1, _y1, _x2, _y2, _xloc, _extend, _color, _style, _width) =>
    id = line.new(_x1, _y1, _x2, _y2, _xloc, _extend, _color, _style, _width)

f_drawLineX(_x1, _y1, _x2, _y2, _xloc, _extend, _color, _style, _width) =>
    var id = line.new(_x1, _y1, _x2, _y2, _xloc, _extend, _color, _style, _width)
    line.set_xy1(id, _x1, _y1)
    line.set_xy2(id, _x2, _y2)
    line.set_color(id, _color)
    id

f_drawOnlyBoxX(_left, _top, _right, _bottom, _border_color, _border_width, _border_style) =>
    box.new(_left, _top, _right, _bottom, _border_color, _border_width, _border_style, bgcolor=_border_color)

f_drawOnlyLabelX(_x, _y, _text, _xloc, _yloc, _color, _style, _textcolor, _size, _textalign, _tooltip) =>
    label.new(_x, _y, _text, _xloc, _yloc, _color, _style, _textcolor, _size, _textalign, _tooltip)

f_drawLabelX(_x, _y, _text, _xloc, _yloc, _color, _style, _textcolor, _size, _textalign, _tooltip) =>
    var id = label.new(_x, _y, _text, _xloc, _yloc, _color, _style, _textcolor, _size, _textalign, _tooltip)
    label.set_xy(id, _x, _y)
    label.set_text(id, _text)
    label.set_tooltip(id, _tooltip)

f_getHighLow(_len, _calc, _offset) =>
    if _calc
        htf_l = low [_offset]
        htf_h = high[_offset]
        vol   = 0.

        for x = 0 to _len - 1
            htf_l := math.min(low [_offset + x], htf_l)
            htf_h := math.max(high[_offset + x], htf_h)
            vol += volume[_offset + x]

        htf_l := math.min(low [_offset + _len], htf_l)
        htf_h := math.max(high[_offset + _len], htf_h)

        [htf_h, htf_l, vol]


// check for box breaches - code snippet from pine user guide
f_checkBreaches(arrayOfBoxes, extend) =>
    int qtyOfBoxes = array.size(arrayOfBoxes)
    for boxNo = 0 to (qtyOfBoxes > 0 ? qtyOfBoxes - 1 : na)
        if boxNo < array.size(arrayOfBoxes)
            box   currentBox    = array.get(arrayOfBoxes, boxNo)
            float boxMidLevel   = math.avg(box.get_bottom(currentBox), box.get_top(currentBox))
            bool  boxWasCrossed = math.sign(close[1] - boxMidLevel) != math.sign(close - boxMidLevel)
            bool  boxWasTouched = math.sign(close[1] - boxMidLevel) != math.sign(low - boxMidLevel) or math.sign(close[1] - boxMidLevel) != math.sign(high - boxMidLevel)

            if boxWasCrossed and extend == 'Until Bar Cross'
                array.remove(arrayOfBoxes, boxNo)
                int(na)
            else if boxWasTouched and extend == 'Until Bar Touch'
                array.remove(arrayOfBoxes, boxNo)
                int(na)
            else
                box.set_right(currentBox, bar_index)
                int(na)

// Functions  ----------------------------------------------------------------------------------- //
// ---------------------------------------------------------------------------------------------- //

indicator("Volume Profile, Pivot Anchored by DGT", "VP-PA ʙʏ DGT ☼☾", true, max_bars_back = 5000, max_boxes_count = 500)//, max_lines_count = 100, max_labels_count = 100)

// ---------------------------------------------------------------------------------------------- //
// Inputs --------------------------------------------------------------------------------------- //

group_volume_profile    = 'Pivot Points Volume Profile'

tooltip_pvt       = 'The Pivot Points High Low indicator is used to determine and anticipate potential changes in market price and reversals\n' +
                     '\'Volume Profile, Pivot Points Anchored\' Custom indicator addtionally calculates the trading activity between two Pivot Points'
pvtLength         = input.int(20, "Pivot Points Left/Right Length", minval=1, group = group_volume_profile, tooltip = tooltip_pvt)

tooltip_vp        = 'Common Interest Profile (Total Volume) - displays total trading activity over a specified time period at specific price levels'
volumeProfile     = input.bool(true, 'Volume Profile (Common Interest)'             , inline='BB3', group = group_volume_profile, tooltip = tooltip_vp)
totalVolumeColor  = input.color(color.new(#fbc02d, 35), ''                          , inline='BB3', group = group_volume_profile)
vaVolumeColor     = input.color(color.new(#434651, 35), ''                          , inline='BB3', group = group_volume_profile)

tooltip_va        = 'Value Area (VA) – The range of price levels in which a specified percentage of all volume was traded during the time period'
isValueArea       = input.float(68, "Value Area Volume %", minval = 0, maxval = 100               , group = group_volume_profile, tooltip = tooltip_va) / 100

tooltip_poc       = 'Point of Control (POC) - The price level for the time period with the highest traded volume'
pointOfControl    = input.bool(true, 'Point of Control (PoC)'                       , inline='PoC', group = group_volume_profile, tooltip = tooltip_poc)
pocColor          = input.color(color.new(#ff0000, 0), ''                           , inline='PoC', group = group_volume_profile)
pocExtend         = input.string('None', 'Extend Point of Control (PoC)', options=['Until Last Bar', 'Until Bar Cross', 'Until Bar Touch', 'None'], group = group_volume_profile)

tooltip_vah       = 'Value Area High (VAH) - The highest price level within the value area'
valueAreaHigh     = input.bool(true, 'Value Area High (VAH)'                        , inline='VAH', group = group_volume_profile, tooltip = tooltip_vah)
vahColor          = input.color(color.new(#2962ff, 0), ''                           , inline='VAH', group = group_volume_profile)

tooltip_val       = 'Value Area Low (VAL) - The lowest price level within the value area'
valueAreaLow      = input.bool(true, 'Value Area Low (VAL) '                        , inline='VAL', group = group_volume_profile, tooltip = tooltip_val)
valColor          = input.color(color.new(#2962ff, 0), ''                           , inline='VAL', group = group_volume_profile)

vaBackground      = input.bool(true, 'Background Fill of Value Area (VA)'           , inline='vBG', group = group_volume_profile)
vaBackgroundColor = input.color(color.new(#2962ff, 89), ''                          , inline='vBG', group = group_volume_profile)

levels            = input.string('Pivot Points', 'Level Labels', options = ['Pivot Points', 'Profile High/Low', 'Value Area High/Low'], group = group_volume_profile)
pvtPrice          = input(true, "Price", inline = 'Levels', group=group_volume_profile)
pvtChange         = input(true, "Price Change", inline = 'Levels', group=group_volume_profile)
pvtVolume         = input(true, "Cumulative Volume", inline = 'Levels', group=group_volume_profile)

profileLevels     = input.int(25, 'Number of Rows' , minval = 10, maxval = 100 , step = 1         , group = group_volume_profile)
profilePlacement  = input.string('Left', 'Placment', options = ['Right', 'Left']                  , group = group_volume_profile)
profileWidth      = input.int(30, 'Profile Width %', minval = 0, maxval = 100                     , group = group_volume_profile) / 100
backgroundFill    = input.bool(true, 'Background Fill of Profile Range'             , inline ='BG', group = group_volume_profile)
backgroundColor   = input.color(color.new(#2962ff, 95), ''                          , inline ='BG', group = group_volume_profile)

tooltip_vwcb      = 'Colors bars based on the bar\'s volume relative to volume moving average'
group_vwcb        = 'Volume Weighted Colored Bars'
vwcb              = input.bool(true, 'Volume Weighted Colored Bars', group=group_vwcb, tooltip = tooltip_vwcb)

// ---------------------------------------------------------------------------------------------- //
// Definitions ---------------------------------------------------------------------------------- //

barPriceLow       = low
barPriceHigh      = high
bullCandle        = close > open
nzVolume          = nz(volume)

volumeStorageT    = array.new_float(profileLevels + 1, 0.)

var a_poc         = array.new_box()

var x1            = 0
var x2            = 0
var levelAbovePoc = 0
var levelBelowPoc = 0
var pvtHigh1      = 0.
var pvtLow1       = 0.
var pvtLast       = ''

// Definitions ---------------------------------------------------------------------------------- //
// ---------------------------------------------------------------------------------------------- //
// Calculations --------------------------------------------------------------------------------- //

pvtHigh  = ta.pivothigh(pvtLength, pvtLength)
pvtLow   = ta.pivotlow (pvtLength, pvtLength)
proceed  = not na(pvtHigh) or not na(pvtLow)

if proceed
    x1 := x2
    x2 := bar_index

if not na(pvtHigh)
    pvtHigh1 := pvtHigh
    pvtLast  := 'H'

if not na(pvtLow)
    pvtLow1  := pvtLow
    pvtLast  := 'L'


profileLength = x2 - x1

[priceHighest, priceLowest, tradedVolume] = f_getHighLow(profileLength, proceed, pvtLength)
priceStep = (priceHighest - priceLowest) / profileLevels

if proceed and nzVolume and priceStep > 0 and bar_index > profileLength and profileLength > 0

    for barIndexx = 1 to profileLength
        level = 0
        barIndex = barIndexx + pvtLength

        for priceLevel = priceLowest to priceHighest by priceStep
            if barPriceHigh[barIndex] >= priceLevel and barPriceLow[barIndex] < priceLevel + priceStep
                array.set(volumeStorageT, level, array.get(volumeStorageT, level) + nzVolume[barIndex] * ((barPriceHigh[barIndex] - barPriceLow[barIndex]) == 0 ? 1 : priceStep / (barPriceHigh[barIndex] - barPriceLow[barIndex])) )
            level += 1

    pocLevel          = array.indexof(volumeStorageT, array.max(volumeStorageT))
    totalVolumeTraded = array.sum(volumeStorageT) * isValueArea
    valueArea         = array.get(volumeStorageT, pocLevel)
    levelAbovePoc    := pocLevel
    levelBelowPoc    := pocLevel

    while valueArea < totalVolumeTraded
        if levelBelowPoc == 0 and levelAbovePoc == profileLevels - 1
            break

        volumeAbovePoc = 0.
        if levelAbovePoc < profileLevels - 1
            volumeAbovePoc := array.get(volumeStorageT, levelAbovePoc + 1)

        volumeBelowPoc = 0.
        if levelBelowPoc > 0
            volumeBelowPoc := array.get(volumeStorageT, levelBelowPoc - 1)

        if volumeBelowPoc == 0 and volumeAbovePoc == 0
            break

        if volumeAbovePoc >= volumeBelowPoc
            valueArea     += volumeAbovePoc
            levelAbovePoc += 1
        else
            valueArea     += volumeBelowPoc
            levelBelowPoc -= 1

    for level = 0 to profileLevels - 1
        if volumeProfile
            startBoxIndex = profilePlacement == 'Right' ? bar_index - int(array.get(volumeStorageT, level) / array.max(volumeStorageT) * profileLength * profileWidth)  : bar_index - profileLength
            endBoxIndex   = profilePlacement == 'Right' ? bar_index  :  startBoxIndex + int( array.get(volumeStorageT, level) / array.max(volumeStorageT) * profileLength * profileWidth)
            f_drawOnlyBoxX(startBoxIndex - pvtLength, priceLowest + (level + 0.1) * priceStep, endBoxIndex - pvtLength, priceLowest + (level + 0.9) * priceStep, level >= levelBelowPoc and level <= levelAbovePoc ? totalVolumeColor : vaVolumeColor, 1, line.style_solid)

    if backgroundFill
        f_drawOnlyBoxX(bar_index[pvtLength] - profileLength, priceHighest, bar_index[pvtLength], priceLowest, backgroundColor, 1, line.style_dotted)

    if pointOfControl
        array.push(a_poc, box.new(bar_index[pvtLength] - profileLength, priceLowest + (array.indexof(volumeStorageT, array.max(volumeStorageT)) + .40) * priceStep, bar_index[pvtLength], priceLowest + (array.indexof(volumeStorageT, array.max(volumeStorageT)) + .60) * priceStep, pocColor, bgcolor = pocColor ))

    vah = f_drawOnlyLineX(bar_index[pvtLength] - profileLength, priceLowest + (levelAbovePoc + 1.00) * priceStep, bar_index[pvtLength], priceLowest + (levelAbovePoc + 1.00) * priceStep, xloc.bar_index, extend.none, valueAreaHigh ? vahColor : #00000000, line.style_solid, 2)
    val = f_drawOnlyLineX(bar_index[pvtLength] - profileLength, priceLowest + (levelBelowPoc + 0.00) * priceStep, bar_index[pvtLength], priceLowest + (levelBelowPoc + 0.00) * priceStep, xloc.bar_index, extend.none, valueAreaLow  ? valColor : #00000000, line.style_solid, 2)

    if vaBackground
        linefill.new(vah, val, vaBackgroundColor)

    statTip = '\n -Traded Volume : ' + str.tostring(tradedVolume, format.volume) + ' (' + str.tostring(profileLength - 1) + ' bars)' +
                   '\n  *Average Volume/Bar : ' + str.tostring(tradedVolume / (profileLength - 1), format.volume) +
                   '\n\nProfile High : ' + str.tostring(priceHighest, format.mintick) + ' ↑ %' + str.tostring((priceHighest - priceLowest) / priceLowest  * 100, '#.##') +
                   '\nProfile Low : '  + str.tostring(priceLowest, format.mintick) + ' ↓ %' + str.tostring((priceHighest - priceLowest) / priceHighest  * 100, '#.##') +
                   '\n -Point Of Control : ' + str.tostring(priceLowest + (array.indexof(volumeStorageT, array.max(volumeStorageT)) + .50) * priceStep, format.mintick) +
                   '\n\nValue Area High : ' + str.tostring(priceLowest + (levelAbovePoc + 1.00) * priceStep, format.mintick) +
                   '\nValue Area Low : '  + str.tostring(priceLowest + (levelBelowPoc + 0.00) * priceStep, format.mintick) +
                   '\n -Value Area Width : %' + str.tostring(((priceLowest + (levelAbovePoc + 1.00) * priceStep) - (priceLowest + (levelBelowPoc + 0.00) * priceStep)) / (priceHighest - priceLowest) * 100, '#.##') +
                   '\n\nNumber of Bars (Profile) : ' + str.tostring(profileLength)

    if levels != 'Pivot Points'
        upperPriceLevel = levels == 'Value Area High/Low' ? priceLowest + (levelAbovePoc + 1.00) * priceStep : priceHighest
        lowerPriceLevel = levels == 'Value Area High/Low' ? priceLowest + (levelBelowPoc + 0.00) * priceStep : priceLowest

        upperText = (pvtPrice ? str.tostring(upperPriceLevel, format.mintick) : '') + (not na(pvtHigh) ? (pvtChange ? (pvtPrice ? ' ↑ %' : '↑ %') + str.tostring((pvtHigh - pvtLow1) * 100 / pvtLow1 , '#.##') : '') + (pvtVolume ? (pvtPrice or pvtChange ? '\n' : '') + str.tostring(tradedVolume, format.volume) : '') : '')
        lowerText = (pvtPrice ? str.tostring(lowerPriceLevel, format.mintick) : '') + (not na(pvtLow) ? (pvtChange ? (pvtPrice ? ' ↓ %' : '↓ %') + str.tostring((pvtHigh1 - pvtLow) * 100 / pvtHigh1, '#.##') : '') + (pvtVolume ? (pvtPrice or pvtChange ? '\n' : '') + str.tostring(tradedVolume, format.volume) : '') : '')

        f_drawOnlyLabelX(bar_index[pvtLength] - profileLength / 2, upperPriceLevel, upperText, xloc.bar_index, yloc.price, (upperText != '' ? chart.fg_color : #00000000), label.style_label_down, chart.bg_color, size.normal, text.align_center, 'Profile High : ' + str.tostring(priceHighest, format.mintick) + '\n %' + str.tostring((priceHighest - priceLowest) / priceLowest  * 100, '#.##') + ' higher than the Profile Low' + statTip )
        f_drawOnlyLabelX(bar_index[pvtLength] - profileLength / 2, lowerPriceLevel, lowerText, xloc.bar_index, yloc.price, (lowerText != '' ? chart.fg_color : #00000000), label.style_label_up  , chart.bg_color , size.normal, text.align_center, 'Profile Low : '  + str.tostring(priceLowest, format.mintick)  + '\n %' + str.tostring((priceHighest - priceLowest) / priceHighest * 100, '#.##') + ' lower than the Profile High' + statTip )
    else
        if not na(pvtHigh)
            f_drawOnlyLabelX(bar_index[pvtLength], pvtHigh, (pvtPrice ? str.tostring(pvtHigh, format.mintick) : '') + (pvtChange ? (pvtPrice ? ' ↑ %' : '↑ %') + str.tostring((pvtHigh - pvtLow1) * 100 / pvtLow1 , '#.##') : '') + (pvtVolume ? (pvtPrice or pvtChange ? '\n' : '') + str.tostring(tradedVolume, format.volume) : ''), xloc.bar_index, yloc.price, chart.fg_color, label.style_label_down, chart.bg_color, (not pvtPrice and not pvtChange and not pvtVolume ? size.tiny : size.normal), text.align_center, 'Pivot High : ' + str.tostring(pvtHigh, format.mintick) + '\n -Price Change : %' + str.tostring((pvtHigh - pvtLow1) * 100 / pvtLow1 , '#.##') + statTip)
        if not na(pvtLow)
            f_drawOnlyLabelX(bar_index[pvtLength], pvtLow , (pvtPrice ? str.tostring(pvtLow , format.mintick) : '') + (pvtChange ? (pvtPrice ? ' ↓ %' : '↓ %') + str.tostring((pvtHigh1 - pvtLow) * 100 / pvtHigh1, '#.##') : '') + (pvtVolume ? (pvtPrice or pvtChange ? '\n' : '') + str.tostring(tradedVolume, format.volume) : ''), xloc.bar_index, yloc.price, chart.fg_color, label.style_label_up  , chart.bg_color, (not pvtPrice and not pvtChange and not pvtVolume ? size.tiny : size.normal), text.align_center, 'Pivot Low : ' + str.tostring(pvtLow, format.mintick) + '\n -Price Change : %' + str.tostring((pvtHigh1 - pvtLow) * 100 / pvtHigh1, '#.##') + statTip)

if pointOfControl and pocExtend != 'None'
    f_checkBreaches(a_poc, pocExtend)

var a_profileD    = array.new_box()
profileLength    := barstate.islast ? last_bar_index - x2 + pvtLength  : 1
priceHighest     := ta.highest(high, profileLength > 0 ? profileLength + 1 : 1)
priceLowest      := ta.lowest (low , profileLength > 0 ? profileLength + 1 : 1)
priceStep        := (priceHighest - priceLowest) / profileLevels
var pocLevel      = 0

[_, _, tradedVolume1] = f_getHighLow(profileLength, true, 0)


if barstate.islast and nzVolume and profileLength > 0 and priceStep > 0

    if array.size(a_profileD) > 0
        for i = 0 to array.size(a_profileD) - 1
            box.delete(array.shift(a_profileD))

    for barIndex = 1 to profileLength
        level = 0

        for priceLevel = priceLowest to priceHighest by priceStep
            if barPriceHigh[barIndex] >= priceLevel and barPriceLow[barIndex] < priceLevel + priceStep
                array.set(volumeStorageT, level, array.get(volumeStorageT, level) + nzVolume[barIndex] * ((barPriceHigh[barIndex] - barPriceLow[barIndex]) == 0 ? 1 : priceStep / (barPriceHigh[barIndex] - barPriceLow[barIndex])) )
            level += 1

    pocLevel          := array.indexof(volumeStorageT, array.max(volumeStorageT))
    totalVolumeTraded = array.sum(volumeStorageT) * isValueArea
    valueArea         = array.get(volumeStorageT, pocLevel)
    levelAbovePoc    := pocLevel
    levelBelowPoc    := pocLevel

    while valueArea < totalVolumeTraded
        if levelBelowPoc == 0 and levelAbovePoc == profileLevels - 1
            break

        volumeAbovePoc = 0.
        if levelAbovePoc < profileLevels - 1
            volumeAbovePoc := array.get(volumeStorageT, levelAbovePoc + 1)

        volumeBelowPoc = 0.
        if levelBelowPoc > 0
            volumeBelowPoc := array.get(volumeStorageT, levelBelowPoc - 1)

        if volumeBelowPoc == 0 and volumeAbovePoc == 0
            break

        if volumeAbovePoc >= volumeBelowPoc
            valueArea     += volumeAbovePoc
            levelAbovePoc += 1
        else
            valueArea     += volumeBelowPoc
            levelBelowPoc -= 1

    for level = 0 to profileLevels - 1
        if volumeProfile
            startBoxIndex = profilePlacement == 'Right' ? bar_index - int(array.get(volumeStorageT, level) / array.max(volumeStorageT) * profileLength * profileWidth)  : bar_index - profileLength
            endBoxIndex   = profilePlacement == 'Right' ? bar_index  :  startBoxIndex + int( array.get(volumeStorageT, level) / array.max(volumeStorageT) * profileLength * profileWidth)
            array.push(a_profileD, box.new(startBoxIndex, priceLowest + (level + 0.1) * priceStep, endBoxIndex, priceLowest + (level + 0.9) * priceStep, level >= levelBelowPoc and level <= levelAbovePoc ? totalVolumeColor : vaVolumeColor, bgcolor = level >= levelBelowPoc and level <= levelAbovePoc ? totalVolumeColor : vaVolumeColor ))

    if backgroundFill
        array.push(a_profileD, box.new(bar_index - profileLength, priceHighest, bar_index, priceLowest, backgroundColor, bgcolor = backgroundColor ))

    if pointOfControl
        array.push(a_profileD, box.new(bar_index - profileLength, priceLowest + (pocLevel + .40) * priceStep, bar_index, priceLowest + (pocLevel + .60) * priceStep, pocColor, bgcolor = pocColor ))

    vah = f_drawLineX(bar_index - profileLength, priceLowest + (levelAbovePoc + 1.00) * priceStep, bar_index, priceLowest + (levelAbovePoc + 1.00) * priceStep, xloc.bar_index, extend.none, valueAreaHigh ? vahColor : #00000000, line.style_solid, 2)
    val = f_drawLineX(bar_index - profileLength, priceLowest + (levelBelowPoc + 0.00) * priceStep, bar_index, priceLowest + (levelBelowPoc + 0.00) * priceStep, xloc.bar_index, extend.none, valueAreaLow  ? valColor : #00000000, line.style_solid, 2)

    if vaBackground
        linefill.new(vah, val, vaBackgroundColor)

    if levels != 'Pivot Points'
        statTip = '\n -Traded Volume : ' + str.tostring(tradedVolume1, format.volume) + ' (' + str.tostring(profileLength - 1) + ' bars)' +
                   '\n  *Average Volume/Bar : ' + str.tostring(tradedVolume1 / (profileLength - 1), format.volume) +
                   '\n\nProfile High : ' + str.tostring(priceHighest, format.mintick) + ' ↑ %' + str.tostring((priceHighest - priceLowest) / priceLowest  * 100, '#.##') +
                   '\nProfile Low : '  + str.tostring(priceLowest, format.mintick) + ' ↓ %' + str.tostring((priceHighest - priceLowest) / priceHighest  * 100, '#.##') +
                   '\n -Point Of Control : ' + str.tostring(priceLowest + (array.indexof(volumeStorageT, array.max(volumeStorageT)) + .50) * priceStep, format.mintick) +
                   '\n\nValue Area High : ' + str.tostring(priceLowest + (levelAbovePoc + 1.00) * priceStep, format.mintick) +
                   '\nValue Area Low : '  + str.tostring(priceLowest + (levelBelowPoc + 0.00) * priceStep, format.mintick) +
                   '\n -Value Area Width : %' + str.tostring(((priceLowest + (levelAbovePoc + 1.00) * priceStep) - (priceLowest + (levelBelowPoc + 0.00) * priceStep)) / (priceHighest - priceLowest) * 100, '#.##') +
                   '\n\nNumber of Bars (Profile) : ' + str.tostring(profileLength) +
                   (pvtChange ? '\n\n*price change caculated based on last pivot high/low and last price' : '')

        upperPriceLevel = levels == 'Value Area High/Low' ? priceLowest + (levelAbovePoc + 1.00) * priceStep : priceHighest
        lowerPriceLevel = levels == 'Value Area High/Low' ? priceLowest + (levelBelowPoc + 0.00) * priceStep : priceLowest

        upperText = (pvtPrice ? str.tostring(upperPriceLevel, format.mintick) : '') + (pvtLast == 'L' ? (pvtChange ? (pvtPrice ? ' ↑ %' : '↑ %') + str.tostring((close - pvtLow1) * 100 / pvtLow1 , '#.##') + '*' : '') + (pvtVolume ? (pvtPrice or pvtChange ? '\n' : '') + str.tostring(tradedVolume1, format.volume) : '') : '')
        lowerText = (pvtPrice ? str.tostring(lowerPriceLevel, format.mintick) : '') + (pvtLast == 'H' ? (pvtChange ? (pvtPrice ? ' ↓ %' : '↓ %') + str.tostring((pvtHigh1 - close) * 100 / pvtHigh1, '#.##') + '*' : '') + (pvtVolume ? (pvtPrice or pvtChange ? '\n' : '') + str.tostring(tradedVolume1, format.volume) : '') : '')

        f_drawLabelX(bar_index - profileLength / 2, upperPriceLevel, upperText, xloc.bar_index, yloc.price, (upperText != '' ? chart.fg_color : #00000000), label.style_label_down, chart.bg_color, size.normal, text.align_center, 'Profile High : ' + str.tostring(priceHighest, format.mintick) + '\n %' + str.tostring((priceHighest - priceLowest) / priceLowest  * 100, '#.##') + ' higher than the Profile Low' + statTip )
        f_drawLabelX(bar_index - profileLength / 2, lowerPriceLevel, lowerText, xloc.bar_index, yloc.price, (lowerText != '' ? chart.fg_color : #00000000), label.style_label_up  , chart.bg_color, size.normal, text.align_center, 'Profile Low : '  + str.tostring(priceLowest, format.mintick)  + '\n %' + str.tostring((priceHighest - priceLowest) / priceHighest * 100, '#.##') + ' lower than the Profile High' + statTip )

//plot(barstate.islast ? priceLowest + (array.indexof(volumeStorageT, array.max(volumeStorageT)) + .50) * priceStep : na, 'Developing PoC', pocColor, display=display.none)
//plot(barstate.islast ? priceLowest + (levelAbovePoc + 1.00) * priceStep : na, 'Developing VAH', vahColor, display=display.none)
//plot(barstate.islast ? priceLowest + (levelBelowPoc + 0.00) * priceStep : na, 'Developing VAL', valColor, display=display.none)
// ---------------------------------------------------------------------------------------------- //
// Volume Weighted Colored Bars ----------------------------------------------------------------- //

group_volume_weighted_colored_bars      = 'Volume Weighted Colored Bars'
vSMA = ta.sma(nzVolume, input.int(89, 'Volume Moving Average Length', group=group_volume_weighted_colored_bars))
upThesh = input.float(1.618, 'Bold Bars avbove Volume Average * ', minval=1., step=.1, group=group_volume_weighted_colored_bars)
barcolor(vwcb and nzVolume ? nzVolume > vSMA * upThesh ? open < close ? #00be9f : #ff0015 : nzVolume < vSMA * input.float(0.618, 'Light Bars below Volume Average * ', minval=.1, step=.1, group=group_volume_weighted_colored_bars) ? open < close ? #ffffff00 : #14141400 : open < close ? #08998188 : #f7526081 : na, title='Volume Weighted Colored Bars', editable = false)

// Volume Weighted Colored Bars ----------------------------------------------------------------- //
// ---------------------------------------------------------------------------------------------- //
// Alerts --------------------------------------------------------------------------------------- //

priceTxt  = str.tostring(close, format.mintick)
tickerTxt = syminfo.ticker

if ta.cross(close, priceLowest + (pocLevel + .50) * priceStep) and pointOfControl
    alert(tickerTxt + ' : Pivots Volume Profile : Price touches/crosses Point Of Control Line, price ' + priceTxt)

if ta.cross(close, priceLowest + (levelAbovePoc + 1.00) * priceStep) and valueAreaHigh
    alert(tickerTxt + ' : Pivots Volume Profile : Price touches/crosses Value Area High Line, price '  + priceTxt)

if ta.cross(close, priceLowest + (levelBelowPoc + 0.00) * priceStep) and valueAreaLow
    alert(tickerTxt + ' : Pivots Volume Profile : Price touches/crosses Value Area Low Line, price '   + priceTxt)

if nzVolume > vSMA * upThesh and vwcb
    alert(tickerTxt + ' high volume, price ' + priceTxt)

// Alerts --------------------------------------------------------------------------------------- //
// ---------------------------------------------------------------------------------------------- //

var table logo = table.new(position.bottom_right, 1, 1)
if barstate.islast
    table.cell(logo, 0, 0, '☼☾  ', text_size=size.normal, text_color=color.teal)
Indicators Insider
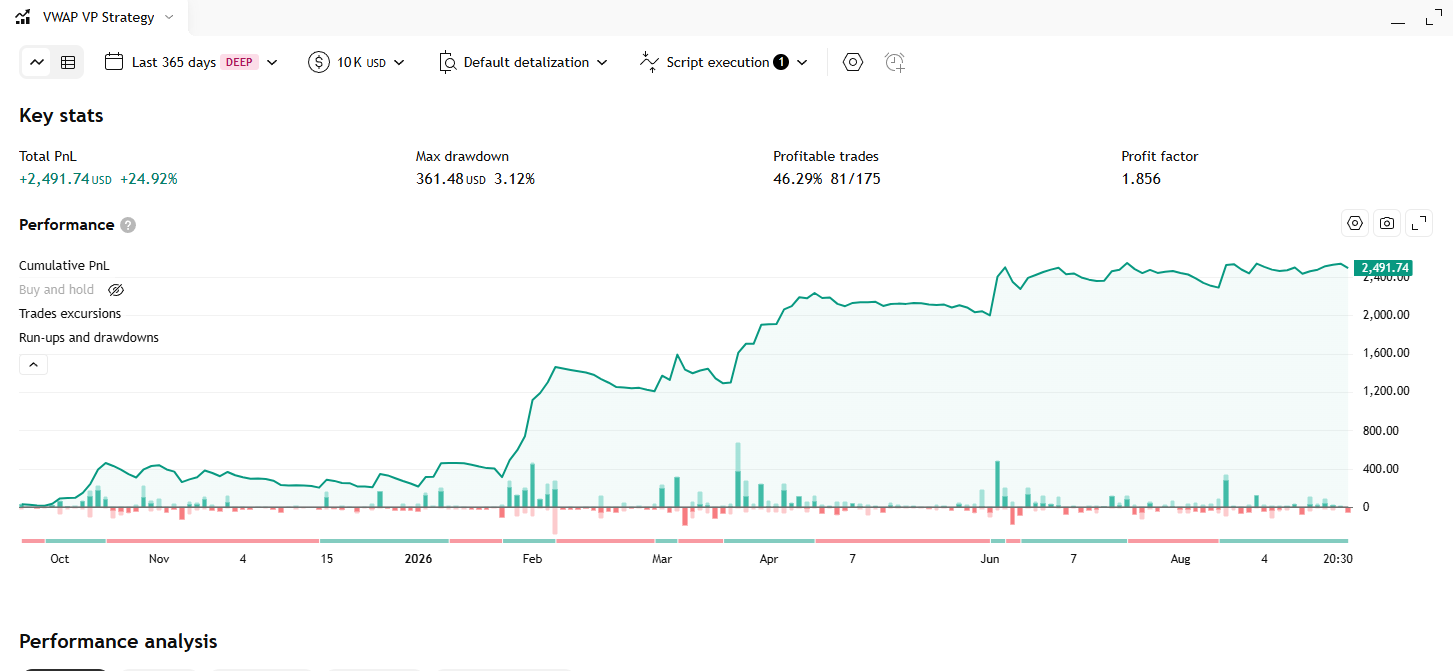
VWAP Volume Profile Indicator – Strategy
Một hồ sơ khối lượng hai chiều dựng trên đường VWAP thay vì trên giá: khối lượng của mỗi nến được gắn dấu cộng hoặc trừ tuỳ VWAP đang lên hay xuống, rồi gom lại thành biểu đồ cột nằm ngang chìa ra cả hai phía ở mép phải chart.
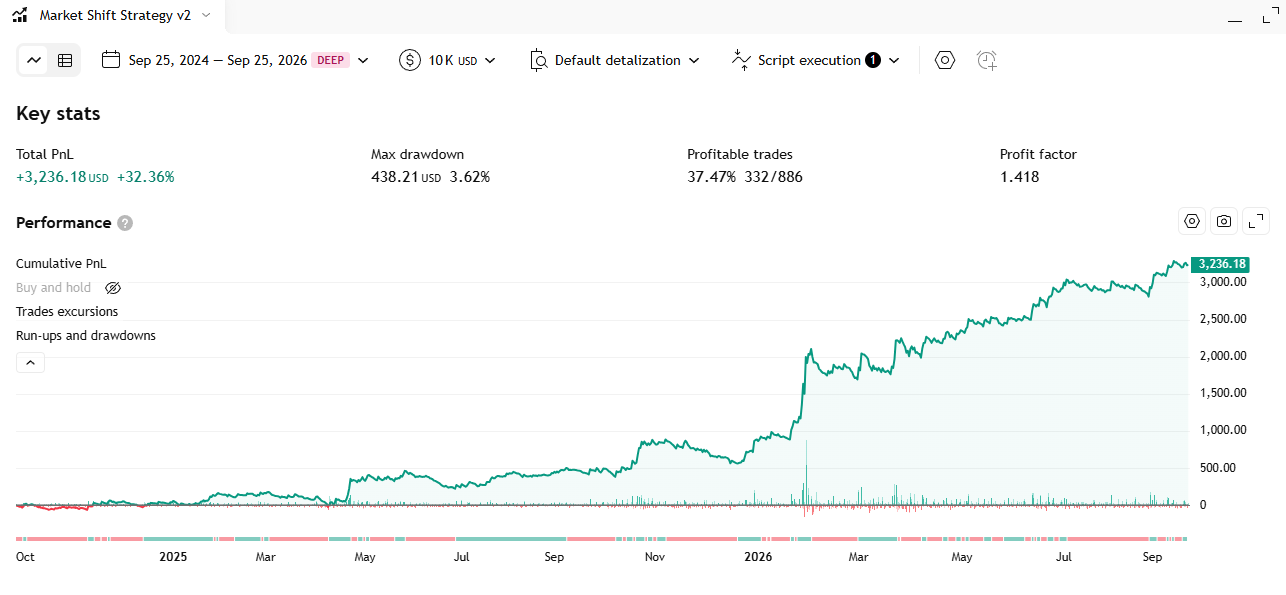
Market Shift Levels Indicator – Strategy
Every time the HMA moving average flips its slope, the indicator locks in the high or the low of that exact candle as a “boundary level”, colors every candle relative to it, and flags the moments price pokes through the level and immediately fails.
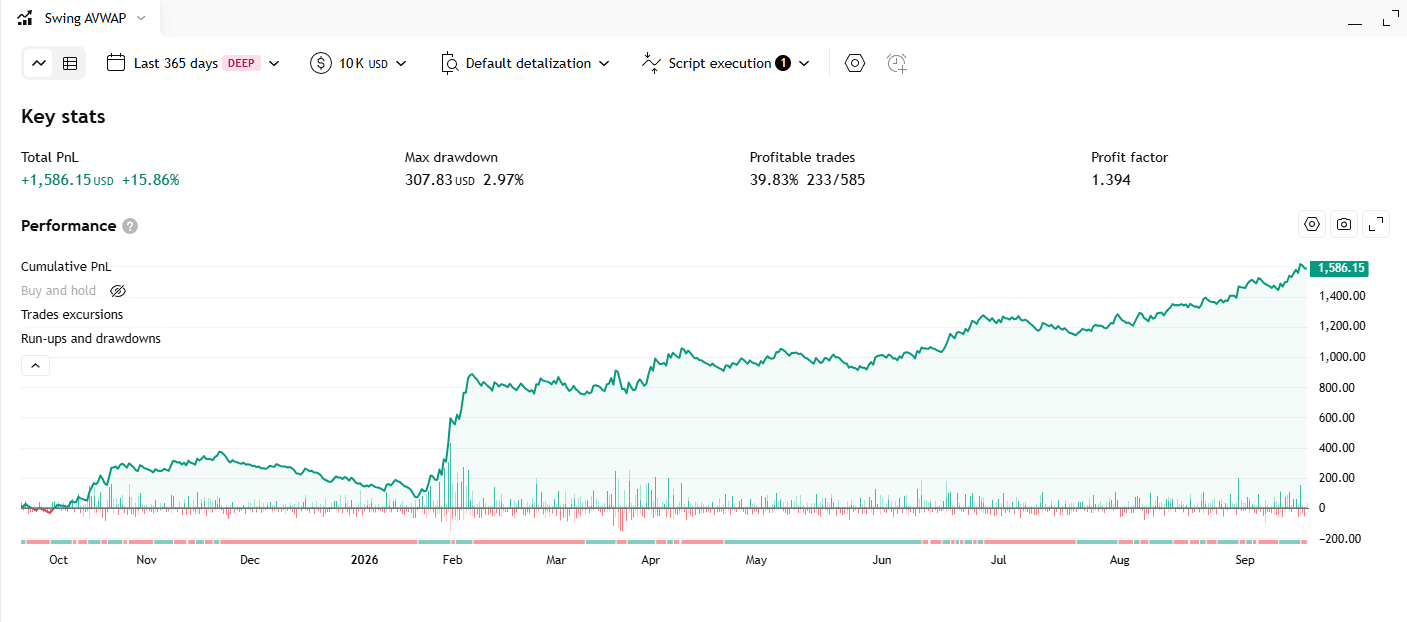
Dynamic Swing Anchored VWAP Indicator – Strategy
Automatically anchors a VWAP line to the most recent swing reversal point, rebuilds the whole line from that anchor every time market structure flips, and tags each anchor with an HH / HL / LH / LL structure label.