1. Dynamic Swing Anchored VWA Strategy Description
Automatically anchors a VWAP line to the most recent swing reversal point, rebuilds the whole line from that anchor every time market structure flips, and tags each anchor with an HH / HL / LH / LL structure label.
1.1 Indicator Concept
A classic VWAP (volume-weighted average price) is always anchored to a fixed point in time: session open, week open, month open. This indicator asks a different question: the anchor that actually matters to a trader is not "midnight", it is the point where the current price leg genuinely began — the most recent reversal low while the market is pushing up, or the most recent reversal high while it is pushing down.
- Why anchor to a swing: a VWAP measured from that exact low is the "average cost basis" of everyone who bought into this up-leg. When price returns to that line, a crowd that was in profit is back at breakeven — which is why reactions (adding, or bailing out) tend to cluster there.
- Second difference — no running total: a classic VWAP sums all price×volume since the anchor, so the longer the leg runs the more inert the line becomes, barely moving at all. This indicator replaces the running total with an exponentially weighted moving average (EWMA) on both the numerator (price×volume) and the denominator (volume), governed by a half-life parameter called APT — Adaptive Price Tracking. The result is a line that is still volume-weighted but keeps tracking price instead of freezing.
- Third difference (optional) — volatility self-scaling: when enabled, APT automatically shortens in volatile conditions (the line reacts faster) and lengthens in quiet conditions (the line smooths out), based on the ratio between current ATR and its own longer-run average.
1.2 Indicator Features
-
Display:
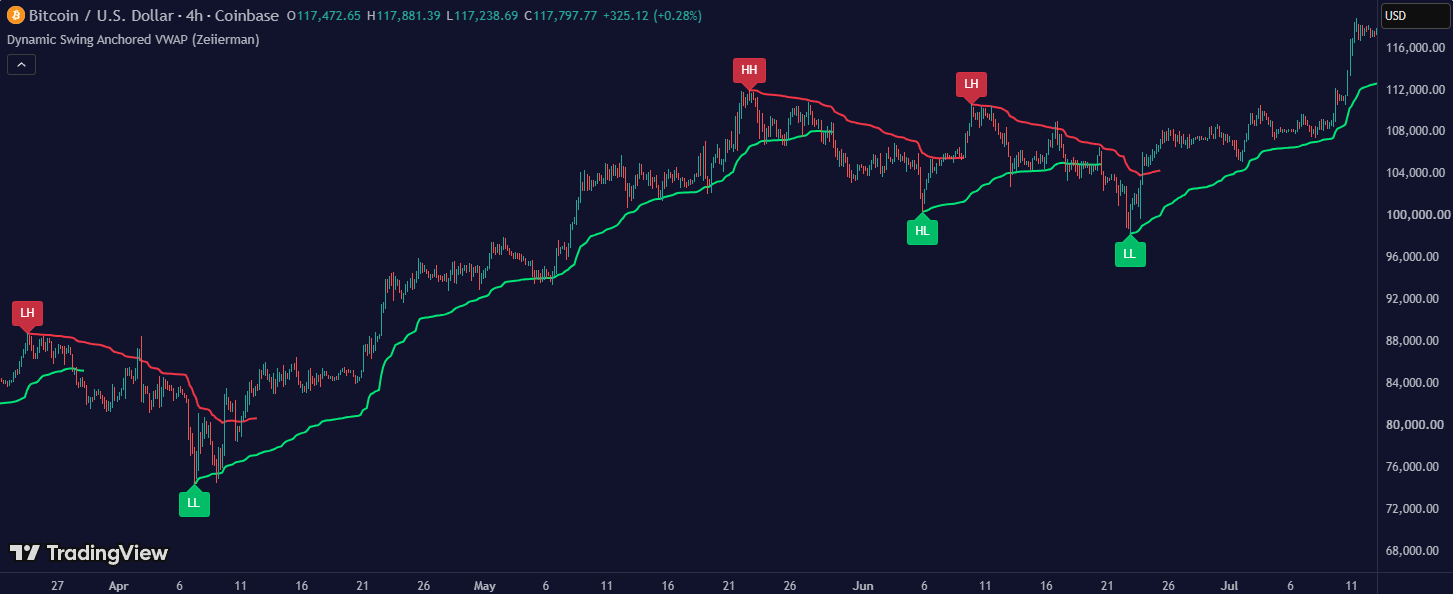
- Active VWAP line: a polyline that starts exactly at the anchoring swing point and extends to the current bar, gaining one new point per bar. This is the line you trade off.
- Frozen VWAP lines: every time structure flips, the line of the leg that just finished is left in place on the chart as a historical record while a brand new line starts from the new anchor. Over time the chart accumulates a chain of VWAP segments, one per swing leg.
- HH / HL / LH / LL structure labels: on every flip a label is dropped back onto the exact bar holding the anchoring swing point — a green up-pointing label at lows, a red down-pointing label at highs (default colors). The text tells you whether this low/high is above or below the previous one of the same kind: HH higher high, LH lower high, HL higher low, LL lower low.
- Alerts: The indicator declares NO alertcondition() — it is purely visual, with no built-in alerts.
1.3 How to Use the Indicator
- Treat the active line as the buyer/seller dividing line of the current leg: closes above the line while it is anchored at a low mean this leg's buyers are in profit — favour the long side. Closes below a line anchored at a high favour the short side.
- Enter on a pullback that touches the line and rejects: the standard play for any anchored VWAP — wait for price to retrace into the "average cost" zone, look for a rejection candle (long wick, reversal bar), then join the direction of the running leg.
- Read the label sequence to confirm the trend: consecutive HH plus HL means the uptrend is still healthy; consecutive LH plus LL means a downtrend. The first LH after a string of HHs, or the first HL after a string of LLs, is an early warning that structure is breaking.
- Use the frozen lines from previous legs as reference levels: their right-hand ends often line up with price areas the market still "remembers".
- Tune Swing Period to your timeframe: a large value (50 by default) produces fewer anchors but each one matters more — suited to swing trading. Small values (10–20) produce far more anchors and the line resets constantly — usable for scalping, but much noisier.
- Tune APT to the tracking behaviour you want: a small APT (5–10) glues the line to price, so it is rarely touched and offers few retest signals; a large APT (50–100) makes the line flat and far from price, closer to a classic VWAP, giving you a wider retest zone.
1.4 How the Indicator Works
Inputs & their role
- prd ("Swing Period", integer, default 50, minimum 2): how many bars decide whether a high/low counts as significant. A bar is registered as a new high when its high is the highest of the last prd bars. Example: on M5 with prd=50, the indicator only cares about highs/lows that dominate roughly the last 4 hours of trading. Drop it to 20 and the window shrinks to ~1h40 — highs and lows appear far more often, the VWAP gets re-anchored (reset) constantly and barely has time to form a meaningful segment.
- baseAPT ("Adaptive Price Tracking", float, default 20, minimum 1): this is the half-life, in bars, of the exponential average. Plainly: after exactly baseAPT bars, an old bar's influence on the line has decayed to half. The number is converted into the weight alpha given to the newest bar via alpha = 1 − e^(−ln2 / APT). Concrete example: APT=20 → alpha ≈ 0.0341 (each new bar is only 3.4% of the line); APT=5 → alpha ≈ 0.1294 (12.9% — the line hugs price so tightly it barely smooths anything); APT=100 → alpha ≈ 0.0069 (0.69% — the line is nearly flat, close to a cumulative VWAP).
- useAdapt ("Adapt APT by ATR ratio", checkbox, default OFF): when off, APT is a constant equal to baseAPT on every bar. When on, APT is recomputed bar by bar from market volatility (see Flow 4). Toggling it never moves the anchor point — it only changes how curved / how price-hugging the line is.
- volBias ("Volatility Bias", float, default 10.0, minimum 0.1, step 0.1): the exponent deciding how hard volatility bites — it only has any effect while useAdapt is ON. Formula: APT = baseAPT ÷ (ATR ratio)^volBias. Example at the default volBias=10: ATR only has to run 20% above its average (ratio 1.2) for the denominator to become 1.2¹⁰ ≈ 6.2 → APT drops from 20 to 3.2 and gets clamped at the floor of 5. Conversely ATR 20% below average (ratio 0.8) → 0.8¹⁰ ≈ 0.107 → APT jumps to 186. At volBias=1, that same 1.2 ratio only moves APT to 16.7 — far gentler.
- highS / lowS ("Swing Labels", two color swatches on one row, default lime / red): background color of the structure labels. The first swatch is used for labels placed at LOWS, the second for labels placed at HIGHS (see the technical notes — the tooltip naming in the source invites the opposite reading). Label colors are always 20% transparent and the text is always white.
- S / R ("VWAP Lines", two color swatches on one row, default lime / red): the color of the VWAP lines. See the technical notes: in practice an UP leg is drawn with the R swatch (red) and a DOWN leg with S (lime) — the reverse of what the original tooltips claim.
- xx (the number box at the end of the "VWAP Lines" row, integer, default 2, minimum 1): line thickness in pixels for every VWAP line. Raising it to 3–4 makes the line stand out against the candles but hides wick detail wherever the line cuts through price.
Main logic blocks
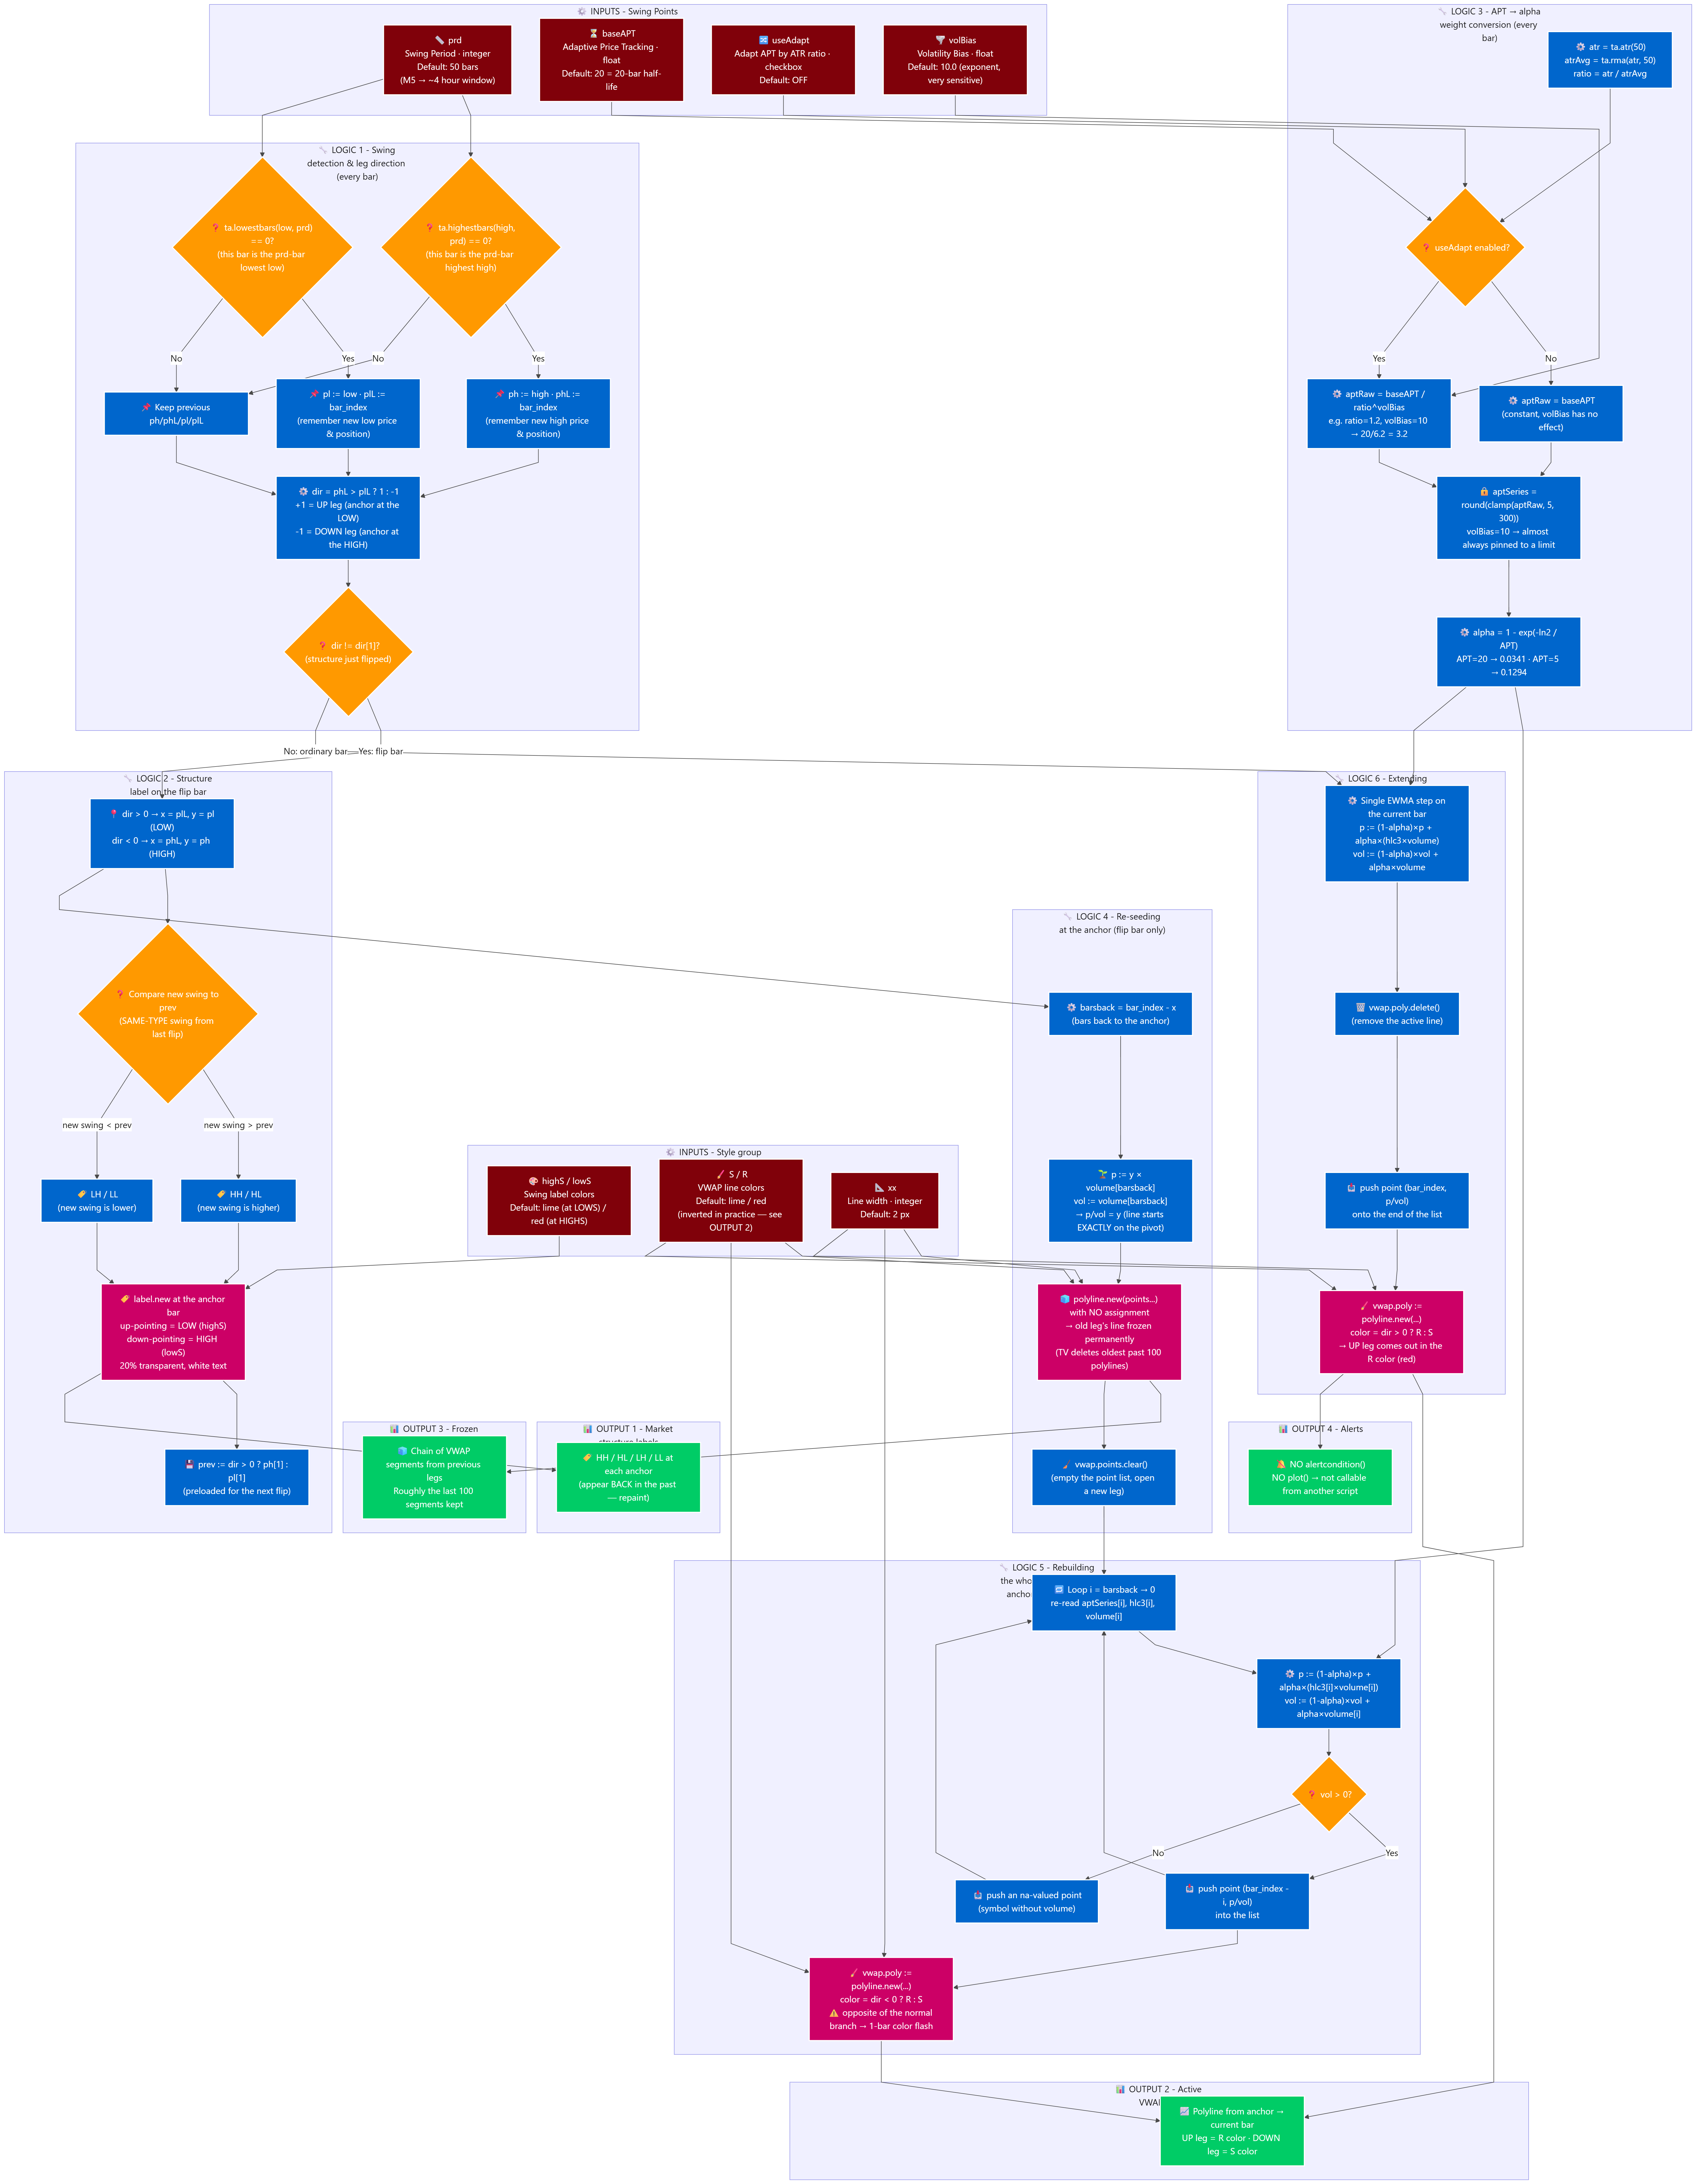
🏷️ Flow 1 — Detecting swings and identifying the current leg (runs on every bar)
- The indicator keeps four "sticky" variables (values carried across bars, only changed when a new event fires): ph = the most recent swing high price, phL = the bar number of that high, and pl / plL for lows.
- On each bar it asks: "is this bar's high the highest of the last prd bars?" (in code, ta.highestbars(high, prd) == 0). If yes → ph and phL are updated to the current bar. The mirror question for lows uses ta.lowestbars(low, prd) == 0.
- The leg direction dir is decided purely by which event happened more recently: dir = phL > plL ? 1 : −1. If the last new high is more recent than the last new low → dir = +1 → the market is in an UP leg, and the origin of that leg is the older LOW. Otherwise dir = −1 → a DOWN leg, originating from the older HIGH.
- Example: price keeps falling, every bar breaking the 50-bar low → plL updates continuously, dir = −1. Price bottoms at bar #1000 and rallies; by bar #1042 it exceeds the highest high of the previous 50 bars → phL = 1042 > plL = 1000 → dir flips to +1. That is the flip bar, and the anchor chosen is bar #1000 — 42 bars back in the past.
📍 Flow 2 — Handling the flip bar: dropping the structure label
- This whole block only executes on bars where dir differs from the previous bar (dir != dir[1]).
- Pick the anchor: if dir just became +1 → take the low's coordinates (x = plL, y = pl), draw an up-pointing label below the low in the highS color. If dir just became −1 → take the high's coordinates (x = phL, y = ph), draw a down-pointing label above the high in the lowS color.
- The label text is chosen by comparing the swing just locked in against prev, which holds the same-type swing point from the previous flip: anchoring at a low and the new low is lower → LL, higher → HL; anchoring at a high and the new high is lower → LH, higher → HH.
- Right after drawing, prev is loaded for the next flip: prev := dir > 0 ? ph[1] : pl[1]. Thanks to this alternation, the next comparison is always low-vs-low or high-vs-high, never mismatched.
🌱 Flow 3 — Re-seeding the VWAP at the anchor
- Compute the look-back distance: barsback = bar_index − x (42 bars in the example above).
- The two EWMA accumulators are reloaded from scratch using the anchor bar's own data: p := y × volume[barsback] (numerator) and vol := volume[barsback] (denominator). Dividing one by the other gives exactly y — meaning the very first point of the VWAP line sits precisely on the anchoring high/low, with no offset.
- The old leg's VWAP is "frozen": the code creates a new polyline from the existing point list but assigns it to nothing — it becomes an unmanaged drawing that stays on the chart permanently. The point list is then cleared so the new leg can start.
⚡ Flow 4 — Converting APT into the alpha weight (and the adaptive mode)
- Measure volatility: atr = ATR(50), atrAvg = RMA(atr, 50) (an average of the ATR itself), ratio = atr / atrAvg. A ratio above 1 means the market is livelier than usual.
- If useAdapt is OFF: aptRaw = baseAPT. If ON: aptRaw = baseAPT / ratio^volBias.
- The result is always clamped to [5 ; 300] and then rounded to an integer — which is exactly why an over-large volBias leaves APT pinned to one of the two limits most of the time.
- Finally it becomes a weight: alpha = 1 − e^(−ln2 / APT). The larger alpha is, the more the newest bar dominates and the tighter the line tracks price.
🔁 Flow 5 — Rebuilding the whole line from the anchor (flip bars only)
- The code runs a loop from the anchor bar forward to the current bar (i = barsback → 0). At each step i it reads that bar's own historical data: aptSeries[i], hlc3[i], volume[i] — so the adaptive APT is applied according to each past bar's own volatility, not with one single APT value for the whole segment.
- Each step updates the two accumulators with the EWMA formula: p := (1−alpha)×p + alpha×(hlc3[i]×volume[i]) and vol := (1−alpha)×vol + alpha×volume[i]. The VWAP value at that bar is p / vol, pushed into the point list.
- Numeric example: APT=20 → alpha=0.0341. At the anchor the line equals the low exactly, say 2600. The next bar has hlc3=2610 → the new line value ≈ 2600 + 0.0341×(2610−2600) ≈ 2600.34 (assuming comparable volume on both bars). It takes roughly 20 bars moving the same way for the line to cover half the distance to price.
- After the loop a fresh polyline is built from the full point list and assigned to vwap.poly — this is the "active" line, the only one the indicator can still delete and redraw on later bars.
➕ Flow 6 — Extending the line on ordinary (non-flip) bars
- Just one EWMA step using the current bar's data: p := (1−alpha)×p + alpha×(hlc3×volume), vol := (1−alpha)×vol + alpha×volume, vap = p / vol.
- The active polyline is deleted, the new point is appended to the list, and the polyline is redrawn from the list that is now one point longer. Visually, the user simply sees the line grow one segment at its right-hand tip.
- Because every old point stays in the list untouched, the older portion of the line does not change — only the final segment is new.
Outputs & their role in use
- Active VWAP line: a moving reference that splits buyers from sellers within the current leg, and the level to work pullback entries against.
- Frozen VWAP lines: a historical map of where "average cost" sat in each previous leg — usable as soft support/resistance.
- HH / HL / LH / LL labels: market structure summarised in text, confirming the trend or flagging a structural break early without hand-drawing anything.
- No numeric output: the indicator contains no plot() at all, so this VWAP value cannot be pulled into another indicator as an external source, and there are no ready-made alerts.
- VWAP line colors are inverted relative to the tooltips: the tooltips describe S as "color used for VWAP lines when in an uptrend" and R for downtrends. But on the every-bar branch the code uses dir > 0 ? R : S — meaning an UP leg (dir=+1) is drawn with R (default red) and a DOWN leg with S (default lime). The simplest fix for intuitive colors is to swap the two swatches in the settings panel.
- A one-bar color flash at every flip: on the flip bar itself the new line is created with the condition dir < 0 ? R : S — the exact opposite of the normal branch. As a result the new leg's line appears in one color for exactly one bar and then switches to the other from the next bar onward. This is almost certainly a copy/paste slip in the original source, and a point to fix when porting to a strategy or to MT5.
- The indicator REPAINTS history: on a flip bar the entire segment from the anchor to the present is recalculated and redrawn, and the structure label appears dozens of bars back in the past. What you see on history is NOT what was actually displayed at that time. Any eyeball backtest on the chart will look better than reality — the anchor is only knowable after price has broken the prd-bar high/low.
- Frozen lines are "orphan" drawings that cannot be removed: being created without an assignment, the indicator holds no reference to them. They only disappear once the max_polylines_count = 100 declared at the top of the script is exceeded, at which point TradingView deletes the oldest itself. On a chart with deep history you will only ever see roughly the last 100 legs.
- This is not a VWAP by the strict definition: a true VWAP is the running sum of (price×volume) divided by the running sum of volume since the anchor, with every bar weighted equally. Here both numerator and denominator are exponential averages, so older bars decay geometrically. Precisely described, this is a volume-weighted moving average seeded at a swing point. It therefore tracks price far more closely than a real VWAP would.
- The default volBias of 10 is an extreme setting: because volatility is raised to the 10th power, an ATR deviation of only about ±25% from average already pins APT to the floor of 5 or the ceiling of 300. If you want the adaptive mode to behave smoothly rather than snapping between two extremes, try volBias in the 0.5–2.0 range. Note that useAdapt is OFF by default, so out of the box this box does nothing at all.
- The first label on the chart has no text: at the first flip the prev variable is still empty (na), so every comparison is false and the text string falls through to the empty default. You will see a blank colored label at the start of the history — expected behaviour, not a rendering bug.
- The "Swing Labels" swatches invite the wrong reading: the tooltips call the first swatch (highS) the "swing high/low label color" and the second (lowS) the "swing low label color". In the actual code highS is used when anchoring at a LOW (dir=+1) and lowS when anchoring at a HIGH — i.e. "green for bullish, red for bearish", not by pivot type as the variable names suggest.
- History limit: the rebuild loop reaches barsback bars into the past, which is why the script declares max_bars_back = 5000. If a leg ever runs longer than 5000 bars without a new anchor (rare, but possible with a large prd on a low-timeframe chart with sparse history), the indicator errors out instead of drawing.
- Entirely dependent on volume data: both the numerator and the denominator are multiplied by volume. On symbols with no volume feed (some indices, certain forex sources) the denominator is 0 → the indicator returns na and draws nothing. For forex and gold, TradingView volume is tick volume (number of price changes), not true traded volume — still usable, but worth understanding for what it is.