1. Elliott Wave Indicator Description (Rules-Based)
An automated, rules-based tool that identifies Elliott waves to help locate impulse and corrective structures on price charts.
1.1 Indicator Concept
This indicator is based on Elliott Wave Theory—one of the most well-known principles in technical analysis—which posits that markets move in repeatable, predictable wave patterns.
Core principles:
- Impulse Wave: Consists of five waves (labeled 1–2–3–4–5) moving in the direction of the main trend. Waves 1, 3, and 5 go with the larger trend; waves 2 and 4 are counter-trend corrections.
- Corrective Wave: Consists of three waves (labeled A–B–C) moving against the main trend, typically appearing after a completed five-wave impulse.
- Alternation rule: Pivots (highs/lows) alternate in sequence—a high followed by a low, then a higher high, and so on.
- Structure rule: In an uptrend, each new low should be higher than the prior low (Higher Lows) and each new high should be higher than the prior high (Higher Highs). The reverse applies in a downtrend.
1.2 Indicator Features
On-chart components:
- ZigZag line (green/red): Connects significant pivots to filter market noise and reveal structure. Green for up moves, red for down moves.
- PH/PL markers (small triangles): Mark confirmed Pivot Highs and Pivot Lows.
- Numeric labels 1–2–3–4–5 (blue/orange): Mark completed impulse waves—blue for bullish, orange for bearish.
- Letter labels A–B–C (magenta): Mark corrective waves that follow a completed impulse.
Alert system:
- Impulse completion alert: Notifies when a full five-wave structure (UP or DOWN) is detected.
- Correction completion alert: Notifies when an A–B–C structure is detected after an impulse.
1.3 How to Use the Indicator in Trading
Practical applications:
- Finding entries:
- After a wave 2 or wave 4 completes, prepare to enter in the trend direction as wave 3 or wave 5 begins.
- After wave C completes (end of the correction), consider entries in the new trend direction.
- Setting Stop Loss:
- Place SL below the low of wave 2 when entering on wave 3 (uptrend).
- Place SL below point C when entering after an A–B–C correction.
- Targets (Take Profit):
- Wave 3 is often the strongest, commonly extending 1.618× to 2.618× the length of wave 1.
- Wave 5 often ends near key support/resistance areas.
- Risk management: When an alert indicates wave 5 completion, consider taking profit or reducing size as an A–B–C correction may begin.
- Trend confirmation: A clear five-wave structure signals a strong trend. If no wave structure is visible, avoid ranging markets.
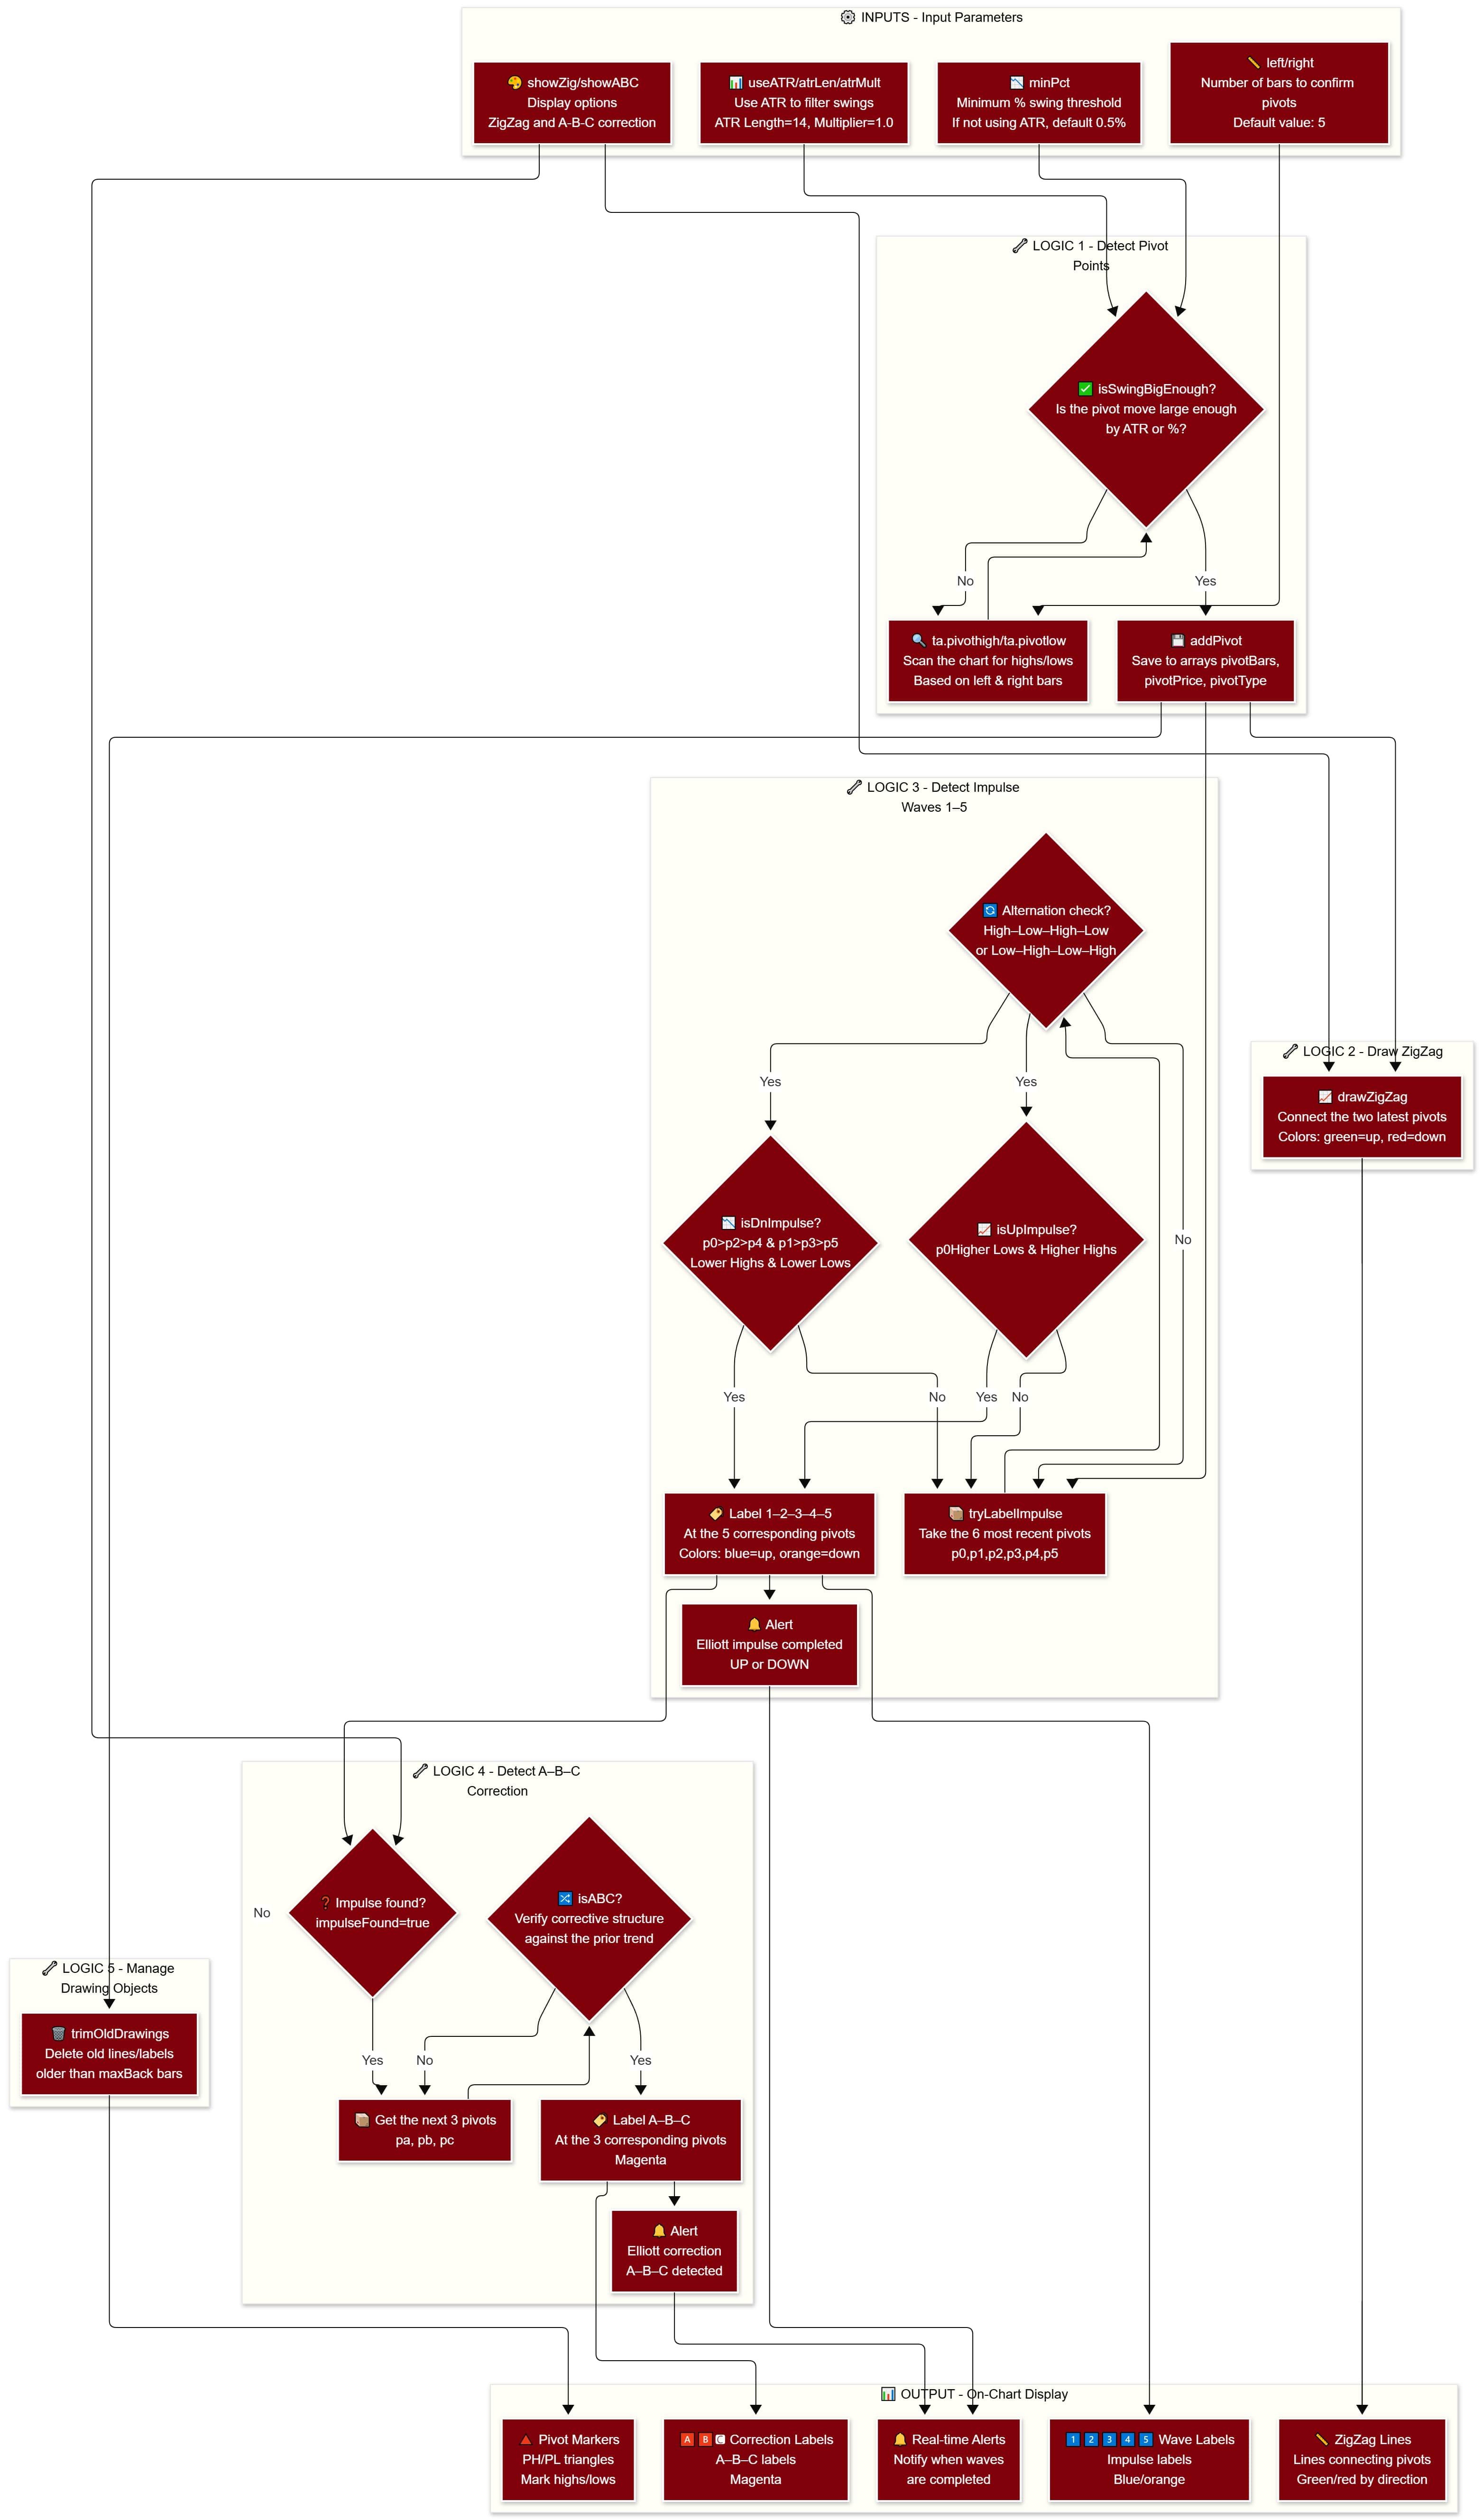
1.4 How the Indicator Works
A. Inputs & their role in the logic:
- Pivot Left & Right: left, right — Number of bars to the left/right to confirm a pivot. Larger values → fewer but more meaningful pivots. Default = 5.
- ATR Length & Multiplier: atrLen, atrMult — Used to set a minimum volatility threshold (ATR = Average True Range). If the move between two pivots < ATR × multiplier, it’s ignored. Purpose: filter insignificant swings.
- Min % Swing: minPct — If not using ATR, use a % threshold to filter swings. Example: 0.5% means the minimum move must exceed 0.5% of the prior value.
- Show A–B–C: showABC — Toggle detection of corrective waves after an impulse.
- Show ZigZag: showZig — Toggle display of the lines connecting pivots.
B. Main logic blocks & mechanics:
B1. Collect Pivot Points:
- ta.pivothigh() and ta.pivotlow() scan the chart to find local highs/lows using left and right.
- Each pivot is confirmed after right bars (i.e., with lag).
- isSwingBigEnough() checks whether the new pivot is sufficiently large compared with the previous pivot (ATR or % based).
- If large enough, the pivot is stored in three arrays: pivotBars (bar index), pivotPrice (price), pivotType (+1 = high, −1 = low).
B2. Draw the ZigZag line:
- drawZigZag() connects the two most recent pivots with a line.
- Green if the later pivot is higher than the prior one (up), red if lower (down).
- Purpose: clarify structure by removing noise.
B3. Detect the 1–2–3–4–5 impulse:
- tryLabelImpulse() checks the six most recent pivots.
- Alternation check: Pivots must alternate High–Low–High–Low–High–Low (or the reverse).
- Bullish structure check: isUpImpulse(p0,p1,p2,p3,p4,p5) verifies:
- p0 < p2 < p4 (Higher Lows)
- p1 < p3 < p5 (Higher Highs)
- p1 > p0, p3 > p2, p5 > p4 (each high above the preceding low)
- Bearish structure check: isDnImpulse() applies the inverse (Lower Highs and Lower Lows).
- If satisfied, label 1–2–3–4–5 on the chart and send an alert.
B4. Detect the A–B–C correction:
- Runs only after a completed impulse.
- isABC(pa, pb, pc, uptrend) evaluates the next three pivots:
- If the prior sequence was up (uptrend=true): pa > pb and pc < pa, pc < pb (a downward correction after an up impulse).
- If the prior sequence was down: pa < pb and pc > pa, pc > pb (an upward correction after a down impulse).
- If satisfied, label A–B–C on the chart and send an alert.
B5. Manage drawing objects:
- trimOldDrawings() removes lines and labels older than maxBack bars to avoid overloading the chart.
- This keeps the indicator responsive and within drawing-object limits.
C. Outputs & how to use them:
- Pivot High/Low markers (PH/PL): Red/green triangles marking key turning points → help identify support/resistance.
- ZigZag lines: Lines connecting pivots → reveal the broader trend and reduce price noise.
- Wave labels 1–5: Impulse labels → show the position within the wave cycle and help anticipate next waves.
- Correction labels A–B–C: Indicate the corrective phase → warn of a pause/pullback before the trend resumes or reverses.
- Alerts: Real-time notifications → ensure traders don’t miss major signals.
Assume Bitcoin is at 30,000 USD:
- Wave 1: Price rises from 30,000 to 32,000 (pivot low → pivot high)
- Wave 2: Price pulls back to 31,000 (pivot high → pivot low, still above 30,000)
- Wave 3: Price surges to 35,000 (the largest advance in the five-wave sequence)
- Wave 4: Price retraces to 33,500 (must not drop below wave-1 high at 32,000)
- Wave 5: Price advances to 36,000 then stalls
→ The indicator will auto-label 1–2–3–4–5 at the corresponding pivots and send the alert “Elliott impulse UP completed.”
→ The trader recognizes the completed five-wave cycle and prepares for the subsequent A–B–C correction.


Use the analysis above + the code below to instruct AI to modify the indicator and turn it into a trading bot—no coding required!
How to do it here -> 👉ZERO2HERO👈
					// This Pine Script® code is subject to the terms of the Mozilla Public License 2.0 at https://mozilla.org/MPL/2.0/
// © STEEL-CITY-CREATORS

//@version=5
indicator("Elliott Wave (rules-based, compile-safe)", overlay=true, max_lines_count=500, max_labels_count=500)

// ── Inputs ────────────────────────────────────────────────────────────────────
left     = input.int(5,   "Pivot Left",  minval=1)
right    = input.int(5,   "Pivot Right", minval=1)
useATR   = input.bool(true, "Use ATR filter for swing threshold?")
atrLen   = input.int(14, "ATR Length", minval=1)
atrMult  = input.float(1.0, "ATR Multiplier", step=0.1)
minPct   = input.float(0.5, "Min % swing (if ATR off)", step=0.1)
maxBack  = input.int(2000, "Max bars back for drawing", minval=300)
showABC  = input.bool(true, "Attempt A–B–C after 5 waves?")
showZig  = input.bool(true, "Show ZigZag Lines?")
colorUp  = color.new(color.lime, 0)
colorDn  = color.new(color.red,  0)

// ── Globals (declare BEFORE any function uses them) ───────────────────────────
var pivotBars  = array.new_int()
var pivotPrice = array.new_float()
var pivotType  = array.new_int()    // +1 = high, -1 = low

var lineArr    = array.new_line()
var labelArr   = array.new_label()

var int  lastImpulseBar = na
var int  lastABCBar     = na
var bool impulseFound   = false
var bool impulseUp      = false

// ── Helpers ───────────────────────────────────────────────────────────────────
atr = ta.atr(atrLen)

toPctMove(a, b) =>
    math.abs(b - a) / a * 100.0

isSwingBigEnough(prev, curr) =>
    useATR ? math.abs(curr - prev) >= atrMult * atr : toPctMove(prev, curr) >= minPct

// Pivots (confirmed by right bars)
ph = ta.pivothigh(high, left, right)
pl = ta.pivotlow(low,  left, right)

// Add pivot if large enough
addPivot(b, p, t) =>
    bool pushed = false
    if array.size(pivotPrice) == 0
        array.push(pivotBars,  b)
        array.push(pivotPrice, p)
        array.push(pivotType,  t)
        pushed := true
    else
        last = array.get(pivotPrice, array.size(pivotPrice) - 1)
        if isSwingBigEnough(last, p)
            array.push(pivotBars,  b)
            array.push(pivotPrice, p)
            array.push(pivotType,  t)
            pushed := true
    pushed

drawZigZag() =>
    if showZig
        sz = array.size(pivotBars)
        if sz >= 2
            b1 = array.get(pivotBars,  sz - 2)
            p1 = array.get(pivotPrice, sz - 2)
            b2 = array.get(pivotBars,  sz - 1)
            p2 = array.get(pivotPrice, sz - 1)
            ln = line.new(b1, p1, b2, p2, extend=extend.none, width=2, color = p2 > p1 ? colorUp : colorDn)
            array.push(lineArr, ln)

makeLabel(txt, b, p, col) =>
    lb = label.new(b, p, txt, textcolor=color.white, color=col, style=label.style_label_center, size=size.tiny)
    array.push(labelArr, lb)
    lb

// Basic impulse validation using six prices (not arrays)
isUpImpulse(p0, p1, p2, p3, p4, p5) =>
    // L0, H1, HL2, HH3, HL4, HH5
    (p0 < p2 and p2 < p4) and (p1 < p3 and p3 < p5) and (p1 > p0 and p3 > p2 and p5 > p4)

isDnImpulse(p0, p1, p2, p3, p4, p5) =>
    // H0, L1, LH2, LL3, LH4, LL5
    (p0 > p2 and p2 > p4) and (p1 > p3 and p3 > p5) and (p1 < p0 and p3 < p2 and p5 < p4)

// A–B–C check given three prices (A,B,C) and whether prior impulse was up
isABC(pa, pb, pc, uptrend) =>
    uptrend ? (pa > pb and pc < pa and pc < pb) : (pa < pb and pc > pa and pc > pb)

// ── Collect pivots on confirmation ────────────────────────────────────────────
newHigh = not na(ph)
newLow  = not na(pl)

if newHigh
    addPivot(bar_index - right, ph, +1)
    drawZigZag()

if newLow
    addPivot(bar_index - right, pl, -1)
    drawZigZag()

// ── Wave detection & labeling ─────────────────────────────────────────────────
tryLabelImpulse() =>
    // Returns (found, uptrend)
    bool found = false, bool up = false
    sz = array.size(pivotBars)
    if sz >= 6
        // Gather last 6 pivots
        b0 = array.get(pivotBars,  sz - 6)
        b1 = array.get(pivotBars,  sz - 5)
        b2 = array.get(pivotBars,  sz - 4)
        b3 = array.get(pivotBars,  sz - 3)
        b4 = array.get(pivotBars,  sz - 2)
        b5 = array.get(pivotBars,  sz - 1)

        p0 = array.get(pivotPrice, sz - 6)
        p1 = array.get(pivotPrice, sz - 5)
        p2 = array.get(pivotPrice, sz - 4)
        p3 = array.get(pivotPrice, sz - 3)
        p4 = array.get(pivotPrice, sz - 2)
        p5 = array.get(pivotPrice, sz - 1)

        t0 = array.get(pivotType,  sz - 6)
        t1 = array.get(pivotType,  sz - 5)
        t2 = array.get(pivotType,  sz - 4)
        t3 = array.get(pivotType,  sz - 3)
        t4 = array.get(pivotType,  sz - 2)
        t5 = array.get(pivotType,  sz - 1)

        // Alternation (+1/-1) and pattern checks
        altUp   = (t0 == -1 and t1 == +1 and t2 == -1 and t3 == +1 and t4 == -1 and t5 == +1)
        altDown = (t0 == +1 and t1 == -1 and t2 == +1 and t3 == -1 and t4 == +1 and t5 == -1)

        upOk = altUp   and isUpImpulse(p0, p1, p2, p3, p4, p5)
        dnOk = altDown and isDnImpulse(p0, p1, p2, p3, p4, p5)

        if (upOk or dnOk)
            col = upOk ? color.new(color.teal, 0) : color.new(color.orange, 0)
            // Label 1..5 at pivots 1..5
            makeLabel("1", b1, p1, col)
            makeLabel("2", b2, p2, col)
            makeLabel("3", b3, p3, col)
            makeLabel("4", b4, p4, col)
            makeLabel("5", b5, p5, col)
            found := true
            up := upOk
    [found, up]

// On any new pivot, try to detect impulse (tuple destructuring!)
if (newHigh or newLow)
    [found, up] = tryLabelImpulse()
    if found and (na(lastImpulseBar) or bar_index > lastImpulseBar)
        impulseFound   := true
        impulseUp      := up
        lastImpulseBar := bar_index
        alert("Elliott impulse (1–5) completed: " + (impulseUp ? "UP" : "DOWN"), alert.freq_once_per_bar_close)

// ── Try A–B–C after impulse ───────────────────────────────────────────────────
if showABC and impulseFound and (newHigh or newLow)
    sz = array.size(pivotBars)
    if sz >= 9
        pa = array.get(pivotPrice, sz - 3)
        pb = array.get(pivotPrice, sz - 2)
        pc = array.get(pivotPrice, sz - 1)
        ba = array.get(pivotBars,  sz - 3)
        bb = array.get(pivotBars,  sz - 2)
        bc = array.get(pivotBars,  sz - 1)

        if isABC(pa, pb, pc, impulseUp)
            ccol = color.new(color.fuchsia, 0)
            makeLabel("A", ba, pa, ccol)
            makeLabel("B", bb, pb, ccol)
            makeLabel("C", bc, pc, ccol)
            if na(lastABCBar) or bar_index > lastABCBar
                lastABCBar := bar_index
                alert("Elliott correction (A–B–C) detected", alert.freq_once_per_bar_close)

// ── Housekeeping ──────────────────────────────────────────────────────────────
trimOldDrawings() =>
    for i = array.size(lineArr) - 1 to 0
        ln = array.get(lineArr, i)
        x1 = line.get_x1(ln)
        if bar_index - x1 > maxBack
            line.delete(ln)
            array.remove(lineArr, i)
    for i = array.size(labelArr) - 1 to 0
        lb = array.get(labelArr, i)
        xb = label.get_x(lb)
        if bar_index - xb > maxBack
            label.delete(lb)
            array.remove(labelArr, i)

if barstate.islast
    trimOldDrawings()

// ── Visual hints ──────────────────────────────────────────────────────────────
plotshape(newHigh, title="New Pivot High",  style=shape.triangledown, color=colorDn, location=location.abovebar, size=size.tiny, text="PH")
plotshape(newLow,  title="New Pivot Low",   style=shape.triangleup,   color=colorUp, location=location.belowbar, size=size.tiny, text="PL")
Indicator Insider
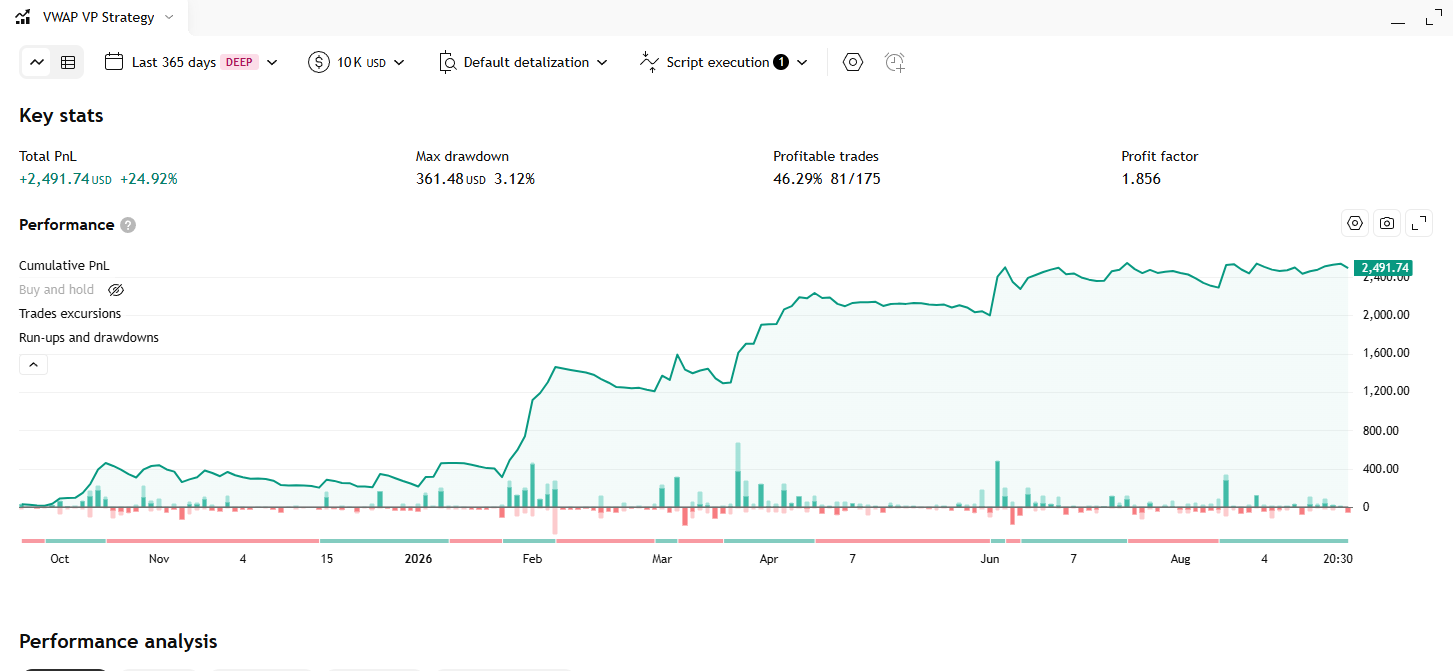
VWAP Volume Profile Indicator – Strategy
Một hồ sơ khối lượng hai chiều dựng trên đường VWAP thay vì trên giá: khối lượng của mỗi nến được gắn dấu cộng hoặc trừ tuỳ VWAP đang lên hay xuống, rồi gom lại thành biểu đồ cột nằm ngang chìa ra cả hai phía ở mép phải chart.
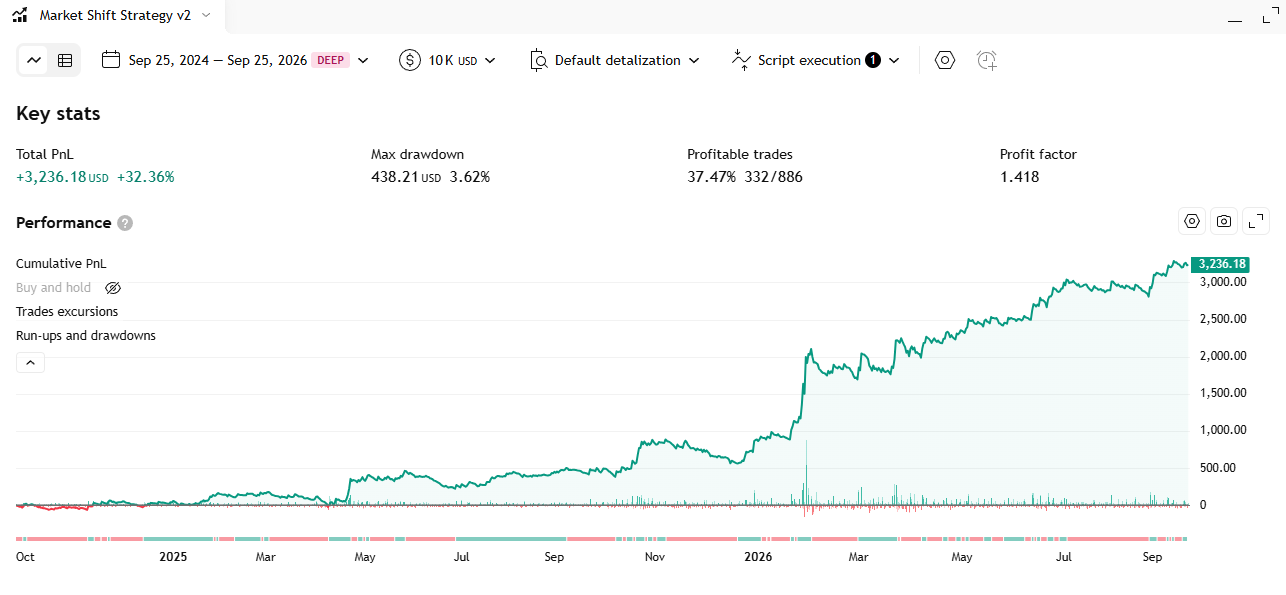
Market Shift Levels Indicator – Strategy
Every time the HMA moving average flips its slope, the indicator locks in the high or the low of that exact candle as a “boundary level”, colors every candle relative to it, and flags the moments price pokes through the level and immediately fails.
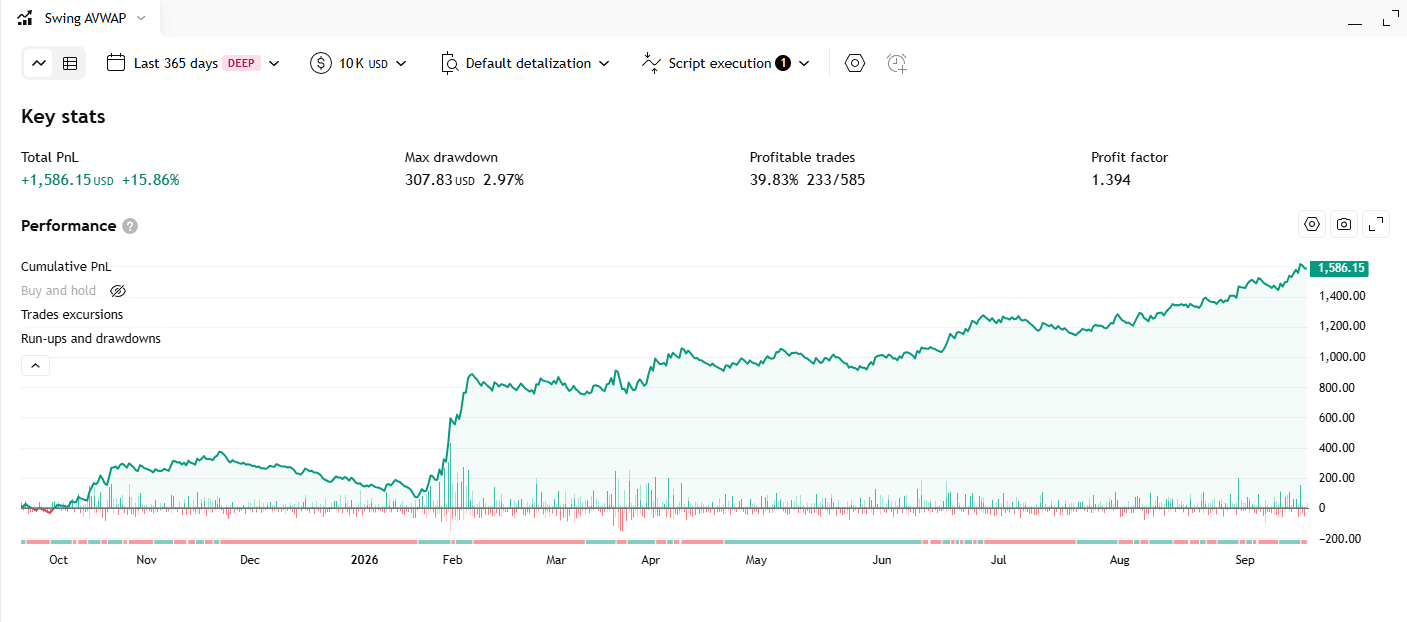
Dynamic Swing Anchored VWAP Indicator – Strategy
Automatically anchors a VWAP line to the most recent swing reversal point, rebuilds the whole line from that anchor every time market structure flips, and tags each anchor with an HH / HL / LH / LL structure label.