1. Automated Pattern Targets Strategy Description Code2trade
An indicator that automatically scans for 16 classic chart pattern types, draws their boundary lines, computes Entry/Stop Loss/Target, and fires an alert once a breakout is confirmed.
1.1 Indicator concept
The indicator is built on classic technical-analysis theory: price tends to repeat certain "geometric shapes" (Double Top, Head & Shoulders, Flag, Triangle, Cup & Handle...) formed by the psychological tug-of-war between buyers and sellers around swing highs/lows. Once a shape completes and price breaks out of its boundary, the odds that price keeps moving in the breakout direction for at least the shape's own "height" (its measured move) are considered higher than random.
The indicator automates the whole process a discretionary technical trader would normally do by hand: find swing highs/lows (pivots) → fit those pivots into one of 8 geometric templates (16 named pattern variants counting bullish/bearish direction) → confirm the breakout using a volatility threshold (ATR) or a % price threshold → compute Entry/Stop Loss/Target with each pattern's own measured-move formula → discard any pattern whose Risk:Reward ratio is too low before drawing it.
1.2 Indicator features
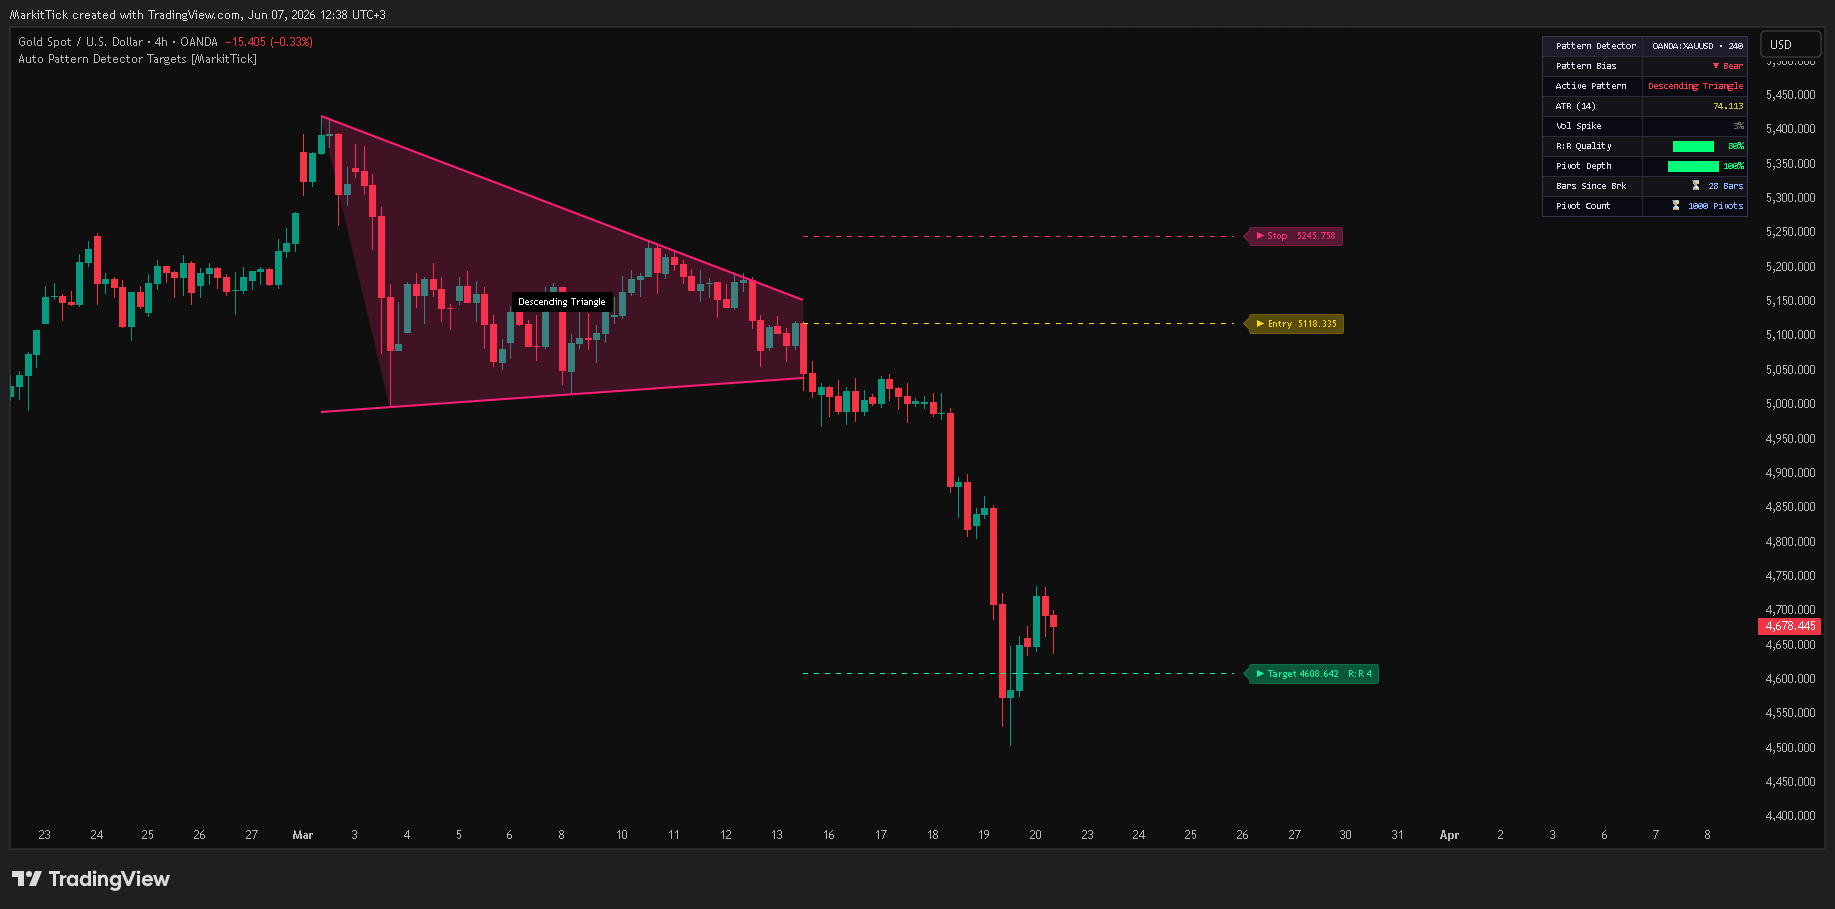
- Pattern drawing: draws the 2 boundary lines of the pattern (neckline, channel edge, cup rim...) in teal (bullish) or pink-red (bearish), fills the zone between the 2 lines with a light shade, and attaches a pattern-name label (e.g. "Head & Shoulders") at the shape's midpoint.
- Entry/Stop/Target display: when show_tgt is on, the indicator also draws 3 dashed horizontal lines extended 50 bars from the breakout point — Entry in yellow, Stop Loss in pink-red, Target in green — each with a label showing its exact price, and the Target line additionally shows the real R:R ratio after deducting slippage + commission.
- Dashboard table: a small panel in the top-right corner with 9 rows: symbol + timeframe, Pattern Bias (▲Bull/▼Bear), the currently displayed pattern name, ATR(14), a 10-block "Vol Spike" score bar, a 10-block "R:R Quality" score bar, a 10-block "Pivot Depth" score bar, bars elapsed since the last breakout, and the total number of pivots (highs+lows) recorded so far.
- Alert: every time a NEW pattern is confirmed with a complete Entry/Stop/Target set, the indicator fires a JSON-formatted alert containing the ticker, pattern name, bias, Entry price, Target price, and Stop price — meant to be piped into a trading bot or a notification webhook (Telegram, Discord...).
1.3 How to use it in trading
- Wait for the indicator to finish drawing a pattern together with its 3 Entry/Stop/Target lines on the chart → enter right at the Entry level (the open price of the bar right after the breakout bar), and place your Stop Loss / Take Profit exactly at the two other lines the indicator already drew.
- Before entering, glance at the top-right Dashboard to filter signal quality: if the "Vol Spike" bar only fills 1-2 out of 10 blocks, the breakout lacks volume confirmation — consider skipping it; a low "R:R Quality" means the reward:risk ratio is only barely above the min_rr floor, not comfortably above it; a low "Pivot Depth" means the chart still has little history behind it, so the pattern is less reliable.
- In the "Patterns" group, only enable the pattern types that fit your own trading style (e.g. keep only Double Top/Bottom on if you specialize in reversal trades at swing extremes) to keep the chart clean and signals focused on your strategy.
- You can temporarily enable show_ignore_conf to preview the shape of EVERY pattern even before it meets the volume/R:R conditions — useful for studying pattern shapes, but NOT meant for live entries.
- If you manage risk with a fixed R multiple (e.g. always taking profit at exactly 2R), enable rr_dyn_en so the indicator forces the Target to Entry ± Risk × rr_dyn_mult instead of using each pattern's default geometric measured-move formula.
- Use the JSON alert (see Alert above) to wire the indicator into a bot/webhook and receive Entry/Stop/Target automatically the moment a new pattern is confirmed, without watching the chart around the clock.
1.4 How the indicator works
Inputs & their role
- cooldown (integer, default 5): minimum number of bars that must pass since the previous pattern's start point before a new pattern is allowed to be drawn again. Lowering it to 1 makes the indicator redraw the pattern almost every time a new pivot appears, cluttering the chart with overlapping shapes; raising it to 20 spaces signals further apart, cutting clutter but also missing closely-spaced signals.
- sym_tol (%, default 10%): maximum allowed deviation between the two shoulders of a Head & Shoulders, or the two rim highs of a Cup & Handle, for them to still count as "symmetric". E.g. shoulders at 100 and 108 differ by (108-100)/104 ≈ 7.7% < 10% → still accepted; lowering the tolerance to 5% would reject this pair as "not symmetric enough".
- lvl_tol (%, default 3%): maximum allowed deviation between highs (or lows) in a Double/Triple Top/Bottom for them to count as "the same price level". Widening it to 5% makes Double Tops easier to detect but lowers signal precision.
- min_size_pct / min_atr_mult (default 0.5% and 1.0×): minimum height for a pattern to be accepted — the indicator takes whichever is LARGER between "0.5% of current price" and "1.0 × ATR(14)". At price 2000 with ATR=8, the threshold becomes max(10, 8) = 10 points; raising min_atr_mult to 2.0 pushes the threshold to 16 points, rejecting more small patterns and keeping only larger, more reliable ones.
- 16 pattern on/off switches (the "Patterns" group, all ON by default): each switch only shows/hides its own pattern type (e.g. turning off show_cup_std means the indicator will never draw a standard Cup & Handle again, even if price shape matches the conditions).
- lb_left / lb_right (default 10/10): bars required on each side to confirm a swing high/low (pivot). Lowering to 5 detects pivots sooner but is more prone to false swing points (noise); raising to 20 gives more reliable pivots but takes longer to confirm, better suited to higher timeframes.
- req_close_brk / req_body_brk (default false/false): enabling req_close_brk requires the candle's closing price to clear the boundary line for a breakout to count (instead of just a wick touching it); additionally enabling req_body_brk requires BOTH open and close to clear the threshold (a full-body breakout), stricter and reducing false breakouts at the cost of fewer signals.
- use_atr_brk + break_atr/break_pct (default true, ATR×1.0): chooses whether the breakout margin is volatility-based (ATR) or a fixed % of price. E.g. ATR=10, break_atr=1 → price must clear the boundary by at least 10 points; switching to % mode at price 2000 with break_pct=0.3% lowers the margin to just 6 points — looser, easier to trigger, but noisier when the market is quiet.
- brk_confirm_bars (default 1): number of consecutive bars that must hold beyond the boundary for the breakout to be considered real (guards against price spiking through and immediately reversing). Raising to 3 sharply cuts false breakouts but delays entry by 2 extra bars versus the default.
- req_vol + vol_mult + vol_len (default false, ×1.0, SMA 20): enabling req_vol requires volume on the exact breakout bar to exceed its 20-bar SMA times vol_mult. E.g. volume SMA = 1000, vol_mult=1.5 → the breakout bar needs volume ≥ 1500; if it doesn't, the pattern is silently discarded and never drawn.
- min_rr (default 1.0): minimum Reward:Risk ratio AFTER deducting slippage (slippage_ticks) and commission (commission_pct). A pattern whose real R:R falls below this floor is rejected entirely and never drawn, even if its shape is correct and it has already broken out.
- use_sl_pct_tgt + sl_pct_tgt (default true, 25%): the default Stop Loss formula — SL sits at a distance from Entry equal to 25% of the Entry→Target distance, producing a fixed structural R:R of roughly 4:1 for EVERY pattern type. Turning this input off switches SL to the pattern's own geometric anchor point (e.g. the Cup's handle low, an H&S shoulder high) plus/minus an ATR buffer (stop_buffer).
- rr_dyn_en + rr_dyn_mult (default false, 2.0×): enabling rr_dyn_en completely OVERRIDES the pattern's original measured-move Target, replacing it with Target = Entry ± (Entry-Stop distance) × rr_dyn_mult — e.g. 10-point risk with rr_dyn_mult=2 always places the Target exactly 20 points from Entry, regardless of pattern type.
- max_patterns (default 1): number of most-recent patterns whose drawings stay visible on the chart at once; anything older than that is automatically deleted to avoid chart clutter.
- alert_en (default true): turns the JSON alert on/off whenever a new valid pattern is confirmed.
Main logic blocks
- Working backward from what's displayed: everything a trader sees on the chart — the drawn pattern shape, the 3 Entry/Stop/Target lines, the Dashboard table, the JSON alert — all originate from exactly ONE selected result computed on each confirmed (closed) bar.
- Foundation layer — pivot detection: on every bar, the indicator checks whether the bar lb_left bars back is the highest/lowest bar in a roughly 20-bar window around it (based on lb_left/lb_right). If so, that pivot is stored at the front of a dedicated high-pivot list and a dedicated low-pivot list (the first element of each list is always the most recent pivot).
- Geometry-recognition layer (8 templates, running in parallel every bar): each detector function pulls the 2-3 most recent pivots relevant to its role, then checks: (a) correct time order (pivots must appear in the right before/after sequence), (b) its own geometric condition (symmetry via sym_tol/lvl_tol, whether the 2 boundary lines slope the same direction or converge, depending on the pattern), (c) the pattern's height meets the minimum threshold. E.g. a Double Top needs exactly 2 highs close to each other (within lvl_tol) with 1 low in between, in the correct high-low-high time order.
- Breakout-scan layer (shared by all 8 types): for each candidate pattern, the indicator linearly interpolates its boundary line (e.g. the H&S neckline, the Flag channel edge...), projects it onto each recent past bar, and compares that bar's price to a margin (ATR-based or %-based) around the projected line; if price clears the margin and holds for the required number of consecutive confirmation bars, the breakout is recorded at that exact bar.
- Entry/Target/Stop calculation layer: Entry is always the open price of the bar right AFTER the breakout bar (no lookahead). Target uses each pattern's own measured-move formula — e.g. Head & Shoulders: neckline break level minus the head-to-neckline height; Cup & Handle: rim break level plus the cup's depth; Flag/Pennant: breakout level plus the prior pole's height; Triangle/Rectangle: breakout level plus/minus the pattern's base height. If rr_dyn_en is on, all of the above is bypassed and Target becomes Entry ± Risk×rr_dyn_mult. Stop defaults to 25% of the Entry→Target distance, or a geometric anchor ± ATR buffer if use_sl_pct_tgt is off.
- Validity-filter layer (shared by all 8 types): a pattern is discarded if (when req_vol is on) volume on the breakout bar doesn't reach SMA×vol_mult, or if the R:R ratio after deducting slippage + commission falls below min_rr.
- Priority-dispatch layer: only ONE pattern is chosen for display per bar, following a fixed priority order: Double Top/Bottom → Triple Top/Bottom → Head & Shoulders → Flag/Pennant → Wedge → Triangle → Rectangle → Cup & Handle. The first pattern in this list that fully qualifies "wins"; any other pattern that also qualifies on the same bar is skipped.
- Warm-up + duplicate-prevention gate: pattern scanning only starts after the first 600 bars (warm-up period) and once at least 2 high pivots + 2 low pivots have been recorded. A pattern only counts as "new" and gets (re)drawn when its start point is more than cooldown bars away from the start point of the previously drawn pattern — this stops the indicator from redrawing the same pattern every single bar while the same old pivots remain the most recent ones.
- Drawing + alert layer: once a new valid pattern is found, the indicator draws its 2 boundary lines plus a shaded fill between them (for channel-shaped patterns), attaches the pattern-name label, draws the 3 Entry/Stop/Target lines with price + R:R labels (if show_tgt is on), updates all 9 rows of the Dashboard table, and fires a JSON alert (if alert_en is on). Drawings from older patterns beyond max_patterns are automatically deleted.
Outputs & how they're used
- Boundary lines + shaded pattern zone: let the trader visually cross-check the pattern's shape and its start/end points before trusting the automated signal.
- The 3 Entry/Stop/Target lines: used directly as the entry level, stop-loss level, and take-profit level for manual trading, or cross-checked against the trader's own money-management rules.
- Dashboard table: a quick signal-quality filter right before entering a trade (bias, currently active pattern name, ATR, volume score, R:R score, pivot depth, bars since breakout).
- JSON alert: a ready data feed for wiring into a webhook or automated trading bot, so the trader doesn't have to watch the chart around the clock yet still never misses a new signal.