1. Volume Order Block Strategy Description Code2trade
Combines a custom Supertrend for the base trend regime with ATR-sized Order Block zones anchored at confirmed swing pivots, colored by the real Buy/Sell volume split measured across the exact bars that formed the pivot, then gates retest signals behind a user-defined volume-ratio threshold.
1.1 Indicator Concept
This indicator treats an Order Block (the last candle range before a sharp reversal) as trustworthy only when two conditions line up: (1) price is currently in the trend phase that matches the Order Block's own direction, and (2) the real volume traded across the bars that formed that pivot leans strongly enough toward buyers or sellers. To do this, it first computes its own Supertrend variant (built on an average High-Low range instead of a standard ATR) to decide whether the market is currently bullish or bearish. Only once a swing pivot confirms in the same direction as the current trend does the indicator draw an Order Block zone exactly 1× custom_atr tall at that pivot candle, then splits that zone into two boxes according to the exact Buy/Sell volume ratio measured across the pivot's formation window. This zone is singular - there is no running list of multiple overlapping zones - and it is automatically deleted once price closes fully past its opposite edge (a complete break). Once formed, the indicator keeps watching for a "retest" signal (price returning to tap the zone edge and bouncing away) but only fires it when the Buy/Sell ratio recorded at creation time clears a minimum threshold set independently by the user.
- Only ONE Order Block zone is ever active at a time: when a new, non-overlapping pivot in the right direction shows up, the old zone is instantly frozen (its right edge locked) and fully replaced by a new one - the indicator does not keep a running history of multiple simultaneous Order Blocks the way many other OB indicators do.
- The Buy/Sell ratio is frozen the instant the zone is created: the percentage shown on the zone is computed exactly once from the volume in the pivot's formation window, and is never recalculated afterward even though the zone keeps stretching to the right in real time.
- The box on the zone's "own side" is always drawn more solid than the other one: on a bullish Order Block, the lower "Buy %" box is always more opaque than the upper "Sell %" box (and vice versa on a bearish zone) - regardless of what the actual percentage split is; this is purely a color convention so the "dominant" side of the zone is instantly readable at a glance.
- "Pivot Strength" carries two jobs at once: the same pivot_len input both decides how many bars must pass before a swing is confirmed AND decides how many bars get summed when computing the Buy/Sell ratio - raising it makes Order Blocks appear later BUT also makes the percentage get computed over a wider candle window.
1.2 Indicator Features
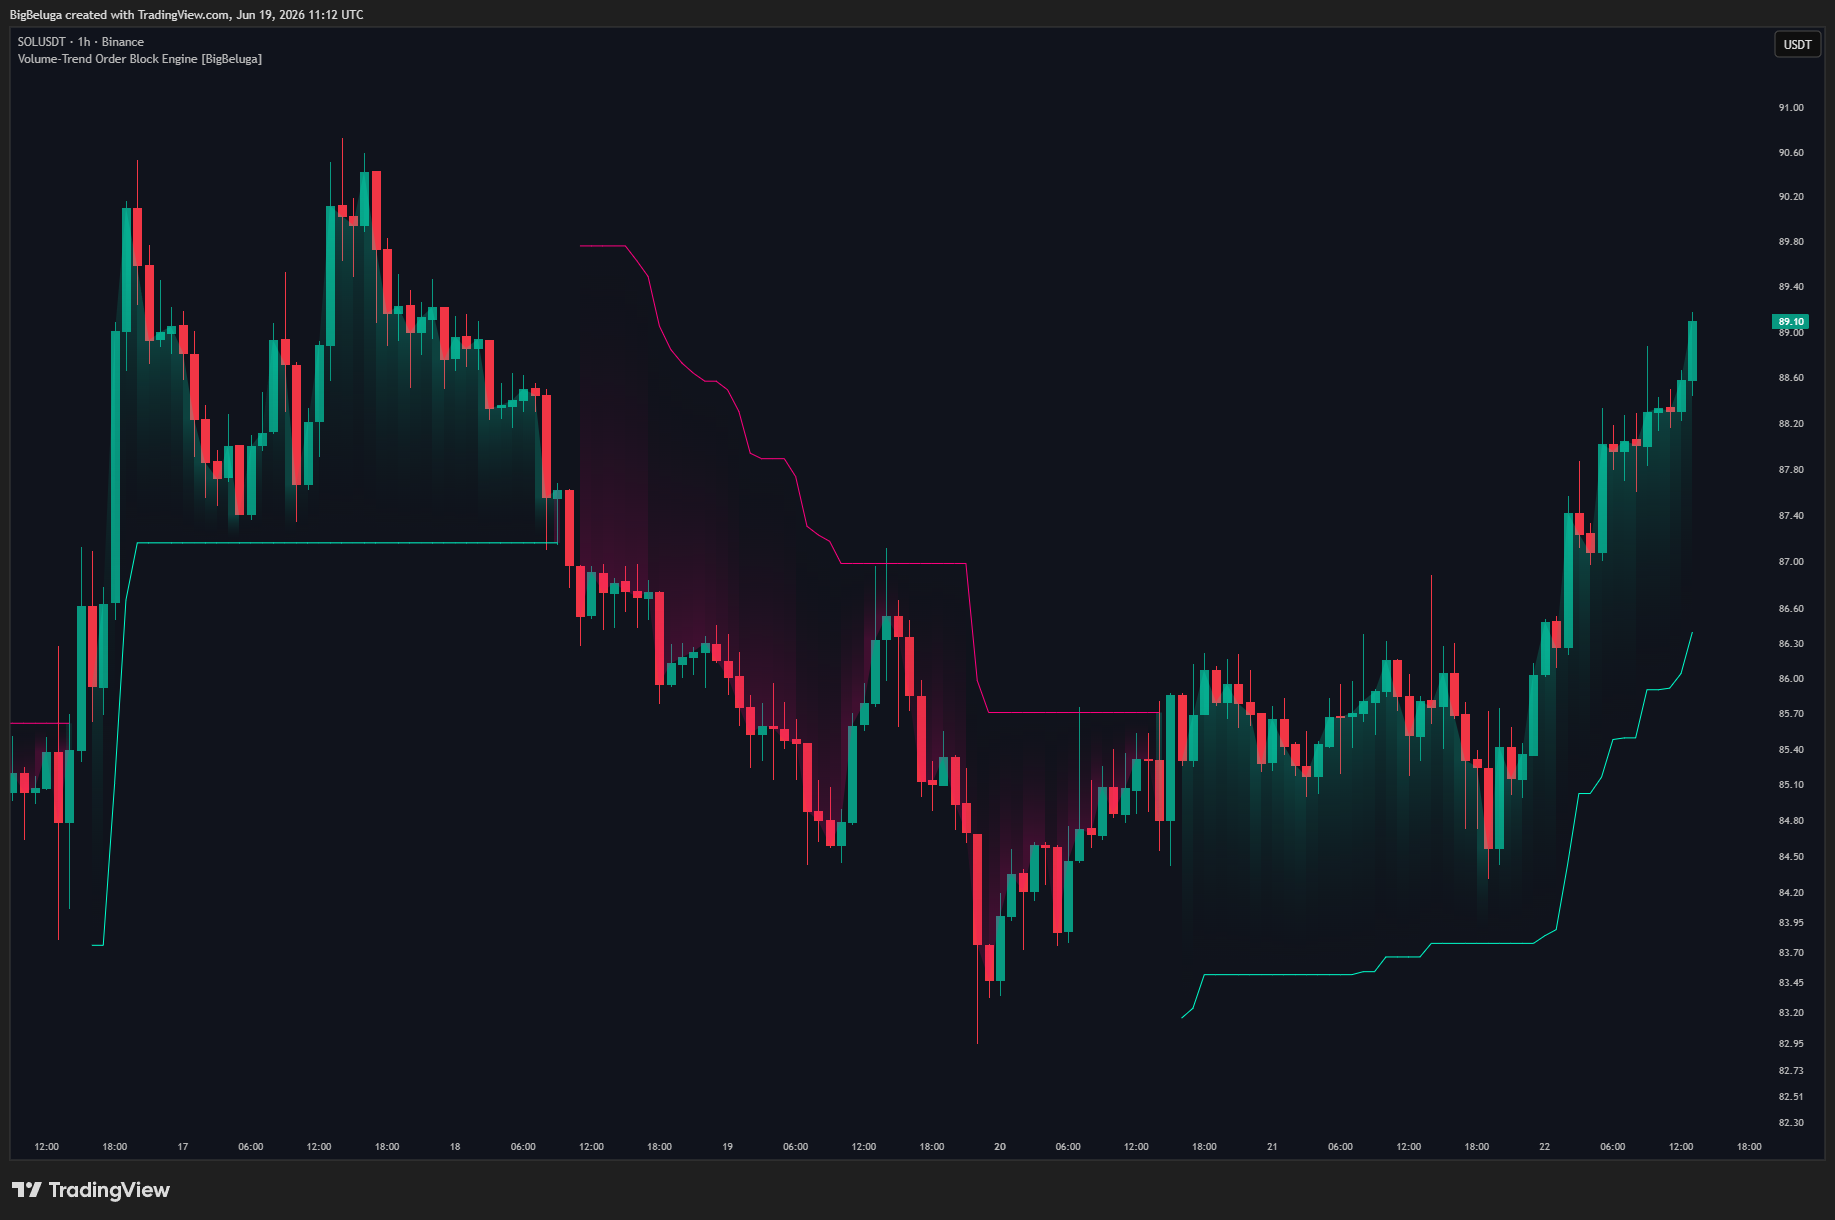
- Trend Cloud + Trailing Stop Line: a custom Supertrend line hugging price, turning teal in an uptrend and magenta/pink in a downtrend, with an optional translucent fill between close price and the stop line for reading the trend phase at a glance.
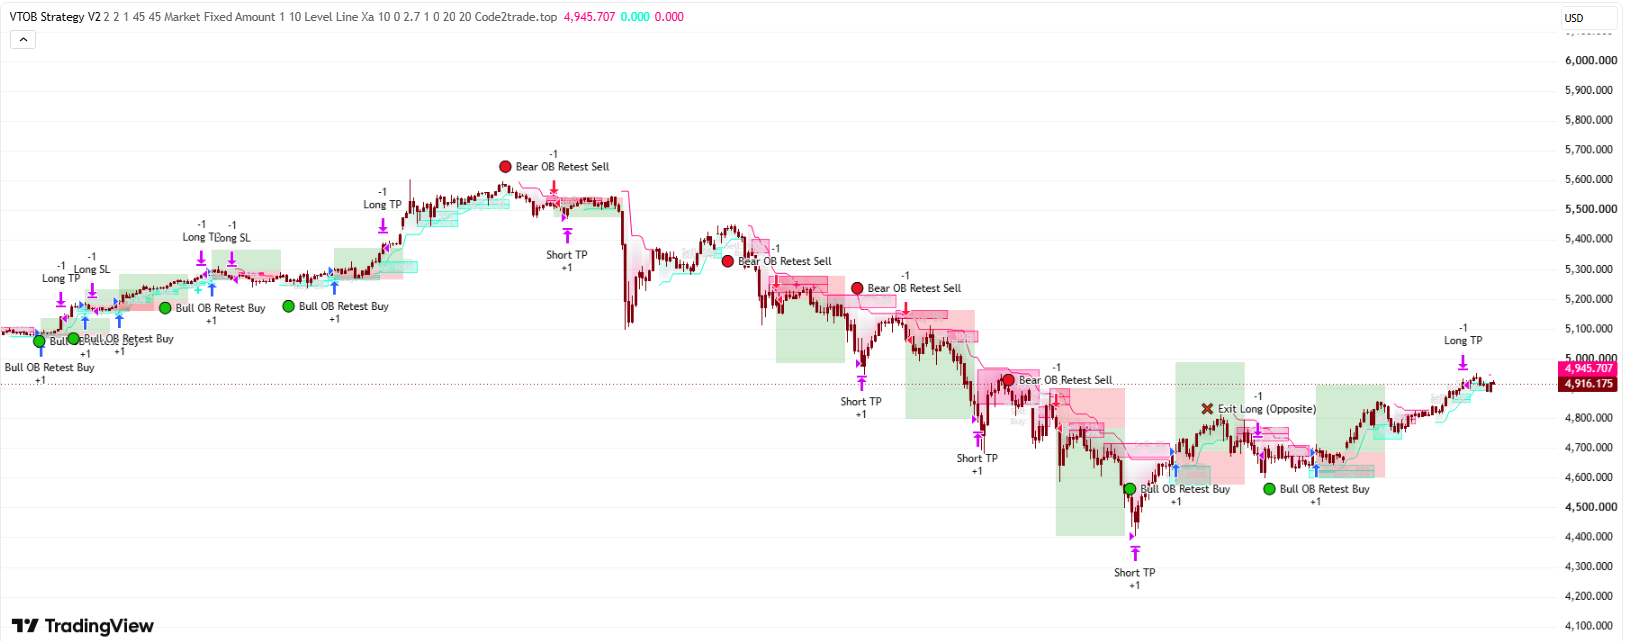
- Volume-Split Order Block Zone: a pair of adjacent boxes at the most recent same-direction swing pivot, exactly 1× custom ATR tall, split by the measured Buy/Sell volume ratio, with text labels showing the exact percentages directly on the boxes.
- Complete-Break Auto-Delete (optional): the Order Block zone vanishes automatically the moment a candle closes fully past its opposite edge, no manual cleanup required.
- Cross-Shaped Retest Signal: a small cross prints below/above a candle whenever price returns to tap the zone edge and bounces away successfully, only fired when that zone's Buy/Sell ratio clears the user's minimum threshold.
- Independent Threshold Filter Per Side: "Min Buy %" and "Min Sell %" are configured and toggled completely separately for bullish and bearish retest signals.
1.3 How To Use The Indicator
- Use the trend cloud as your directional filter first - only look for longs while the cloud is teal (bullish) and only look for shorts while it's magenta/pink (bearish), since an Order Block is only ever drawn in the direction of that trend.
- Read the Buy/Sell % on the box as a "who was in control" reading of the exact pivot-forming candles - a bullish Order Block showing "Buy: 80%" reflects a much clearer buyer takeover at the low than one showing only "Buy: 52%".
- Wait for the retest cross rather than entering the moment a zone appears - the cross only prints after price has actually returned to test the zone edge and bounced, and has also cleared the minimum volume-ratio filter.
- Raise "Min Buy %" / "Min Sell %" if retest signals feel too frequent or low quality - the higher the threshold, the more decisively one-sided the volume at zone creation must have been before a signal is allowed to fire.
- Remember only one Order Block exists at a time - if a new same-direction, non-overlapping pivot appears, the old zone is replaced immediately; don't expect to see multiple historical zones on the chart at once like some other OB indicators.
- There is no built-in alert - to get notified automatically on a retest signal you need to build your own "Any alert() function call" alert or watch the chart visually, since the script never defines alertcondition().
1.4 How The Indicator Works
Inputs & Their Role
- st_len ("Volatility SMA Length", default: 50): number of bars averaged to build the custom High-Low range ATR (custom_atr). A larger value smooths the trend line and slows its reaction to short-term swings; e.g. if the last 20 bars average an 8-point range but this is set to 50, the earlier, calmer bars dilute that figure and pull custom_atr below 8 points.
- st_mult ("Multiplier", default: 3.5, step 0.1): multiplier applied to custom_atr to set how far the upper/lower bands sit from src = hl2. With custom_atr = 10 points, 3.5 places the bands 35 points away; dropping it to 2.0 pulls that in to 20 points - tighter bands flip the trend more often (a "twitchier" line).
- show_fill ("Show Trend Cloud Fill", default: true): toggles the translucent fill between close price and the trend_stop line; turning it off leaves only the line, no shaded area.
- cloud_bull_col / cloud_bear_col ("Bullish/Bearish Cloud Color", default: #00ffcc / #ff007f): dedicated colors for the line and fill in an uptrend vs a downtrend, fully independent from the Order Block colors.
- pivot_len ("Pivot Strength", default: 7, min 1): number of bars required on both the left and right side to confirm a swing high/low, and also the number of bars summed when computing the Buy/Sell ratio. Setting it to 7 means waiting exactly 7 bars after a high/low before knowing whether it was a real pivot, and the volume window spans 8 bars (from the pivot bar to the confirmation bar).
- bull_col / bear_col ("Bullish/Bearish OB Color", default: #00ffcc / #ff007f): background color shared by both boxes that make up one Order Block zone, used for both its Buy% and Sell% halves.
- txt_col ("OB Text Label Color", default: #e0e0e0): text color of the "Buy: X%" / "Sell: Y%" labels printed inside the boxes.
- delete_on_break ("Delete OB on Complete Break", default: true): toggles automatic deletion of the Order Block zone once price fully breaks past its opposite edge. Turning it off leaves the zone displayed and still extending right even after price has moved well past its far side.
- show_bull_retest / show_bear_retest ("Bullish/Bearish Retest Signals", default: true for both): independently toggles drawing the retest cross marker for each direction.
- bull_vol_pct / bear_vol_pct ("Min Buy %" / "Min Sell %", default: 50.0, range 0-100, step 5.0): minimum volume percentage an Order Block must have had at creation time before a retest signal on that side is allowed to fire. Setting Min Buy % to 70 means only bullish Order Blocks showing "Buy: 70%" or higher can ever print a retest cross; a zone with only "Buy: 55%" will never signal even if price returns and taps it perfectly.
- bull_sig_col / bear_sig_col ("Color", default: #00ffcc / #ff007f): dedicated colors for the bullish and bearish retest cross markers, separate from the Order Block box colors.
Main Logic Flows
🎯 Flow 1: What You See
- A trend_stop line with a color-coded fill that flips with the trend, a pair of Order Block boxes (Sell% and Buy%) at the most recent same-direction swing pivot, and small cross marks printing below/above a candle whenever price successfully retests the zone edge and clears the configured volume-ratio threshold.

📈 Flow 2: Custom Supertrend (Base Trend Detection)
- custom_atr = simple average over the last st_len bars of (High-Low). The upper band = hl2 + st_mult×custom_atr, the lower band = hl2 - st_mult×custom_atr, and both "stick" the classic Supertrend way: the lower band can only rise or reset once the prior candle closed below the old lower band, and the upper band can only fall or reset once the prior candle closed above the old upper band. The trend flips bullish when price closes fully above the upper band (while trend_stop was tracking that upper band), and flips bearish when price closes below the lower band (while tracking that lower band) - trend_stop always equals the lower band while bullish and the upper band while bearish.
🔍 Flow 3: Pivot Confirmation & The Volume Window
- ta.pivotlow/ta.pivothigh only confirm a swing after exactly pivot_len bars have passed on both sides - meaning that by the time the indicator "knows" about a pivot, the actual pivot bar is already pivot_len bars back (p_idx = bar_index - pivot_len). At the same time, the internal function get_window_volume_ratio(pivot_len) scans back exactly pivot_len bars from the current bar (spanning precisely from the pivot bar to the confirmation bar), adding every up-close bar's volume (close≥open) into buy_vol and every down-close bar's into sell_vol, then returns buy_vol/(buy_vol+sell_vol).
🧱 Flow 4: Creating Or Replacing The Order Block Zone
- While the trend is bullish and a low pivot just confirmed, the candidate zone is set to ob_top = min(open, close) at the pivot bar, with ob_bot = ob_top - custom_atr (mirrored for a bearish high pivot: ob_bot = max(open, close), ob_top = ob_bot + custom_atr). This candidate is checked against the active zone via is_overlapping(): if the two overlap at all, the candidate is discarded entirely and the existing zone is left untouched. If they don't overlap, the old zone (if any) is frozen by locking its right edge at the new pivot bar, and a brand new zone is built starting exactly at that pivot bar.
- The moment the new zone is created, buy_ratio from Flow 3 is used to split it via split_price = active_bot + (active_top-active_bot)×buy_ratio: the upper box is labeled "Sell: X%" and the lower box "Buy: Y%" on a bullish Order Block (reversed on a bearish one). Regardless of the actual percentage, the box on the "correct side" of the Order Block's own direction (Buy for a bullish zone, Sell for a bearish one) is always drawn more solid (75% transparency) than the other box (85% transparency) - purely a display convention, not tied to the actual ratio value.
♻️ Flow 5: Real-Time Extension & Complete-Break Deletion
- Every bar, as long as the zone exists, the right edge of both boxes is pulled forward to the current bar_index - this is why the zone looks "alive" and keeps stretching to the right in real time instead of staying fixed at its creation width. If delete_on_break is enabled, the indicator also checks for a "complete break" every bar: a bullish Order Block breaks once the candle's low is entirely below the zone's bottom edge; a bearish one breaks once the candle's high is entirely above the zone's top edge. When that happens both boxes are deleted immediately and no zone is active again until the next valid pivot appears.
✅ Flow 6: Retest Signal Filtering
- A bullish retest needs ALL of the following true on the same closed bar: the candle's low crosses above the zone's top edge (ta.crossover(low, active_top) - meaning the previous bar's low still pierced below the top edge, and this bar's low has fully bounced above it), the current bar is NOT the same bar that just confirmed a new low pivot (avoiding overlap with Flow 4), the Buy ratio recorded when the zone was created must clear bull_vol_pct, the trend must NOT have just flipped on this exact bar, and the bar must be fully closed (barstate.isconfirmed, preventing repaint on the live realtime bar). The bearish retest is a full mirror on the other side, using ta.crossunder(high, active_bot) and the bear_vol_pct threshold.
Outputs & Their Role In Trading
- Trend cloud + trend_stop line: the overall directional filter, deciding whether the indicator is currently hunting for a bullish or bearish Order Block.
- Order Block box pair (Sell%/Buy%): the potential price zone to watch for a retest, with the % label showing how one-sided the volume was at the exact pivot-forming candles.
- Retest cross marker: the visual confirmation that price has actually returned to test the zone and bounced away, having already passed the trend + volume-ratio + no pivot-overlap filters.
- Alerts: none - this script never defines alertcondition() nor calls a dynamic alert(), even though the buy_retest/ sell_retest booleans are fully computed and available.