1. Directional Imbalance Index Strategy Description
Counts how many times price made a rolling-window highest high / lowest low over a recent lookback period, then represents the balance between the two sides as a bull/bear count and a dominance %.
1.1 Indicator Concept
This indicator measures "directional imbalance" with an approach that's simple but different from a typical momentum oscillator: instead of computing on the rate of price change, it counts how many times a bar "touched the rolling highest high" (that bar's high exactly equals the highest high of its own trailing length+1-bar window) and how many times a bar "touched the rolling lowest low" (symmetric), over a recent lookback (period bars).
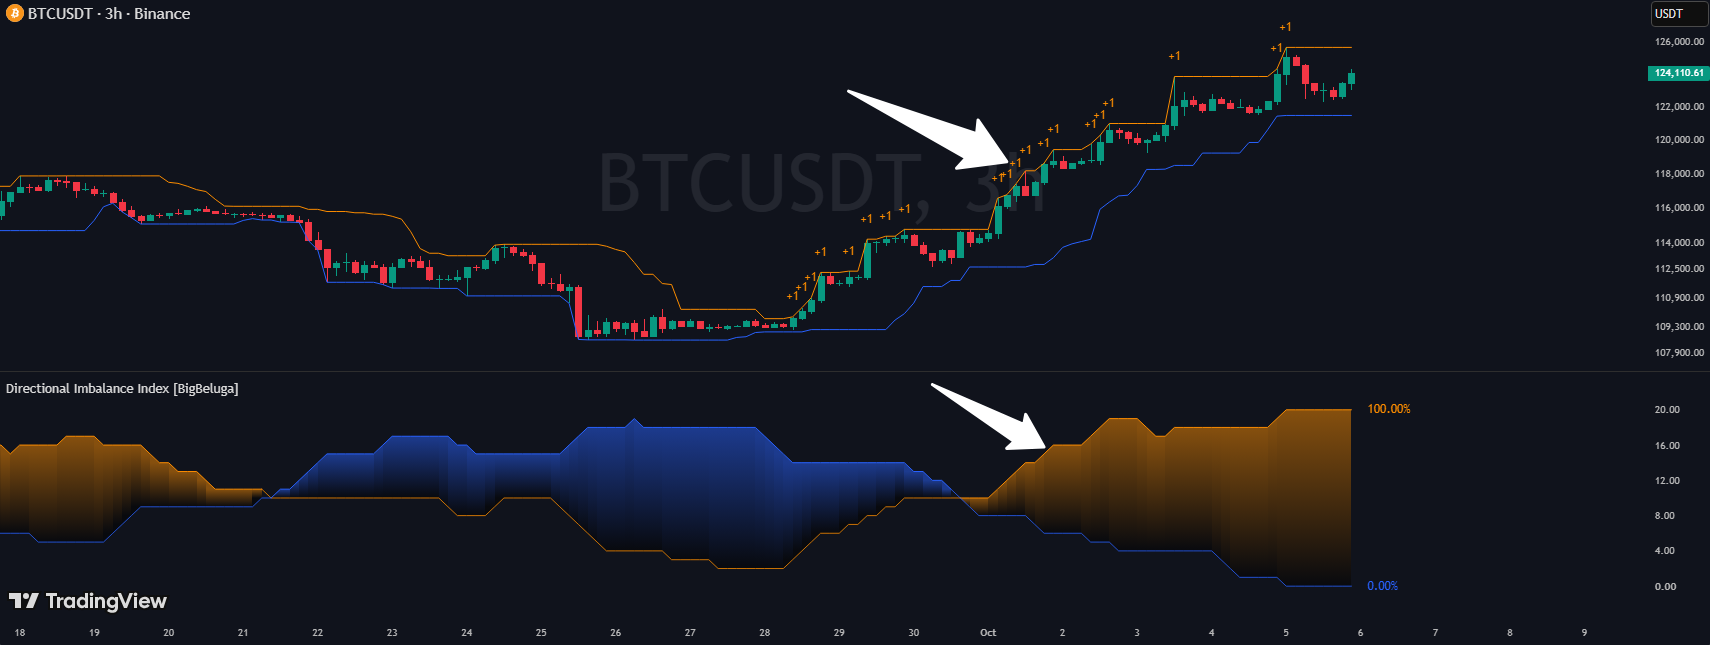
The result is two integer counts (Up/Dn) - the number of "highest touch" and "lowest touch" events within that window - plotted as two lines in their own sub-pane (like an oscillator), plus two percentage labels (bulls%/bears%) showing each side's share of the total event count. Whichever side has the higher Up/Dn count is considered "dominant" - it has produced more new highs/lows recently.
- "Highest touch" differs from a standard pivot: the condition only requires that bar to be the highest within its own trailing length+1-bar window (one-sided, looking backward) - it does NOT require the following bars to also be lower like a standard 2-sided pivot (e.g. ta.pivothigh) - so it confirms instantly, with no lag waiting for confirmation from later bars.
- Dual-pane behavior: the indicator runs in its own sub-pane (overlay=false) but "forces" some drawings (the "+1" labels, the Upper/Lower lines) to appear directly on the main price chart via force_overlay=true - combining both perspectives: a separate oscillator AND visual markers on price.
1.2 Indicator Features
- 2 Oscillator Lines (Up/Down): plotted in a separate sub-pane below the chart; whichever side is currently dominant (Up>Dn or vice versa) is drawn in full color, the other side is dimmed (20% transparent).
- Fill Zone Between the Two Lines: colored to match whichever side is currently dominant, its opacity depending on whether the "Bull"/"Bear" toggle for that side is on.
- Percentage Labels (bulls%/bears%): a single floating label per side, always shown only on the last bar, auto-deleting the previous version on every update (never accumulates).
- "+1" Labels on the Price Chart: pinpoint exactly which bars within the most recent period window "touched the highest high"/"touched the lowest low" - placed above (for a high touch) or below (for a low touch) the exact bar, shown directly on the price chart even though the indicator itself runs in a separate sub-pane.
- Upper/Lower Lines on the Price Chart: the rolling highest-high/lowest-low (length+1 bars) line, drawn continuously on EVERY bar (not just the last one), as a visual reference for the "touch" conditions.
1.3 How to Use the Indicator
- Read whichever side has the higher Up/Dn count as the side in control: if Up consistently exceeds Dn, the market has recently been making more new highs than new lows - a bullish-leaning context; the reverse leans bearish.
- Watch the % to measure the degree of dominance, not just the direction: bulls%=80% means something very different from bulls%=55% even though both are "Up beats Dn" - the percentage tells you whether the gap is decisive or just a slight edge.
- Use the "+1" labels on the price chart to see EXACTLY which bars are contributing to the current count - useful for understanding why Up/Dn sits where it does, instead of just looking at an abstract number.
- Adjust "Highest/Lowest Length" to change how sensitive a "touch event" is: increase it → only genuinely standout highs/lows (relative to a wider window) qualify, fewer but more significant events; decrease it → more, smaller events qualify, more sensitive but noisier.
- Adjust "Calculation Period" to change the indicator's "memory": a longer period → Up/Dn reflects a longer-term trend, less bar-to-bar swing; a shorter period → reacts faster to recent changes but is more volatile.
- Don't confuse "highest/lowest touch" with a standard 2-sided pivot: since only one side is confirmed (no requirement for later bars to be lower), a bar can be counted as "+1" the moment it forms, even if price keeps going the same direction afterward (not necessarily a genuine reversal high/low).
1.4 How the Indicator Works
Inputs & Roles
- length ("Highest/Lowest Length", Integer, default: 10, min 1): the window length used for the rolling highest/lowest (actually used as length+1 in ta.highest/lowest). Example: length=10 → every bar is compared against 11 bars (itself + 10 prior) to check whether it's the highest/lowest within that group. Increase → only more standout highs/lows qualify as a "touch", fewer events. Decrease → easier to qualify, more events.
- period ("Calculation Period", Integer, default: 70): number of recent bars scanned to count total "highest touch"/"lowest touch" events (i=0 is the current bar, i=period-1 is the furthest bar counted). Up/Dn/bulls%/ bears% are all recomputed from scratch within this exact window every bar.
- showBul / colUp ("Bull", Boolean/Color, default: true / orange #FB8C00): toggle display for the bullish side (Up line, % label, fill portion) + its color.
- showBer / colDn ("Bear", Boolean/Color, default: true / blue #2962FF): same for the bearish side.
Main Logic Blocks
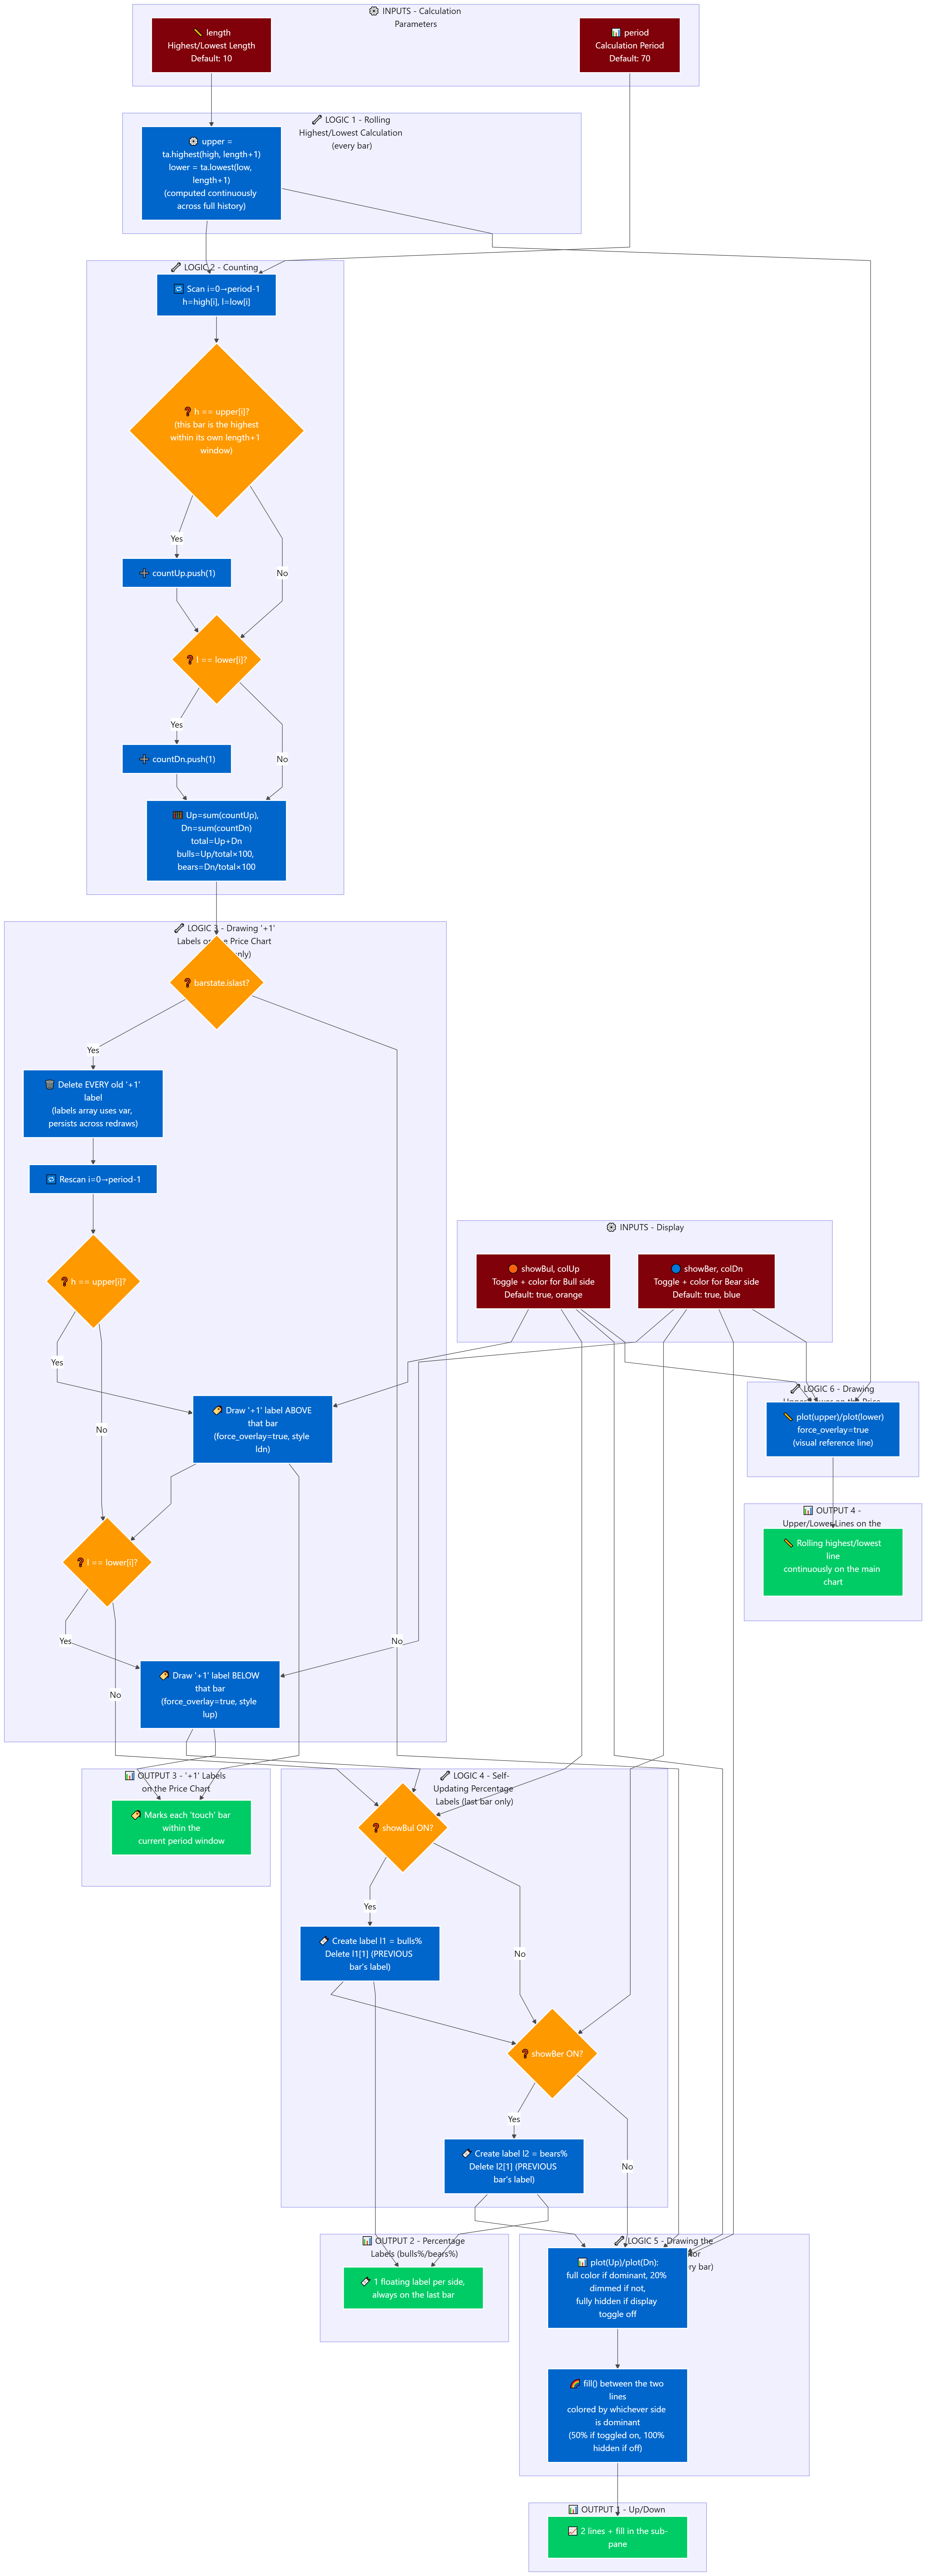
🎯 Flow 1: Rolling Highest/Lowest Calculation
- upper = ta.highest(high, length+1) and lower = ta.lowest(low, length+1) - computed CONTINUOUSLY for every bar in history (a full series, not just the current value), allowing upper[i]/lower[i] to be read as "what was the rolling highest AT that point in the past".
🔢 Flow 2: Counting "Touch" Events Within the Period Window
- For each i from 0 to period-1 (scanning backward from the current bar): reads h = high[i], l = low[i] - that specific bar's own high/low. If h == upper[i] (that bar WAS the highest within its own length+1-bar window) → adds 1 to countUp. Same for l == lower[i] → adds 1 to countDn.
- Up = countUp.sum(), Dn = countDn.sum() - the total number of "touch" events per side across the entire period-bar window just scanned.
- Example: length=10, period=70. Scanning the most recent 70 bars finds 42 bars that were "the highest of their own 11-bar window" (Up=42) and 28 bars that were "the lowest of their own 11-bar window" (Dn=28). total=70, bulls=42/70×100=60%, bears=28/70×100=40%.
🏷️ Flow 3: Drawing "+1" Labels on the Price Chart (last bar only)
- Only runs when barstate.islast: deletes EVERY old "+1" label (stored in the labels array, which DOES use var so it persists across redraws), then rescans exactly the most recent period bars, drawing one "+1" label for EVERY "touch" event found - above (for a highest touch, style "ldn" pointing down) or below (for a lowest touch, style "lup" pointing up) the exact bar's position, using force_overlay=true to show it on the main price chart even though the indicator itself sits in a separate sub-pane.
- Since it's only redrawn on the last bar and only within the CURRENT period window, the "+1" labels are NOT a permanent historical record - as a new bar forms, the window shifts, old labels outside it disappear, new ones appear.
🔖 Flow 4: Self-Updating Percentage Labels (bulls%/bears%)
- If showBul is on: creates a new label l1 at (bar_index, Up) showing the bulls% value (percent-formatted), then IMMEDIATELY deletes l1[1] - a reference to the label object stored in l1 ONE BAR AGO (via Pine's historical-reference mechanism for object types) - this technique creates the effect of "a single label updating live" without needing a storage array or manual cleanup. showBer/Dn/bears% does the same with l2.
📊 Flow 5: Drawing the Up/Down Oscillator (separate pane)
-
The two lines plot(Up)/plot(Dn)
draw in the indicator's own sub-pane (NOT force_overlay) on EVERY bar. Line color:
if that side is toggled on (showBul/showBer) AND currently dominant (Up>Dn or
Up
- fill() shades the zone between the two lines with whichever side is currently dominant's color (the losing side gets color(na), no fill), 50% opacity if that side's display toggle is on, 100% transparent (fully hidden) if off.
📏 Flow 6: Drawing Upper/Lower on the Price Chart (every bar)
- The two calls plot(upper,...) / plot(lower,...) use force_overlay=true, running on EVERY bar (not gated by barstate.islast) - continuously drawing the rolling highest/lowest (length+1 bars) line directly on the price chart, as a visual reference for the "touch" logic above.
Outputs & Usage Roles
- The Up/Down lines + fill: a visual oscillator showing which side has been producing more new highs/lows within the most recent period bars, and how dominant it is via the fill's intensity.
- Percentage labels (bulls%/bears%): a concrete number for the degree of dominance, easier to compare across moments than the two raw lines alone.
- "+1" labels on the price chart: shows EXACTLY which bars are contributing to the current count - connecting the abstract number to real positions on the chart.
- Upper/Lower lines on the price chart: a visual reference for the highest/lowest "touch" condition the indicator's math is based on.