RSI Volatility Suppression Zones TradingView indicator
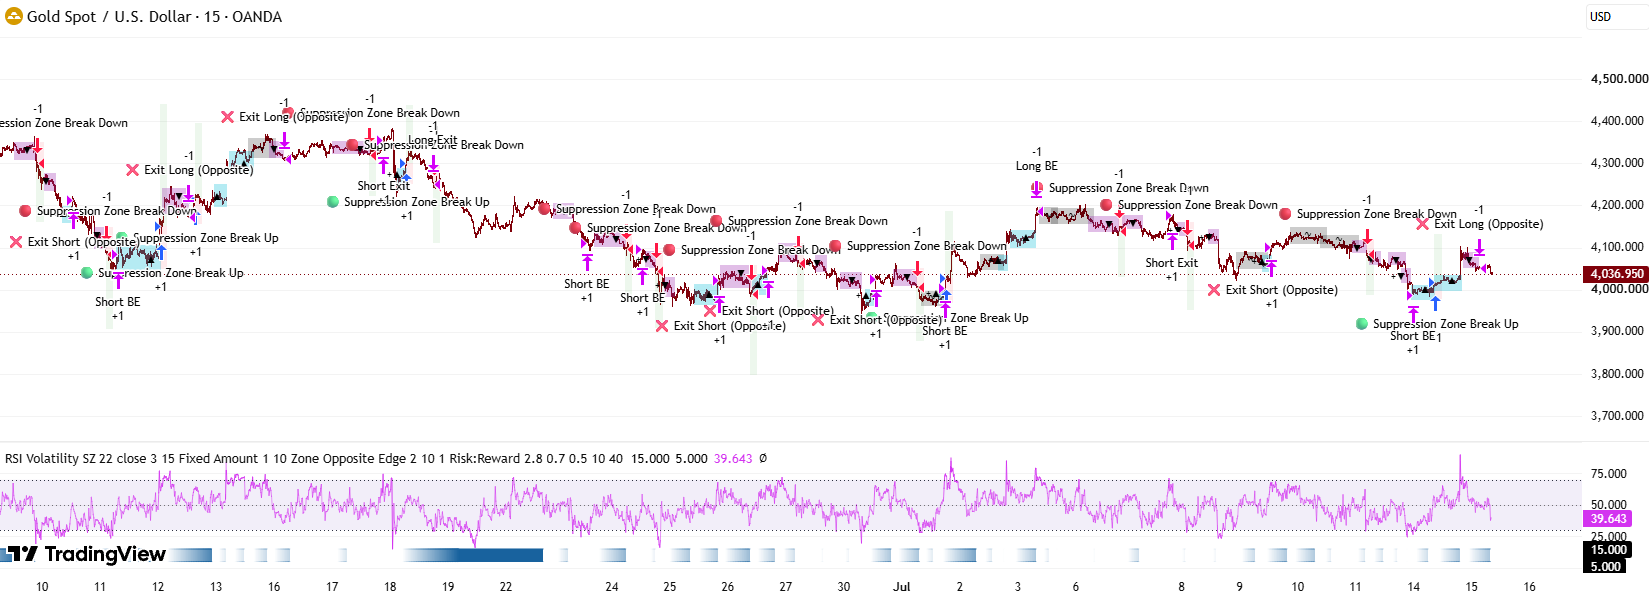
Draws a box on the price chart when RSI goes unusually quiet, then marks the break ▲/▼ · tested on gold XAUUSD M15
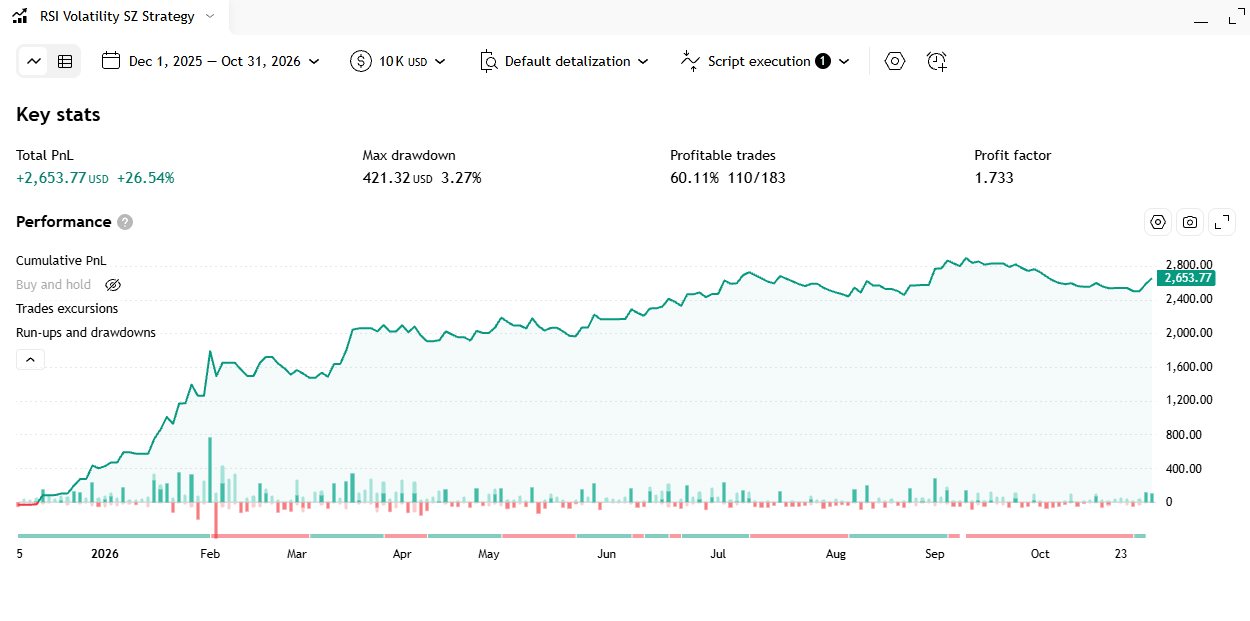
Quick summary: The RSI Volatility Suppression Zones TradingView indicator checks whether the RSI line has gone unusually quiet. After 11 calm bars in a row it draws a box on the price chart and waits for price to break out of it, then paints the box as a ▲ or a ▼. In one backtest of the strategy version built on this indicator, on gold (XAUUSD) M15 from 2025-12-01 to 2026-10-31, it took 183 trades with 60.11% winners, a 1.733 profit factor, +26.54% on a 10,000 USD account and a 3.27% maximum drawdown.
What is the RSI Volatility Suppression Zones indicator? The idea behind it
The indicator builds on a familiar market habit: price alternates between quiet, compressed stretches and fast, expanded ones. After a period of being squeezed, price often needs one decisive push to release that energy. Nobody knows in advance whether the push goes up or down, so the indicator does not guess a direction. It only identifies when the market is compressed, then lets price itself reveal the direction by leaving the zone.
What sets it apart is that compression is measured on the RSI line, not on price. RSI is already a normalised measure, so an RSI that barely moves suggests buyers and sellers are evenly matched and neither side is pushing price far. If that lasts, the price area covered during the squeeze becomes a reference range, and the side that wins when price leaves it may hold the edge for the next move. That reading is our interpretation of the code, not something the indicator proves on its own.
If you compare several ways of reading volatility and trend, browse related tools in the Code2Trade free TradingView indicator library.
What the volatility suppression box indicator shows on the chart
Chart drawings
The indicator sits in its own pane under the chart, because it is an RSI oscillator, but its boxes are forced back onto the price chart. You read both places at once.
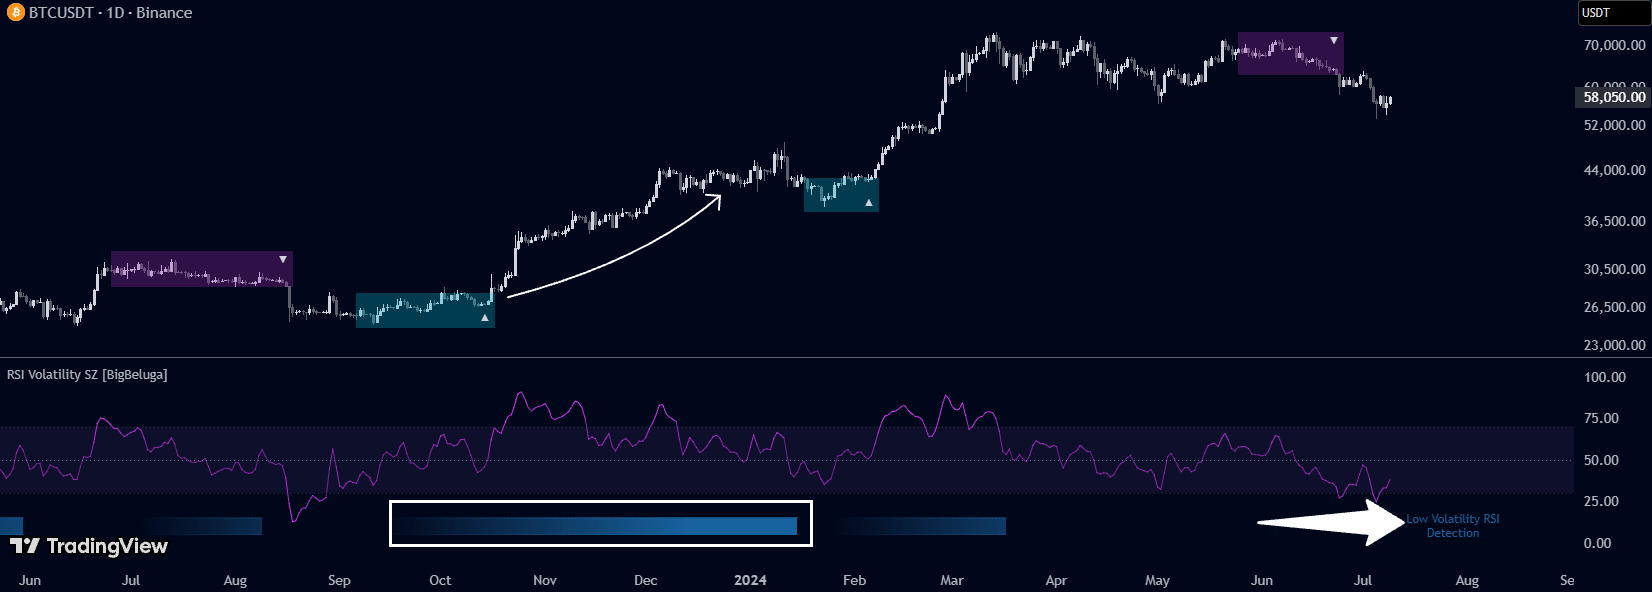
- The RSI line in magenta, smoothed. The colour gets stronger as RSI moves toward the extremes (from 50 up to 75, or from 50 down to 15) and fades near 50.
- Three dotted lines at 70 / 50 / 30 and a light purple background band from 30 to 70 that marks the normal RSI range.
- A deep blue band at the bottom of the pane, between 5 and 15: the calm meter. It is invisible while the calm streak is short, then darkens until the streak reaches 100 bars. A text label reads "Low Volatility RSI Detection".
- A grey box with a ∿ sign on the price chart: a suppression zone that is waiting. A new box has a fixed top and bottom and its right edge grows with every bar.
- The box turns cyan with "▲" or "+▲" when price breaks up, and purple with "▼" or "+▼" when price breaks down. The "+" means the break came early (see How it works).
- An RSI EMA line in yellow, off by default; it only appears when you tick "RSI EMA".
Alerts
- The indicator has no alert conditions. To be notified when a box changes colour you must create an alert by hand in TradingView or add code.
How to trade with the RSI suppression zone breakouts
The prices below are illustrative numbers on gold M15 to show the mechanics, not a real trade.
Long setup
Wait for a grey box, then wait for a candle that closes with its entire body and wick above the box top (the box turns cyan with a ▲). Example: the box top is 2,655.0 and the bottom 2,645.0; the breakout candle has a low of 2,656.0 and closes at 2,658.0. One reasonable plan is to buy at the close of 2,658.0, put the Stop Loss at the box bottom, 2,645.0 (risk 13.0), and take profit at 1:2 near 2,684.0. If price falls back through the whole box, the breakout has failed.
Short setup
The mirror image: wait for the box to turn purple with a ▼ after a candle whose high sits entirely below the box bottom. With the same 2,645.0 – 2,655.0 box, a breakout candle with a high of 2,644.0 closing at 2,642.0 gives a sell at 2,642.0, Stop Loss at the box top 2,655.0 (risk 13.0) and a 1:2 target near 2,616.0.
When NOT to use it
- When there is no box: nothing is signalled until RSI has been calm for 11 bars.
- The start of the chart history: the normalisation needs roughly 200 bars or more, so the first bars carry no boxes.
- When the box is too wide for the current candles: the box is about four times the 150-bar average candle range, fixed at creation. In a very quiet market the breakout has to travel far, so entries come late and the stop is far. This is reasoning from how the code is built, so check it on your own chart.
- Abandoned boxes: if RSI spikes and then goes calm for another 11 bars while the old box is still unbroken, the new box takes over and the old one freezes and never changes colour.
- While the candle is still open: the breakout test uses the live candle's low and high, so a mark can flicker. Trust it only after the candle closes.
Traders usually pair a breakout tool like this with a trend filter or a higher timeframe. You can also merge several TradingView indicators into one without coding (in Vietnamese).
How the RSI volatility suppression indicator works
Inputs and what each one does
- length (integer, default 14): the RSI period. Lower it to 7 and RSI gets more sensitive; raise it to 21 and RSI gets smoother. Both change how often boxes appear, but by how much has not been measured, so test it on your chart. (Layer 1 in the flowchart)
- src (price source, default close): the price fed into the RSI. (Layer 1)
- vol_length (integer, default 5, labelled "Volatility" in Settings): the label is misleading. In the code it is only the length of the Hull MA that smooths the RSI. It does not change the calm threshold or the box width; it only makes the RSI line smoother (and so indirectly affects rsi_volat). (Layer 1, used in Layer 2)
- rsi_col, vol_up, vol_dn (three colour pickers on one row, labelled "RSI", "▲", "▼"): they only change the RSI line colour, the break-up box colour and the break-down box colour. No effect on logic. (Layer 1)
- sig_line (checkbox, default off, labelled "RSI EMA") and sig_len (integer, default 15, an unlabelled number box right next to it): turn on and size the yellow EMA line. Reference only; it is not used in the box logic. (Layer 1, used in Layer 3)
- Constants fixed in the code (no input box): the calm threshold of 2; more than 10 calm bars to create a box; 5-bar and 200-bar standard-deviation windows; a 150-bar average candle range; box half-height of 2 times that range; the 18-bar rule for the "+" sign; the blue band at 5–15; a limit of 500 boxes.
Main calculation blocks
- The smoothed RSI (Layer 2): rsi = HMA(RSI(close, 14), 5). For example, a raw 14-bar RSI of 52.8 may read 52.3 after smoothing.
- Volatility of the RSI itself (Layer 3): the Volatility() function takes RSI now divided by RSI one bar ago, applies a logarithm, measures its 5-bar standard deviation and multiplies by 100; it then divides that by its own 200-bar standard deviation. The result, rsi_volat, has no unit: 1 means RSI is moving about as much as usual, 2 means twice as much. Example: current movement 0.9 and its 200-bar standard deviation 0.6 give rsi_volat = 1.5.
- The calm-bar counter (Layers 4–5): each bar with rsi_volat ≤ 2 adds 1 to count_volatility. On the bar where rsi_volat has just crossed above 2 the counter resets to 0, and it stays at 0 while RSI keeps spiking. It is a var variable, so it is remembered from bar to bar. Example: bar 100 is a spike (reset to 0) and bars 101 to 111 are all calm, so at bar 111 the counter equals 11.
- Creating the box (Layers 6–7): when the counter has just passed 10 (the 11th calm bar) the indicator creates a box. Its centre is sma (the 5-bar average of hl2) and its half-height is 2 × size, where size is the 150-bar average candle range. Example: sma = 2,650.0, size = 2.5 gives a top of 2,655.0 and a bottom of 2,645.0. The left edge is set 10 bars back (bar 101 in the example), so the box appears 10 bars after it actually began. From then on the right edge is stretched to the current bar on every bar, and the top and bottom never move.
- Detecting the breakout (Layer 8): a break up happens when low has just moved above the box top (the previous low was at or below the top, this low is above it), meaning the whole candle sits over the box. A break down happens when high has just dropped below the box bottom. A wick touch is not enough. When it happens the box is filled with vol_up or vol_dn, labelled, and then closed (the box variable is emptied), so each box signals at most once.
- The "+" rule (Layer 8): if the box is narrower than 18 bars when it breaks, the text is "+▲" or "+▼"; otherwise "▲" or "▼". Because the left edge sits 10 bars back, "+" means price broke out within 7 bars after the box appeared. Example: a box that starts at bar 101 and breaks at bar 115 is 14 wide, below 18, so it reads "+▲".
- The second-box branch (Layer 6): the code has one more branch that creates a box when the counter passes 50 and no box is open (white border). Its last condition reads the left edge of an empty box, so it most likely never passes. This has not been confirmed on a real chart.
- The blue band (Layer 6): its colour is a gradient driven by the counter: transparent at 10 or below, deep blue #18629e at 100 or above.
Outputs: drawings, orders, alerts
- The outputs are the drawings in the last layer of the flowchart: the RSI line, the blue band, the grey box, the ▲ or ▼ box and, optionally, the RSI EMA line. The indicator places no orders and has no alerts.
- The only trading signal is the moment a box changes colour. The trade direction is the direction of the breakout, not the direction of RSI.
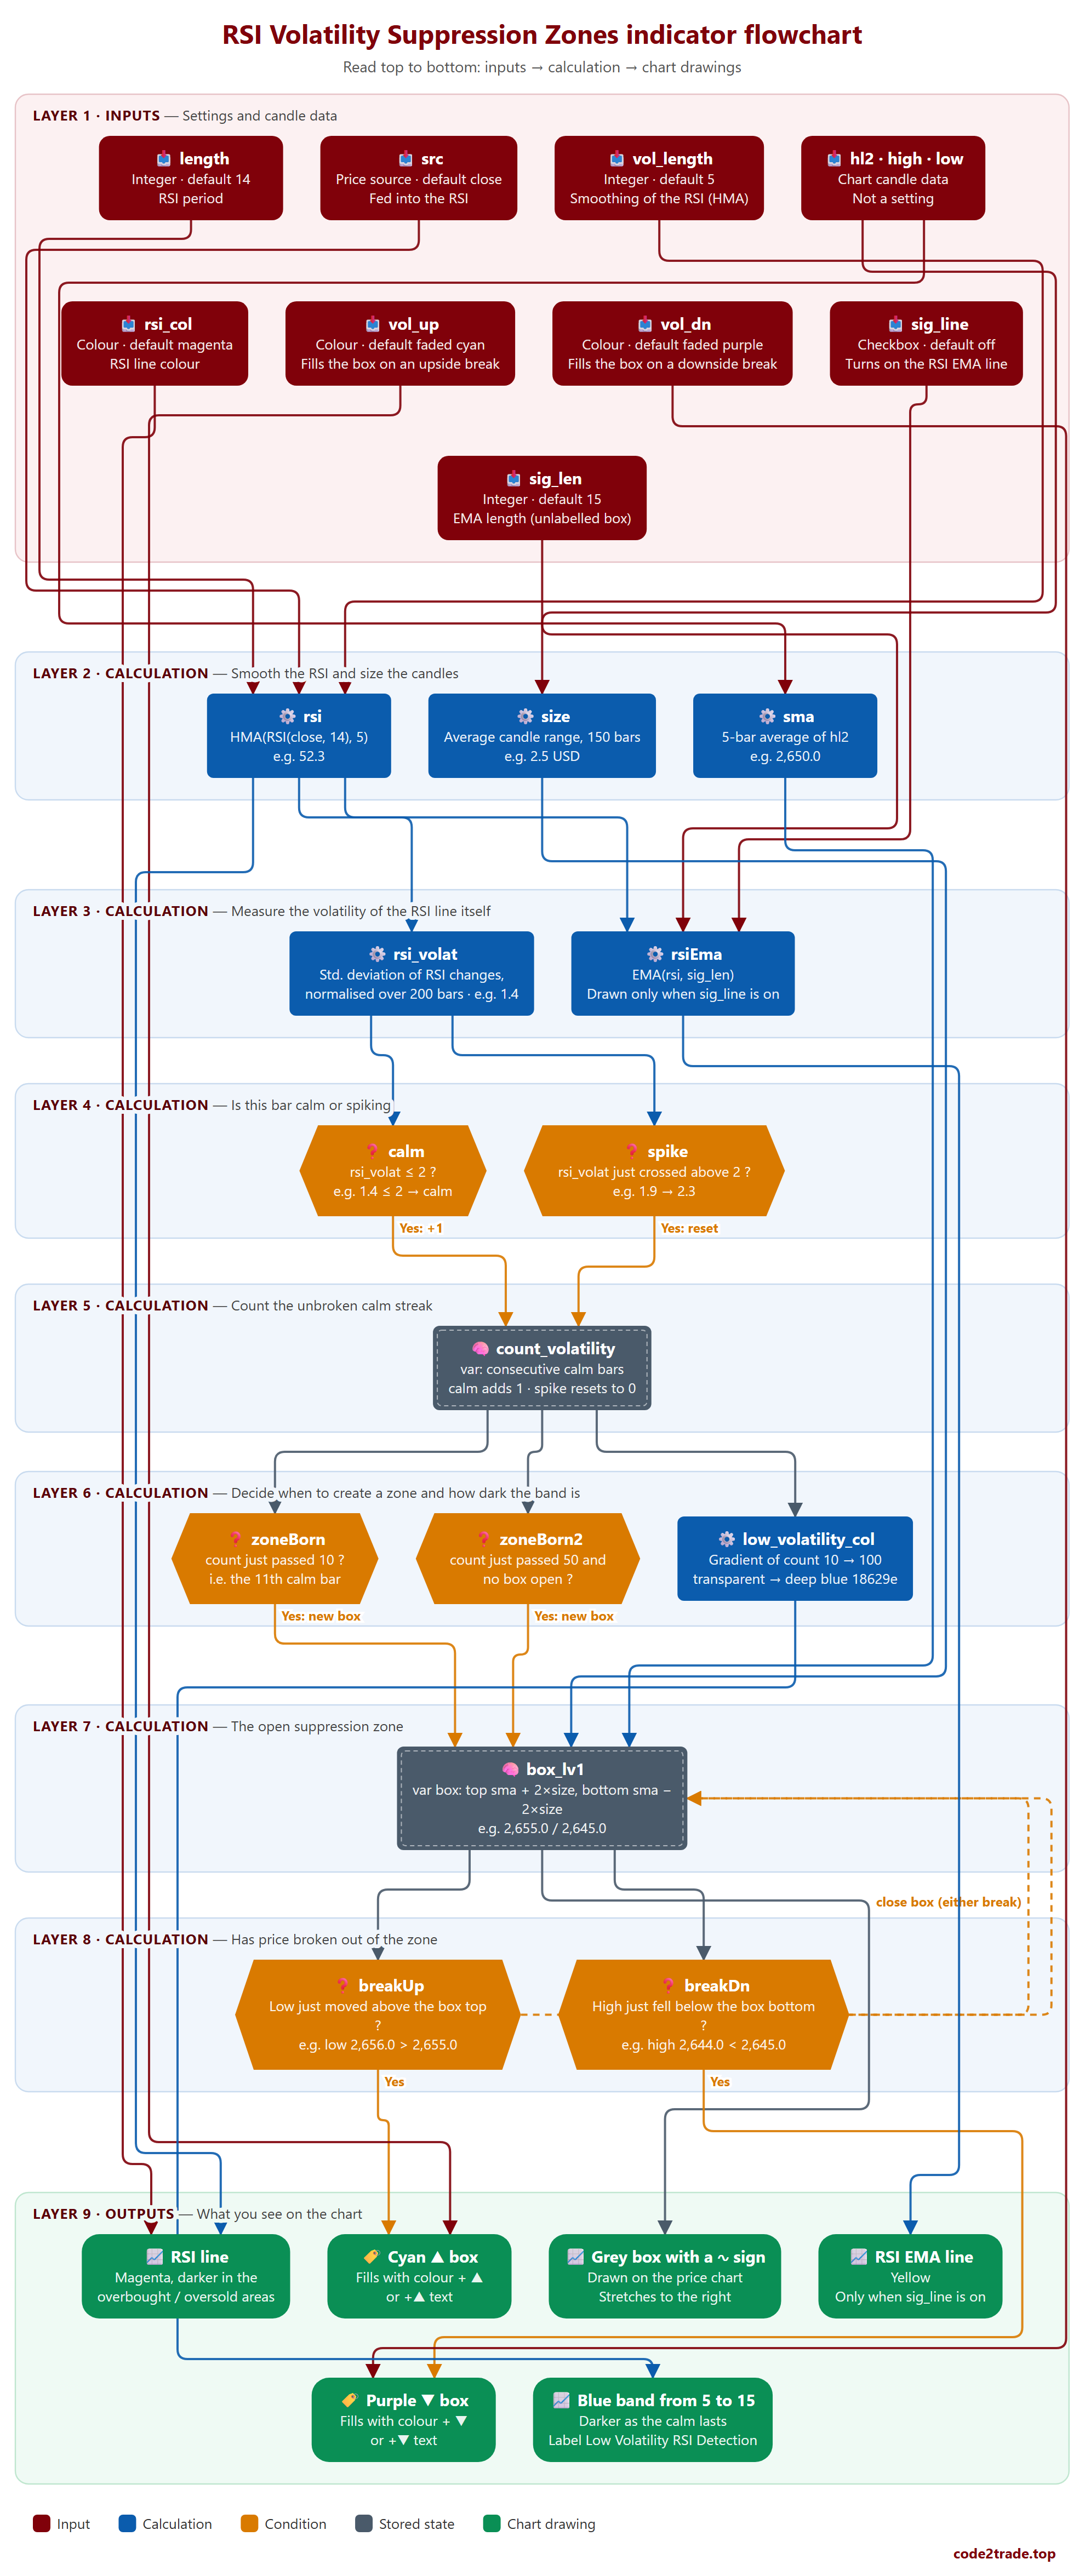
RSI volatility suppression indicator flowchart, layer by layer

How to read the flowchart, layer by layer
Read the flowchart from top to bottom: each layer only uses results from the layer above it; the last layer is what you see on the chart. The dashed arrow is the memory loop: once price breaks out of a zone, the indicator closes that zone.
- Layer 1 — Inputs: Settings and candle data.
- length — Integer · default 14; RSI period → leads to: rsi
- src — Price source · default close; Fed into the RSI → leads to: rsi
- vol_length — this box is labelled "Volatility" in the Settings dialog, but in the code it is only the smoothing length of the RSI line. → leads to: rsi
- hl2 · high · low — Chart candle data; Not a setting → leads to: size, sma
- rsi_col — Colour · default magenta; RSI line colour → leads to: RSI line
- vol_up — Colour · default faded cyan; Fills the box on an upside break → leads to: Cyan ▲ box
- vol_dn — Colour · default faded purple; Fills the box on a downside break → leads to: Purple ▼ box
- sig_line — Checkbox · default off; Turns on the RSI EMA line → leads to: rsiEma
- sig_len — Integer · default 15; EMA length (unlabelled box) → leads to: rsiEma
- Layer 2 — Calculation: Smooth the RSI and size the candles.
- rsi — HMA(RSI(close, 14), 5); e.g. 52.3 → leads to: rsi_volat, rsiEma, RSI line
- size — Average candle range, 150 bars; e.g. 2.5 USD → leads to: box_lv1
- sma — 5-bar average of hl2; e.g. 2,650.0 → leads to: box_lv1
- Layer 3 — Calculation: Measure the volatility of the RSI line itself.
- rsi_volat — the Volatility() function takes the log of RSI now / RSI one bar ago, measures its 5-bar standard deviation, multiplies by 100, then divides by that value's own 200-bar standard deviation. → leads to: calm, spike
- rsiEma — EMA(rsi, sig_len); Drawn only when sig_line is on → leads to: RSI EMA line
- Layer 4 — Calculation: Is this bar calm or spiking.
- calm — rsi_volat ≤ 2 ?; e.g. 1.4 ≤ 2 → calm → leads to: count_volatility (Yes: +1)
- spike — rsi_volat just crossed above 2 ?; e.g. 1.9 → 2.3 → leads to: count_volatility (Yes: reset)
- Layer 5 — Calculation: Count the unbroken calm streak.
- count_volatility — var: consecutive calm bars; calm adds 1 · spike resets to 0 → leads to: zoneBorn, zoneBorn2, low_volatility_col
- Layer 6 — Calculation: Decide when to create a zone and how dark the band is.
- zoneBorn — count just passed 10 ?; i.e. the 11th calm bar → leads to: box_lv1 (Yes: new box)
- zoneBorn2 — the branch for a second box (white border). Its last condition reads the left edge of a box that is empty (na), so it most likely never passes — worth checking on a real chart. → leads to: box_lv1 (Yes: new box)
- low_volatility_col — Gradient of count 10 → 100; transparent → deep blue 18629e → leads to: Blue band from 5 to 15
- Layer 7 — Calculation: The open suppression zone.
- box_lv1 — every bar the indicator stretches the box's right edge to the current bar; top and bottom never change during its life. The left edge sits 10 bars back from the creation bar. → leads to: breakUp, breakDn, Grey box with a ∿ sign
- Layer 8 — Calculation: Has price broken out of the zone.
- breakUp — Low just moved above the box top ?; e.g. low 2,656.0 > 2,655.0 → leads to: Cyan ▲ box (Yes) ↺ loops back to update (dashed): box_lv1 (close box (either break))
- breakDn — High just fell below the box bottom ?; e.g. high 2,644.0 < 2,645.0 → leads to: Purple ▼ box (Yes) ↺ loops back to update (dashed): box_lv1
- Layer 9 — Outputs: What you see on the chart.
- RSI line — Magenta, darker in the; overbought / oversold areas
- RSI EMA line — Yellow; Only when sig_line is on
- Blue band from 5 to 15 — Darker as the calm lasts; Label Low Volatility RSI Detection
- Grey box with a ∿ sign — Drawn on the price chart; Stretches to the right
- Cyan ▲ box — Fills with colour + ▲; or +▲ text
- Purple ▼ box — Fills with colour + ▼; or +▼ text
This flowchart and analysis were built with AI following the Zero2Hero course: create indicators and trading bots using AI, no coding required.
RSI suppression zone box FAQ
Does this indicator work for forex, gold or crypto?
It has only been tested on gold (XAUUSD) on the M15 timeframe. Other forex pairs, crypto and stocks have not been tested yet.
Is the RSI Volatility Suppression Zones indicator profitable?
The original indicator only draws, so it has no trading results by itself. The strategy version built from it produced the figures in the quick summary: 183 trades, 60.11% winners and a 1.733 profit factor on gold M15 from 2025-12-01 to 2026-10-31. That is one backtest over one period and says nothing certain about the future.
Why does changing the "Volatility" setting not change the box size?
Because that box is really the smoothing length of the RSI line (vol_length). The box width is always plus or minus two times the 150-bar average candle range, and the calm threshold is always 2; both are fixed in the code.
Is there an automated MT5 or OKX version?
The original indicator places no orders, so turning it into a bot is a separate job. See how to connect AI to MetaTrader 5 in one click (in Vietnamese).
Can I get this indicator customised?
Yes — Code2Trade offers a custom TradingView indicator and trading bot coding service (Pine Script, MT5); send your request through the Code2Trade contact form.
For educational purposes only, not investment advice. Trading involves risk of loss.