Linear Regression Channel TradingView indicator
Draws a regression trend line with two bands around the last 100 bars · a trend-reading tool with no buy/sell signals or alerts
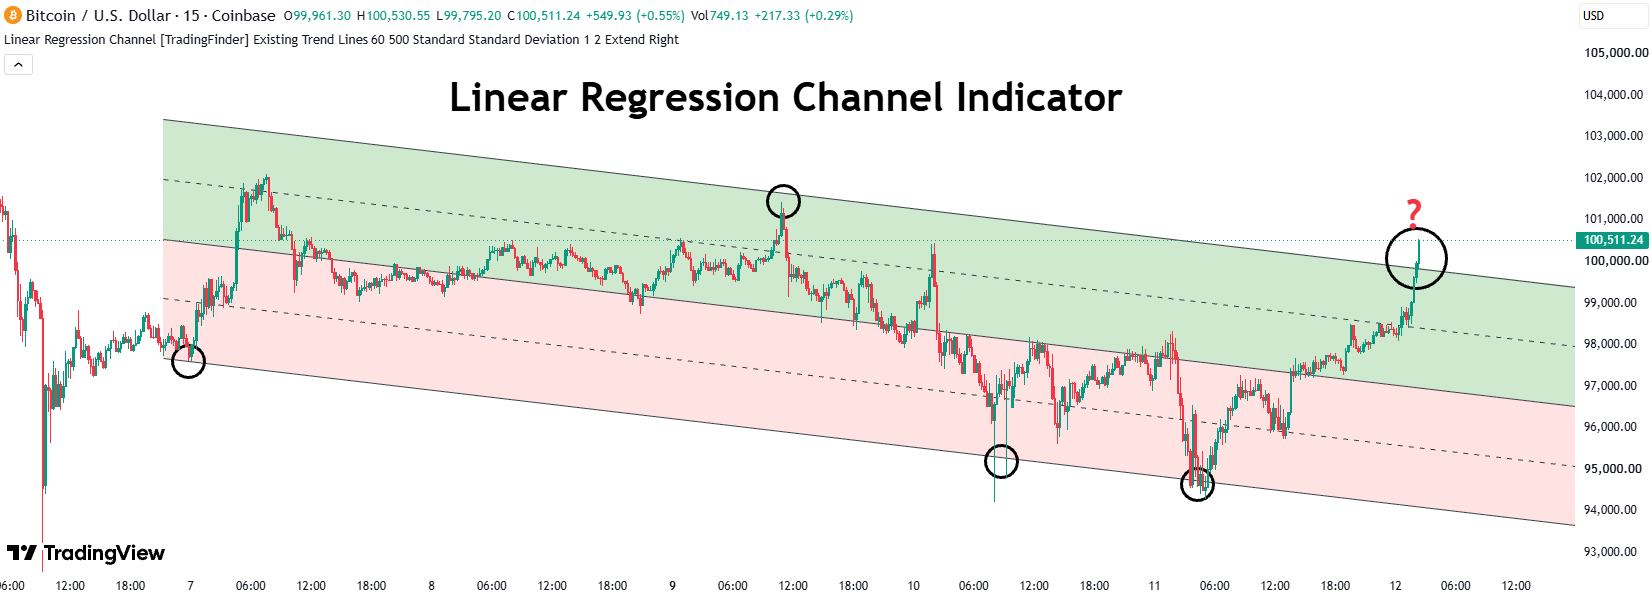
Quick summary: The Linear Regression Channel indicator for TradingView fits a channel to the last 100 bars: a trend line through the middle plus two pairs of evenly spaced bands, shaded light green above the line and light red below it. It has no entry signals and no alerts, so it is a tool for reading trend direction and how far price has stretched from the trend; this page has no backtest numbers for the indicator (see the FAQ).
What is the Linear Regression Channel indicator? The idea behind it
One hundred closing prices in a row look like a scatter of dots, yet they usually drift in a direction: up, down or sideways. Linear regression finds the single straight line that sits closest to all of those dots (the smallest total of squared distances). Think of it as the "fair price along the trend" for that window: the slope tells you which way the market is moving and how fast.
Two assumptions sit behind the tool. First, in a reasonably steady trend, price tends to be pulled back toward the trend line after it stretches away. Second, the further price strays, measured in units of the market's own volatility, the more unusual the move is and the more it deserves your attention, whether the chart is gold, forex or crypto. The outer bands do not forecast anything; they act as a ruler for how many volatility units price sits away from the trend.
If you are comparing ways to read price channels and trends, browse more tools in the Code2Trade free TradingView indicator library.
What a regression channel shows on the chart
Chart drawings
- Five black lines: a solid middle line (the regression line), two dashed lines at the ±1 level and two solid lines at the ±2 level (one above, one below the middle). The colour and thickness are fixed; there is no setting for them.
- Upper shaded zone: from the middle line up to the +2 line, light green (#4CAF4F at about 27% opacity).
- Lower shaded zone: from the middle line down to the −2 line, light red (#FF5252 at about 17% opacity).
- Only one channel is visible on the chart, the one for the latest 100 bars. It runs from the bar 100 bars back to the current bar, and can be extended to the left, the right or both.
Alerts
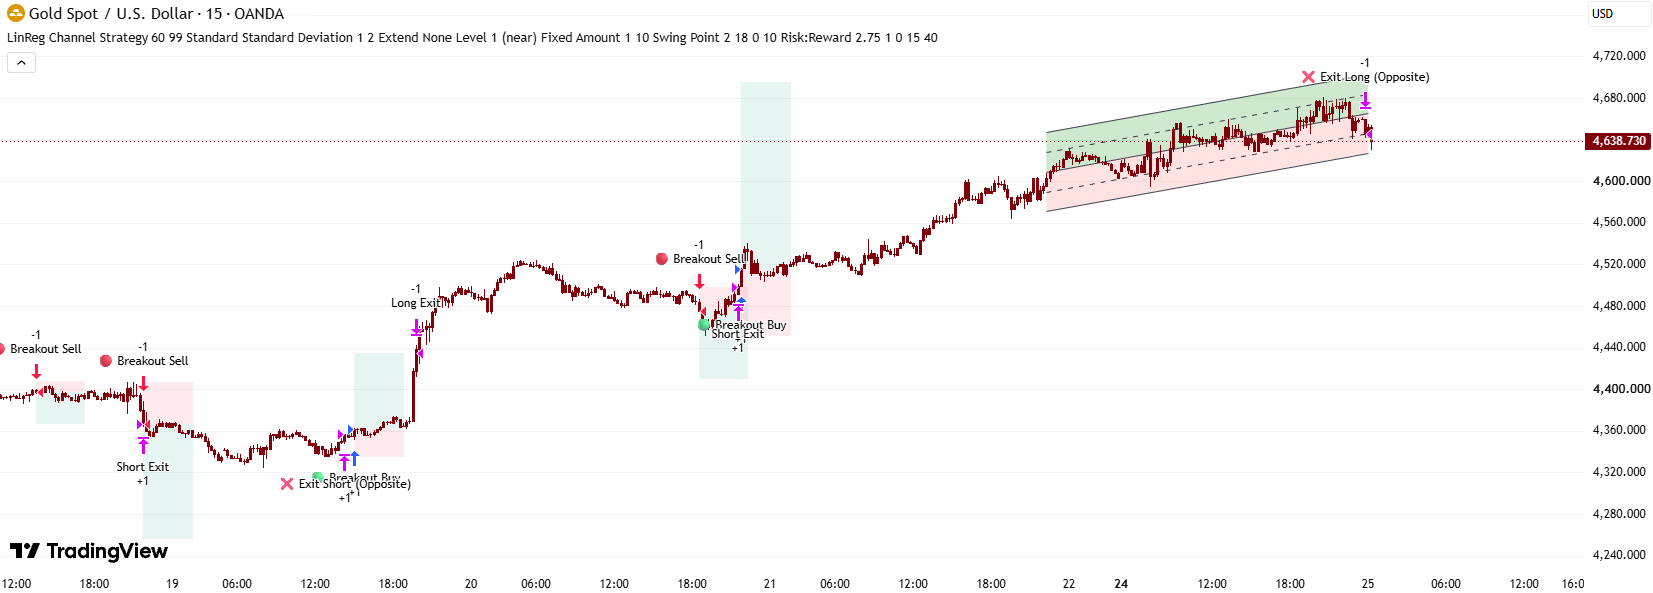
- The indicator contains no alertcondition() or alert() call. To be notified when price touches a channel line you must create a price alert in TradingView yourself or have the code extended.
How to trade with a linear regression channel
The indicator gives no signals, so the setups below are ways to read the channel and decide for yourself, not rules from the author. The numbers are hypothetical examples to make the idea concrete, not results taken from a real chart.
Long setup
Look for a middle line that slopes up (say left end 2,640, right end 2,668). Wait for price to pull back to the −1 line (2,656) or the −2 line (2,644), then buy when a bar closes back above the line it touched. Put the Stop Loss below the −2 line with a small buffer; the first target is the middle line (2,668) and a further target is the +1 line (2,680). With an entry at 2,658 and a stop at 2,642, the +1 target gives roughly 22 points of reward for 16 of risk.
Short setup
Mirror image: the middle line slopes down, price rallies to the +1 or +2 line, and you sell when a bar closes back below it. Stop above the +2 line, targets at the middle line and then the −1 line.
When NOT to use it
- Do not backtest by eye on the chart. Only the newest channel remains; the channels belonging to earlier bars were deleted. A past "touch the band and reverse" you can see was not what the indicator was displaying at that time.
- In a strong one-way trend, price tends to hug the middle line and rarely reaches the bands, so waiting for a band touch there may never give you an entry.
- When a big bar leaves the window, the slope and position of the channel can jump simply because that bar dropped out of the latest 100.
- When a higher timeframe is selected, a higher-timeframe bar that has not closed yet keeps moving the channel with the live price; do not enter on a line that is not final.
Because the channel only provides context, many traders pair it with a confirming tool such as momentum or volume; you can also merge several TradingView indicators into one without coding (in Vietnamese).
How the regression channel is calculated, from settings to the five lines
Output first: only one channel survives because every bar redraws and deletes
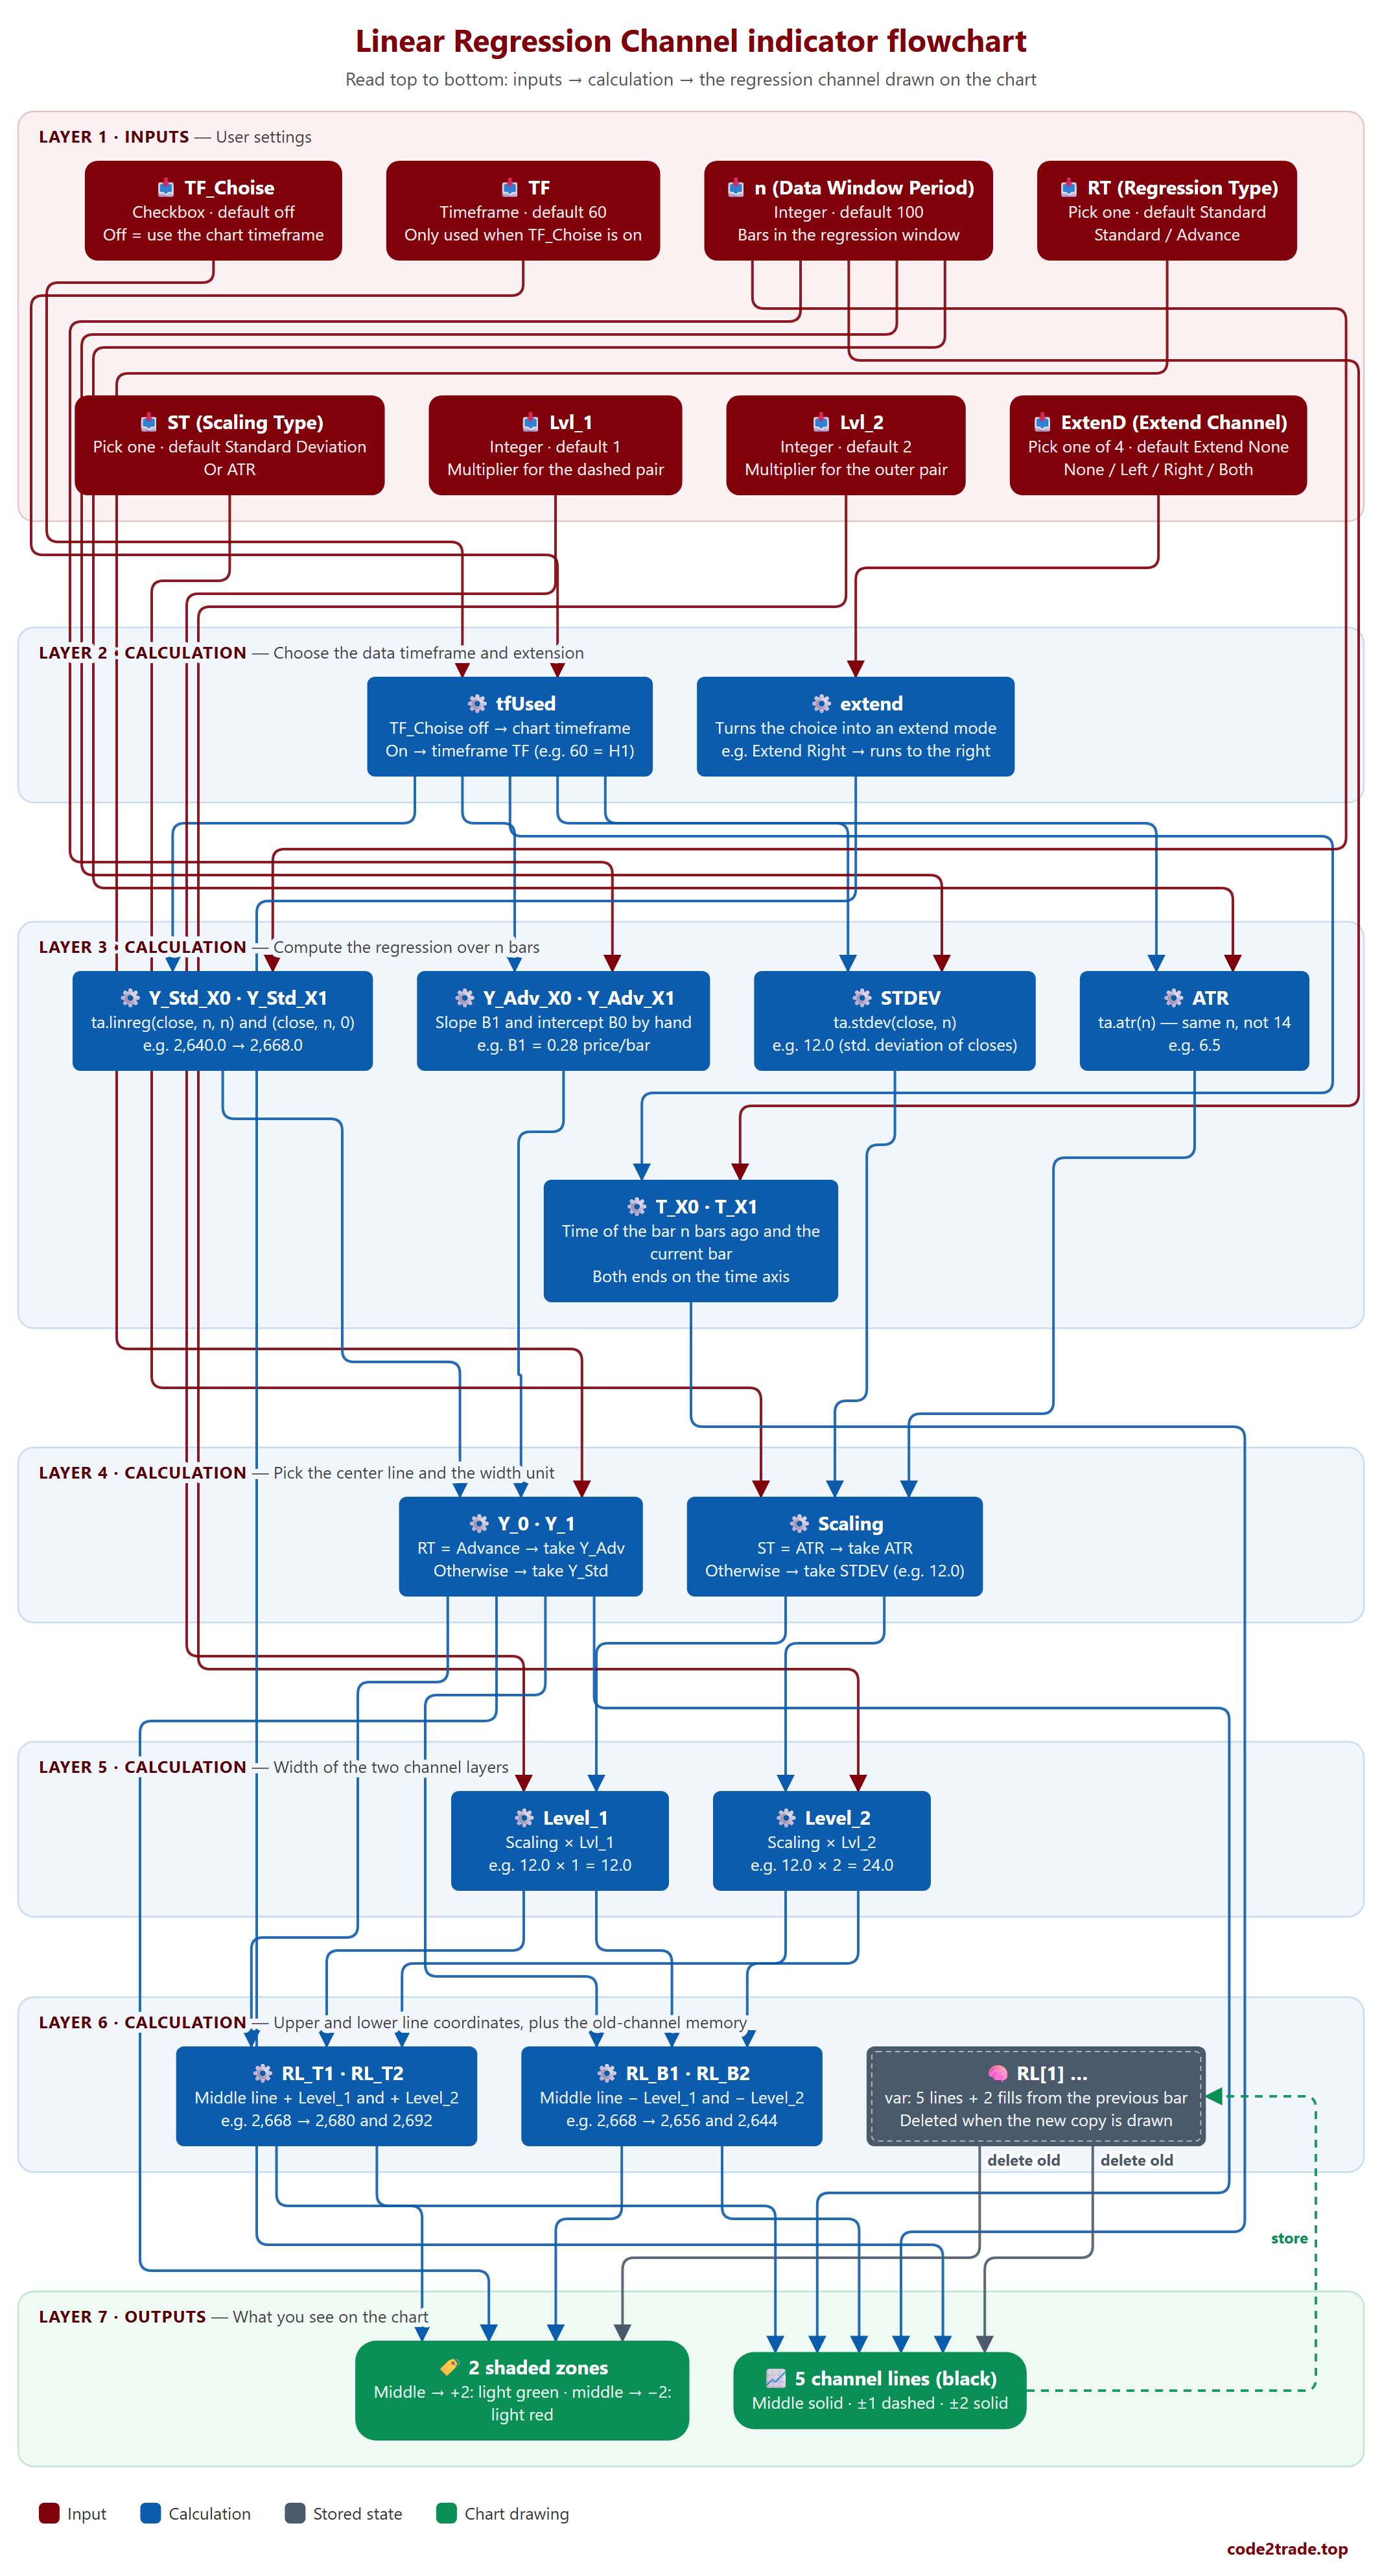
- On every bar the ChannelDrawing function creates 5 lines (RL, RL_T1, RL_T2, RL_B1, RL_B2) and 2 fills, then immediately deletes the previous bar's copy with line.delete(RL[1]). Once the history has loaded, exactly one channel is left, for the latest window. Each line joins T_X0 (the bar n bars back) to T_X1 (the current bar) (Layers 6–7 in the flowchart).
- The middle line comes from Y_0 → Y_1. The upper and lower lines add or subtract Level_1 and Level_2 at both ends, so they run parallel to the middle line. Example: Y_1 = 2,668, Level_1 = 12.0, Level_2 = 24.0 → lines at 2,680 / 2,692 (above) and 2,656 / 2,644 (below) (Layers 5–6 in the flowchart).
Inputs and what each one does
- n ("Data Window Period", integer, default 100): the number of bars in the regression window. Lower it to 50 → the middle line hugs price, its slope turns quickly and the channel is short. Raise it to 200 → a long, smooth channel that is slow to turn. The field has no minimum, so a very small value (1–2) makes the regression meaningless. (Layer 1 in the flowchart)
- TF_Choise ("Time Frame", checkbox, default off) and TF (timeframe picker, default 60): off → the calculation uses the chart's timeframe; on → everything is computed on timeframe TF through request.security. On an M15 chart with TF = 60, the channel is the regression of 100 H1 bars (about 4 days of continuous trading) drawn on the M15 chart. The TF picker has no label of its own; it sits next to the checkbox. (Layer 2 in the flowchart)
- RT ("Regression Type", "Standard" / "Advance", default Standard): picks which branch supplies the two ends of the middle line. "Standard" uses the built-in ta.linreg; "Advance" computes the slope B1 and intercept B0 by hand with the least-squares formula. Both branches fit the same line, so according to the code's formulas they can differ only by rounding error (I have not compared individual values on a chart). (Layers 3–4 in the flowchart)
- ST ("Scaling Type", "Standard Deviation" / "ATR", default Standard Deviation): the unit used to measure channel width. Standard Deviation → the standard deviation of the closing prices over n bars. ATR → the average range of a candle, computed over the same length n (100), not the familiar 14, so it is quite smooth. (Layers 3–4 in the flowchart)
- Lvl_1 (default 1) and Lvl_2 (default 2), both integers: multiplied by the width unit to place the dashed pair and the outer pair. Set Lvl_2 = 3 → the outer lines sit 1.5 times further out (12.0 × 3 = 36.0 instead of 24.0) and the shading stretches with them. Being integers, they cannot be set to 1.5 or 2.5. (Layer 5 in the flowchart)
- ExtenD ("Extend Channel", default "Extend None"): "Extend Right" pushes all 5 lines to the right to project the trend forward; "Extend Left" pushes them left; "Extend Both" does both. It only changes how long the lines are, not any number. (Layer 2 in the flowchart)
Main calculation blocks
- Regression over 100 bars (Layer 3): the horizontal axis is the bar number, the vertical axis is the closing price. With a left end of 2,640 and a right end of 2,668, the slope B1 = (2,668 − 2,640) / 100 = 0.28 price units per bar.
- Width is measured around the average price, not around the regression line (Layers 3–4): STDEV = ta.stdev(close, n) is the standard deviation of the closes from the mean of the whole window, so it includes the part of price that simply drifted with the trend. Example: price climbing cleanly from 2,600 to 2,700 over 100 bars gives STDEV ≈ 28.9, so the ±2 lines sit about 57.7 from the middle line while price hugs the middle line almost exactly. In a sideways market the two measures nearly coincide and the channel fits price far more sensibly.
- Choosing the width unit (Layers 4–5): Scaling is ATR if ST is set to ATR, otherwise STDEV. Level_1 = Scaling × Lvl_1, Level_2 = Scaling × Lvl_2.
- Higher timeframe (if enabled): all of the above runs on timeframe TF; the two end times are that timeframe's bar open times, so the lines can finish earlier than the chart's current bar.
Outputs: drawings, orders, alerts
- The only output is drawings: 5 lines and 2 shaded zones. The zone colours are fixed by position (green above, red below) and do not change with the slope of the channel, so the colour is not a bullish or bearish signal. There are no order entries and no alerts. (Last layer in the flowchart)
Linear Regression Channel flowchart, layer by layer

How to read the flowchart, layer by layer
Read the flowchart from top to bottom: each layer only uses results from the layer above it; the last layer is the regression channel you see on the chart.
- Layer 1 — Inputs: User settings.
- TF_Choise — Checkbox · default off; Off = use the chart timeframe → leads to: tfUsed
- TF — Timeframe · default 60; Only used when TF_Choise is on → leads to: tfUsed
- n (Data Window Period) — Integer · default 100; Bars in the regression window → leads to: Y_Std_X0 · Y_Std_X1, Y_Adv_X0 · Y_Adv_X1, STDEV, ATR, T_X0 · T_X1
- RT (Regression Type) — Pick one · default Standard; Standard / Advance → leads to: Y_0 · Y_1
- ST (Scaling Type) — Pick one · default Standard Deviation; Or ATR → leads to: Scaling
- Lvl_1 — Integer · default 1; Multiplier for the dashed pair → leads to: Level_1
- Lvl_2 — Integer · default 2; Multiplier for the outer pair → leads to: Level_2
- ExtenD (Extend Channel) — Pick one of 4 · default Extend None; None / Left / Right / Both → leads to: extend
- Layer 2 — Calculation: Choose the data timeframe and extension.
- tfUsed — every regression calculation below runs on this timeframe inside request.security; a chart on M15 with 60 selected gets a channel built from 100 H1 bars. → leads to: Y_Std_X0 · Y_Std_X1, Y_Adv_X0 · Y_Adv_X1, STDEV, ATR, T_X0 · T_X1
- extend — Turns the choice into an extend mode; e.g. Extend Right → runs to the right → leads to: 5 channel lines (black)
- Layer 3 — Calculation: Compute the regression over n bars.
- Y_Std_X0 · Y_Std_X1 — the two ends of the regression line built with TradingView's own function: left end n bars ago, right end at the current bar. → leads to: Y_0 · Y_1
- Y_Adv_X0 · Y_Adv_X1 — the same least-squares regression line as the Standard branch, written out as a manual formula; they differ only by rounding error. → leads to: Y_0 · Y_1
- STDEV — ta.stdev(close, n); e.g. 12.0 (std. deviation of closes) → leads to: Scaling
- ATR — ta.atr(n) — same n, not 14; e.g. 6.5 → leads to: Scaling
- T_X0 · T_X1 — Time of the bar n bars ago and the current bar; Both ends on the time axis → leads to: 5 channel lines (black)
- Layer 4 — Calculation: Pick the center line and the width unit.
- Y_0 · Y_1 — the price of the middle line at its left and right ends; since both branches give the same line, switching RT barely changes the picture. → leads to: RL_T1 · RL_T2, RL_B1 · RL_B2, 5 channel lines (black), 2 shaded zones
- Scaling — ST = ATR → take ATR; Otherwise → take STDEV (e.g. 12.0) → leads to: Level_1, Level_2
- Layer 5 — Calculation: Width of the two channel layers.
- Level_1 — Scaling × Lvl_1; e.g. 12.0 × 1 = 12.0 → leads to: RL_T1 · RL_T2, RL_B1 · RL_B2
- Level_2 — Scaling × Lvl_2; e.g. 12.0 × 2 = 24.0 → leads to: RL_T1 · RL_T2, RL_B1 · RL_B2
- Layer 6 — Calculation: Upper and lower line coordinates, plus the old-channel memory.
- RL_T1 · RL_T2 — Middle line + Level_1 and + Level_2; e.g. 2,668 → 2,680 and 2,692 → leads to: 5 channel lines (black), 2 shaded zones
- RL_B1 · RL_B2 — Middle line − Level_1 and − Level_2; e.g. 2,668 → 2,656 and 2,644 → leads to: 5 channel lines (black), 2 shaded zones
- RL[1] … — var: 5 lines + 2 fills from the previous bar; Deleted when the new copy is drawn → leads to: 5 channel lines (black) (delete old), 2 shaded zones (delete old)
- Layer 7 — Outputs: What you see on the chart.
- 5 channel lines (black) — on every bar the indicator redraws all 5 lines and deletes the previous bar's copy, so only one channel is left: the latest window. ↺ loops back to update (dashed): RL[1] … (store)
- 2 shaded zones — Middle → +2: light green · middle → −2: light red
This flowchart and analysis were built with AI following the Zero2Hero course: create indicators and trading bots using AI, no coding required.
Linear Regression Channel indicator FAQ
Does this indicator work for forex, gold or crypto?
The formulas use only the closing price, so technically it draws on any market with a TradingView chart. This page has not tested any particular market, though, so I make no claim about how well it works on forex, gold or crypto.
Is the Linear Regression Channel indicator profitable?
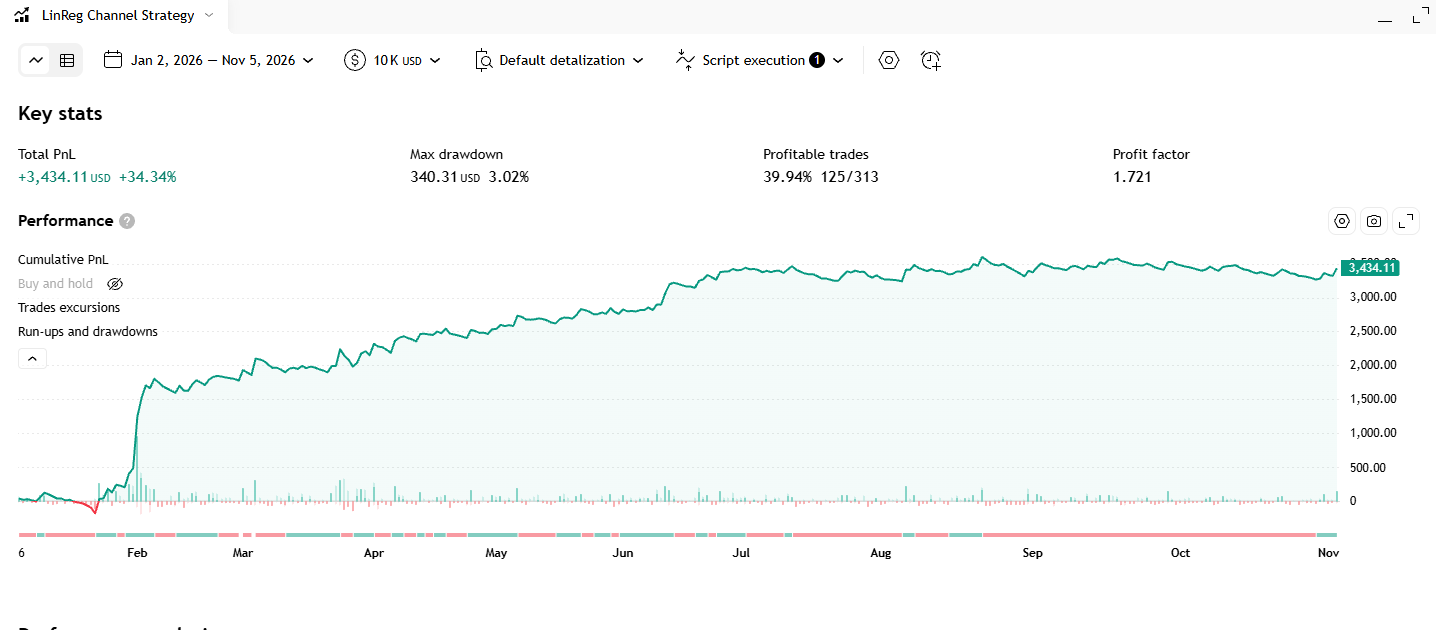
It has no entry or exit rules, so there is no win rate to quote. A strategy built on the channel can be backtested separately; those results are not published on this page.
Why does the chart show only one channel? Where are the old ones?
By design: on each bar the indicator deletes the previous channel and draws a new one, so the chart keeps only the channel for the last 100 bars. To study how the channel evolved over time you would need a version that stores the line values bar by bar.
What is the difference between Standard and Advance regression?
According to the code, both fit the same least-squares line, just written in two ways. Leave it on Standard; the settings that visibly change the picture are "Scaling Type" and the Lvl_1 / Lvl_2 multipliers.
Is there an automated MT5 or OKX version?
This page covers only the TradingView indicator. If you want to run a channel-based strategy, see how to connect AI to MetaTrader 5 in one click (in Vietnamese).
Can I get this indicator customised?
Yes — Code2Trade offers a custom TradingView indicator and trading bot coding service (Pine Script, MT5); send your request through the Code2Trade contact form.
For educational purposes only, not investment advice. Trading involves risk of loss.