Future Trend Channel TradingView indicator
Draws a trend channel that only flips direction once price closes outside a long-run SMA-plus-ATR band, then projects a future price by extrapolating the channel's own average slope — not yet backtested on real market data.
Quick summary: The Future Trend Channel indicator draws a trend channel around price that only flips direction once a candle closes clearly outside a long-run volatility band (a 100-bar SMA plus/minus a 200-bar ATR), then extends that channel and projects a future price by extrapolating its own mid-line slope · no backtest data on a specific symbol or timeframe exists yet — this page analyses the original ChartPrime source code directly.
What is the Future Trend Channel indicator? The idea behind it
The logic follows a familiar trend-following assumption: an ordinary pullback shouldn't be enough to push price outside a band measured by long-run ATR (a volatility indicator) around a 100-bar moving average. Only when price actually closes beyond that band does the script treat it as a genuine regime change, rather than short-term noise.
Once confirmed, the indicator doesn't redraw from scratch every bar — it builds a channel that tracks a 20-bar-smoothed version of price from the exact moment of confirmation onward, with its width scaled by that same ATR measure. Because the anchor point (the confirmation bar) stays fixed while the far end keeps moving, the slope between those two points is effectively the "average pace" of the whole trend run so far — and the indicator uses that exact slope to draw a straight line forward, projecting where price would land if that pace continued.
Comparing several ways to read trend channels? Browse related tools in the Code2Trade free TradingView indicator library.
What the Future Trend Channel indicator shows on the chart
Chart drawings
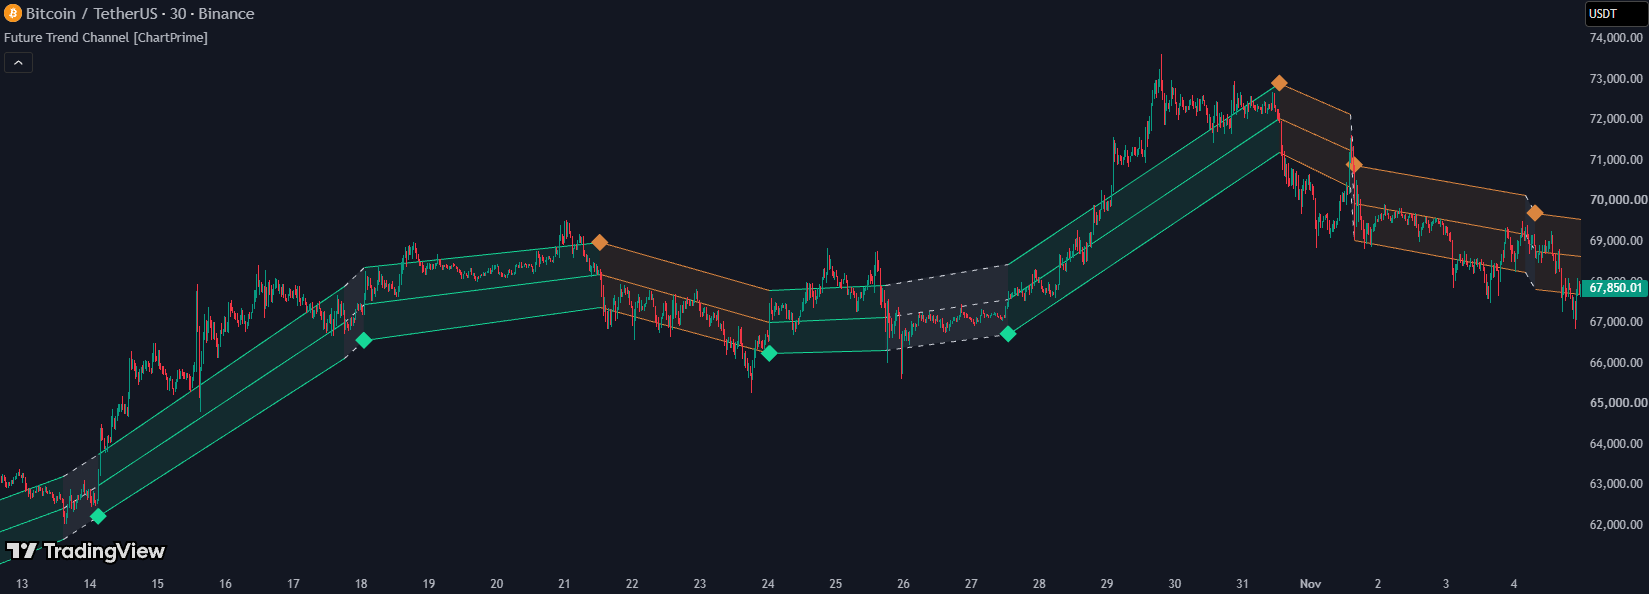
- Trend channel (3 lines + fill): a mid-line, a top line and a bottom line, with a 90%-transparent fill between the top and bottom. While the channel's own slope still agrees with its expected direction, all three lines are solid and coloured teal (default) for an up-phase or orange (default) for a down-phase; once the channel's own slope drifts against that expected direction, all three switch to a dashed, neutral colour (the chart's default text colour).
- ◆ channel-start label: a diamond marker placed exactly on the bar where the trend flipped, coloured to match the channel — and also faded fully invisible whenever that channel is currently "disagreeing" with its own direction under the check above.
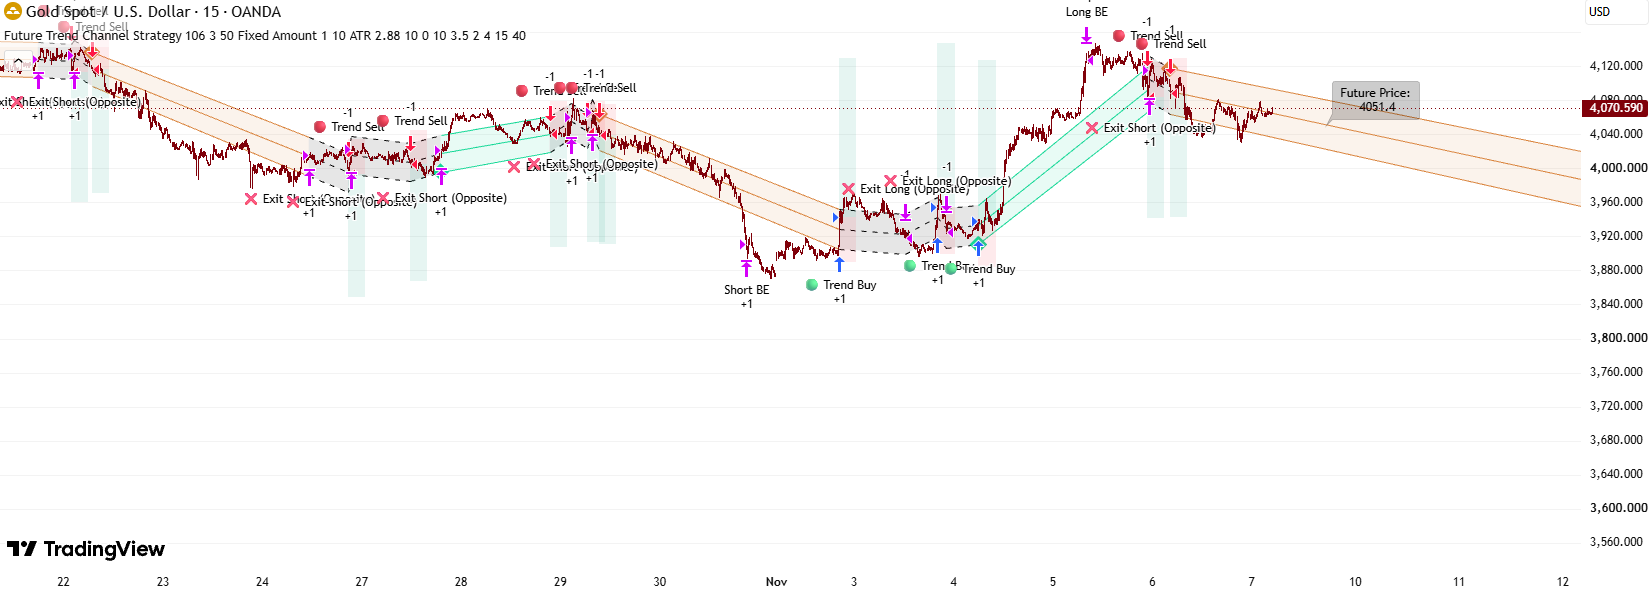
- Future-price label: a text tag showing a projected price, placed a user-set number of bars ahead of the current bar, in the chart's default text colour (not coloured by direction).
Alerts
- This indicator has no built-in alerts in the original code (no alertcondition() calls). To get notified when the channel flips, you would need to build a manual TradingView alert off the line colour/style, or have the code extended.
How to trade with the Future Trend Channel indicator
Long setup
Wait for all three channel lines to turn fully solid teal (not dashed) — meaning price has just closed above the 100-bar-SMA-plus-ATR band, and the freshly drawn channel's own slope is still moving up since confirmation. The ◆ label marks exactly where that channel started; a reasonable stop sits below the channel's bottom line, since a close back through it is what the indicator itself treats as the trend having reversed.
Short setup
The mirror image: wait for the channel to turn solid orange after price closes below the 100-bar-SMA-minus-ATR band. A reasonable stop sits above the down-channel's top line.
When NOT to use it
In a tight, sideways market, price can repeatedly cross the SMA±ATR band in both directions, causing the channel to flip back and forth and get "frozen" again after only a few bars — at that point neither the ◆ label nor the future-price label carries much meaning. The future-price label itself is only a straight-line extrapolation of the average slope since confirmation, not a probability-weighted forecast — don't treat it as a reliable take-profit target, especially once the trend is clearly accelerating or decelerating compared with its pace since it began.
How the Future Trend Channel indicator works
Inputs and what each one does
- length ("Trend Length"): integer, default 100. The number of bars used for the base SMA — the line price must break (plus/minus ATR) to count as a trend flip. Shorter confirms trends faster but with more noise; longer is slower but steadier. (Layer 1, 2 in the flowchart)
- multi ("Channel Width"): decimal, default 3, step 0.1. Multiplies ATR to set the width of the drawn channel once a flip is confirmed. Important: this input has no effect on when a flip is confirmed in the first place — that check only uses raw ATR, never multiplied by multi. (Layer 1, 7 in the flowchart)
- extend ("Index of future price"): integer, default 50. How many bars ahead of the current bar the future-price label is placed. At 50, the label always sits 50 bars ahead of whichever bar is currently last, however far the chart scrolls. (Layer 1, 9 in the flowchart)
- color_up / color_dn: two colour pickers, default teal and orange. Colour the up/down channel only while that channel is "agreeing" with its own direction — colours only, no effect on logic. (Layer 1, 8 in the flowchart)
Main calculation blocks
- Long-run volatility baseline: atr = the highest ATR(200) reading over the last 100 bars — a volatility "ceiling" that doesn't jump around bar to bar the way a raw ATR would. Example: today's ATR might read 12 points, but if the highest ATR(200) value over the last 100 bars was 18, atr is 18. (Layer 2 in the flowchart)
- Trend-confirmation band: upper = sma + atr, lower = sma − atr. Example: 100-bar SMA 2,640.0, atr 18 → upper 2,658.0, lower 2,622.0. (Layer 3 in the flowchart)
- Breakout detection: signal_up fires when the close just crossed above upper (e.g. close moving from 2,655 to 2,660, clearing 2,658); signal_dn is the mirror. Whichever fires updates a remembered trend flag that otherwise just holds its last value, bar after bar. (Layer 4, 5 in the flowchart)
- Building a new channel on a flip: on the exact bar trend changes (called flipUp / flipDn), the indicator anchors three brand-new lines (mid/top/bottom) at that bar's price plus/minus atr × multi, while simultaneously freezing the just-ended channel's lines at that same bar's raw price — it stops extending and stays put on the chart as a historical record. (Layer 6, 7 in the flowchart)
- Extending the active channel: on every later bar, while trend keeps the same value, the active channel's three lines are extended rightward — but their far edge isn't just today's raw price, it's a 20-bar average of (price ± atr×multi), a smoothing layer that keeps the channel from jerking around on any single noisy bar. (Layer 7 in the flowchart)
- Checking whether the colour still agrees: every bar, the indicator compares each channel's anchor point (at confirmation) with its current point (or its frozen point, if that channel has already ended). If the mid-line has genuinely moved the expected way since the anchor (an "up" channel's mid-line sitting higher than at its anchor; a "down" channel's sitting lower) it keeps its own colour and a solid line. If it has drifted the opposite way, it switches to a neutral, dashed line and its ◆ label fades out completely. This check runs on both the active channel and the frozen one, so even a historical, already-ended channel can show up dashed if its real path disagreed with the "up"/"down" label it was given. (Layer 8 in the flowchart)
- Projecting a future price: the indicator takes exactly two points off the active channel's mid-line — the anchor point at confirmation and the current (smoothed) point — computes the slope between them, and extends a straight line out to the current bar plus extend bars. Because the anchor is fixed while the other point keeps moving further away in time, this slope is the average pace of the entire trend run so far, not just the last few bars. (Layer 9 in the flowchart)
Outputs: drawings, orders, alerts
- The channel with its fill, the ◆ label and the future-price label are the three things you actually see on the chart — the indicator places no orders and raises no alerts of its own; any trading decision built on these drawings is entirely up to the user. (Last layer in the flowchart)
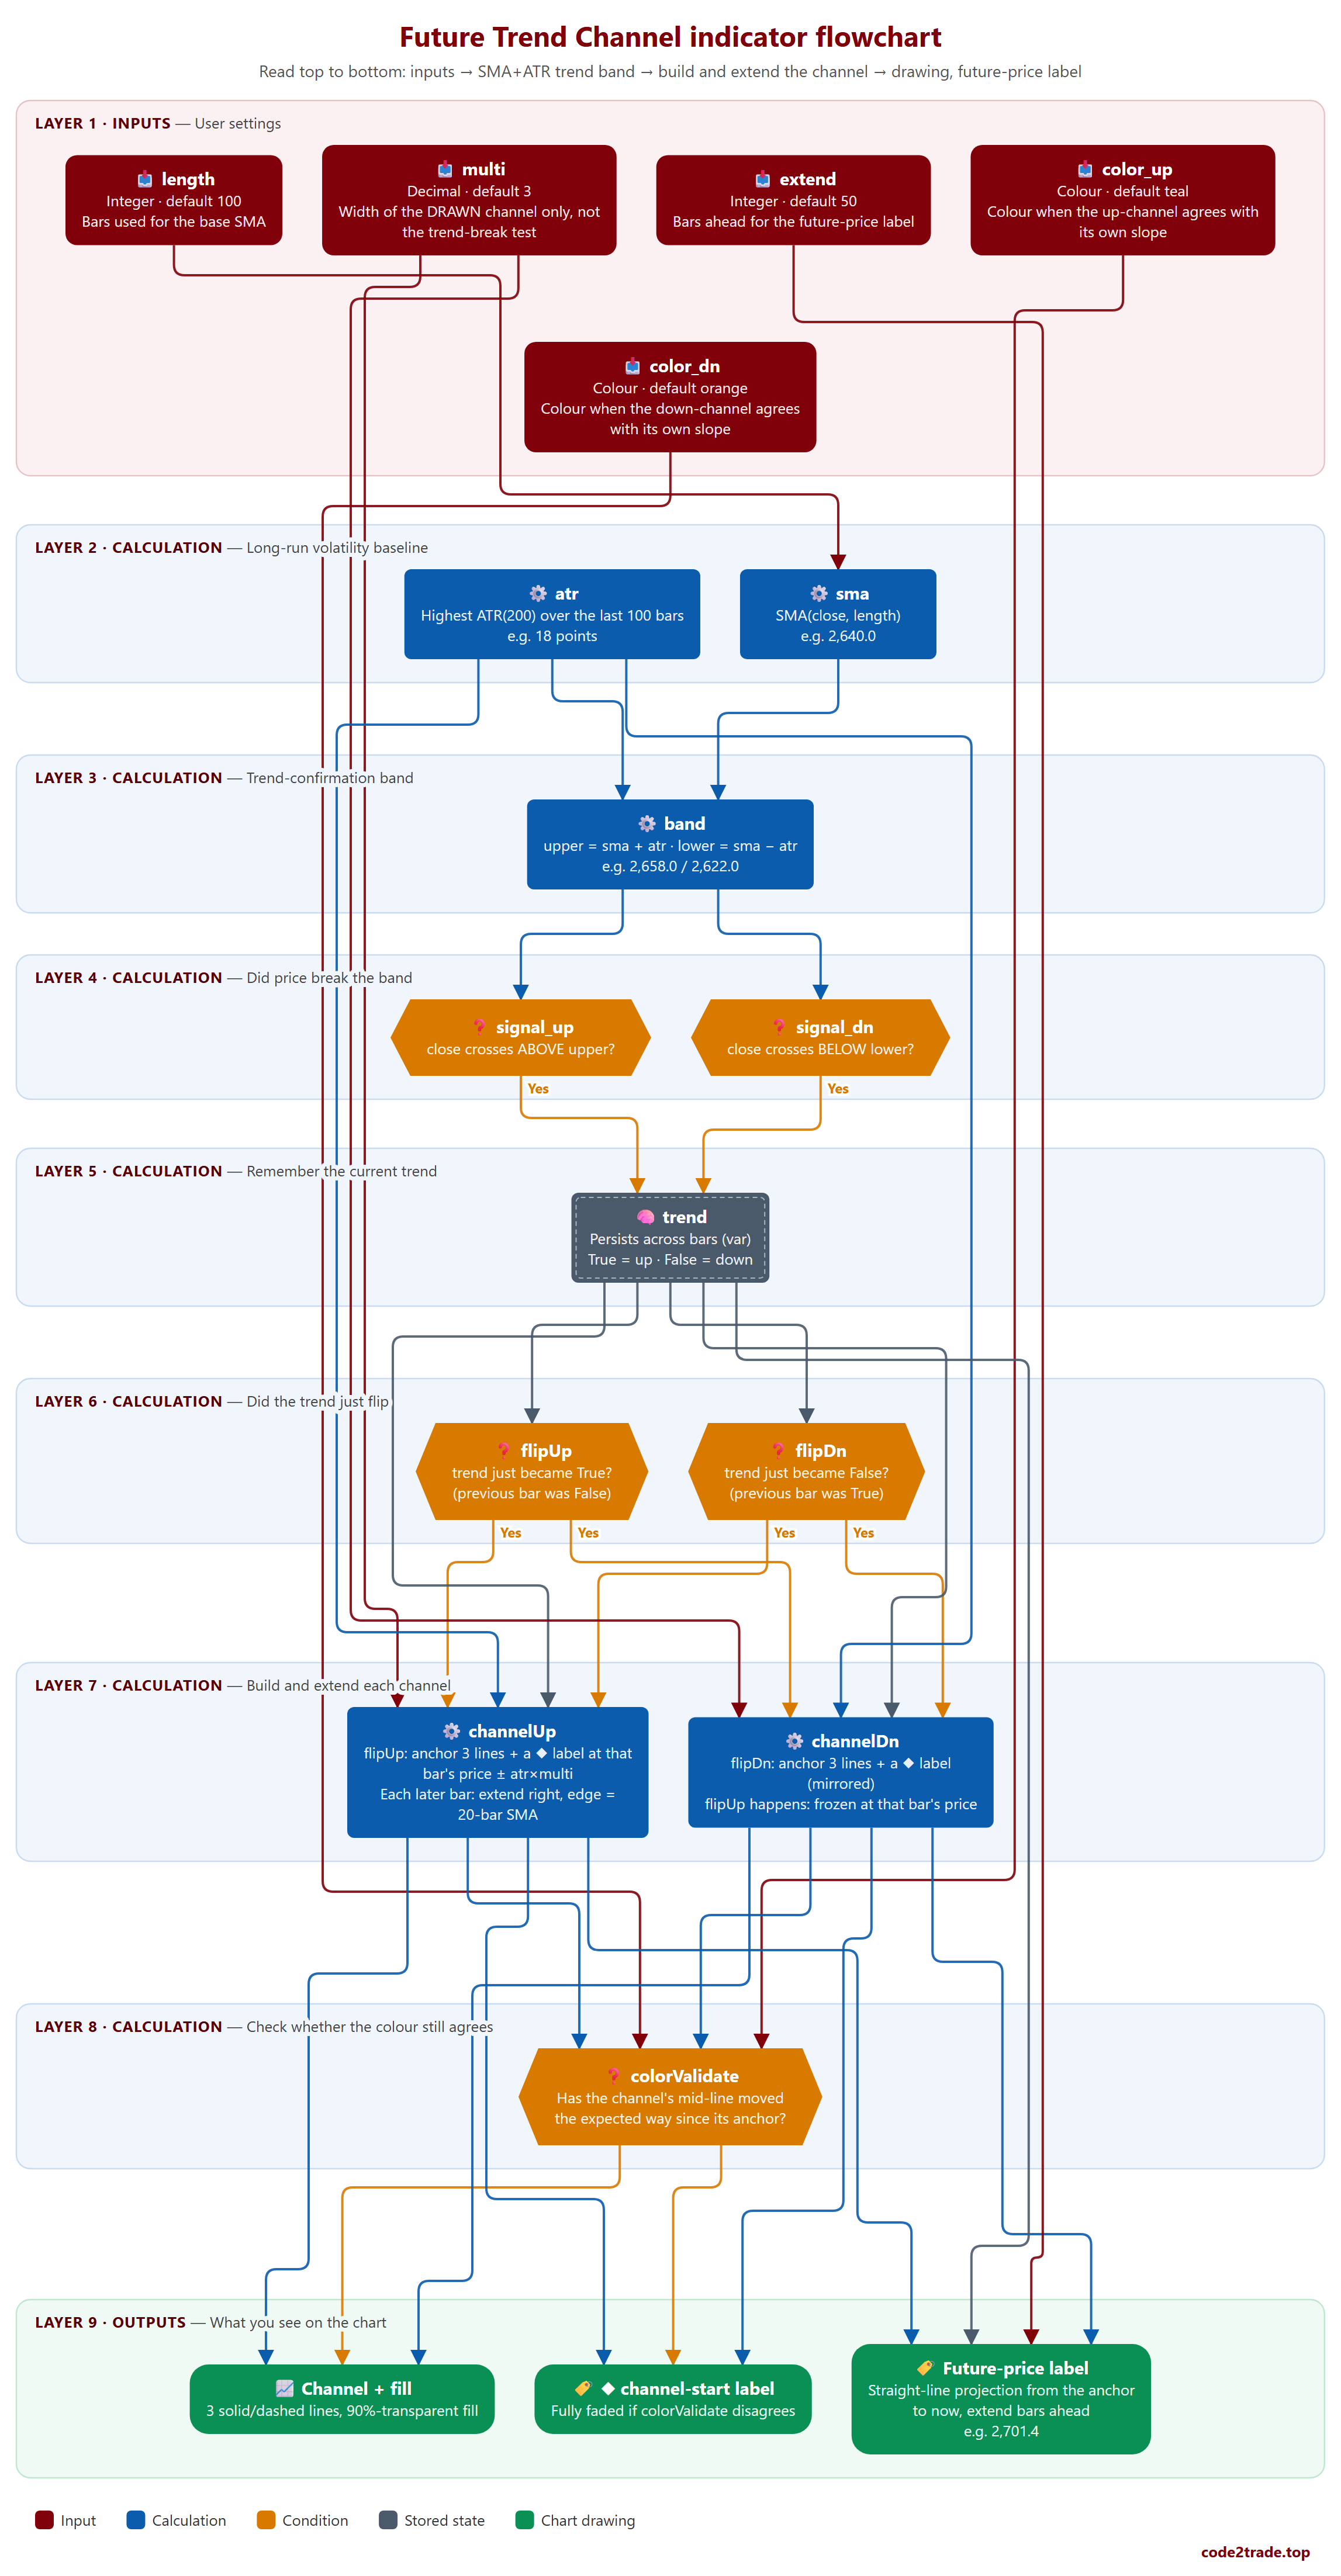
Future Trend Channel indicator flowchart, layer by layer

How to read the flowchart, layer by layer
Read the flowchart from top to bottom: each layer only uses results from the layer above it; the last layer is what you see on the chart.
- Layer 1 — Inputs: User settings.
- length — Integer · default 100; Bars used for the base SMA → leads to: sma
- multi — Decimal · default 3; Width of the DRAWN channel only, not the trend-break test → leads to: channelUp, channelDn
- extend — Integer · default 50; Bars ahead for the future-price label → leads to: Future-price label
- color_up — Colour · default teal; Colour when the up-channel agrees with its own slope → leads to: colorValidate
- color_dn — Colour · default orange; Colour when the down-channel agrees with its own slope → leads to: colorValidate
- Layer 2 — Calculation: Long-run volatility baseline.
- atr — Both the 200 and the 100 are fixed in the code; no input controls them. → leads to: band, channelUp, channelDn
- sma — SMA(close, length); e.g. 2,640.0 → leads to: band
- Layer 3 — Calculation: Trend-confirmation band.
- band — This band does NOT use multi — multi only sets the width of the channel drawn after a break. → leads to: signal_up, signal_dn
- Layer 4 — Calculation: Did price break the band.
- signal_up — e.g. close 2,660 just crossed above upper 2,658. → leads to: trend (Yes)
- signal_dn — e.g. close 2,615 just fell below lower 2,622. → leads to: trend (Yes)
- Layer 5 — Calculation: Remember the current trend.
- trend — Only changes when signal_up or signal_dn fires; every other bar keeps its old value. → leads to: flipUp, flipDn, channelUp, channelDn, Future-price label
- Layer 6 — Calculation: Did the trend just flip.
- flipUp — trend just became True?; (previous bar was False) → leads to: channelUp (Yes), channelDn (Yes)
- flipDn — trend just became False?; (previous bar was True) → leads to: channelDn (Yes), channelUp (Yes)
- Layer 7 — Calculation: Build and extend each channel.
- channelUp — When flipDn happens, channelUp is frozen at that exact bar's price and stops extending. → leads to: colorValidate, ◆ channel-start label, Future-price label, Channel + fill
- channelDn — flipDn: anchor 3 lines + a ◆ label (mirrored); flipUp happens: frozen at that bar's price → leads to: colorValidate, ◆ channel-start label, Future-price label, Channel + fill
- Layer 8 — Calculation: Check whether the colour still agrees.
- colorValidate — Agrees → its own colour (color_up/color_dn), solid line. Disagrees → neutral colour, dashed line, ◆ label fully faded. → leads to: Channel + fill, ◆ channel-start label
- Layer 9 — Outputs: What you see on the chart.
- Channel + fill — 3 solid/dashed lines, 90%-transparent fill
- ◆ channel-start label — Fully faded if colorValidate disagrees
- Future-price label — Straight-line projection from the anchor to now, extend bars ahead; e.g. 2,701.4
This flowchart and analysis were built with AI following the Zero2Hero course: create indicators and trading bots using AI, no coding required.
Future Trend Channel indicator FAQ
Does the Future Trend Channel indicator work for forex, gold or crypto?
Technically it only needs close/high/low price and ATR, so it runs on any TradingView market with candle data (forex, gold XAUUSD, crypto, stocks…). That said, this page is a source-code analysis only — no backtest has been run yet on any specific symbol or timeframe, so no market can honestly be called "best" for it so far.
Is the Future Trend Channel indicator profitable?
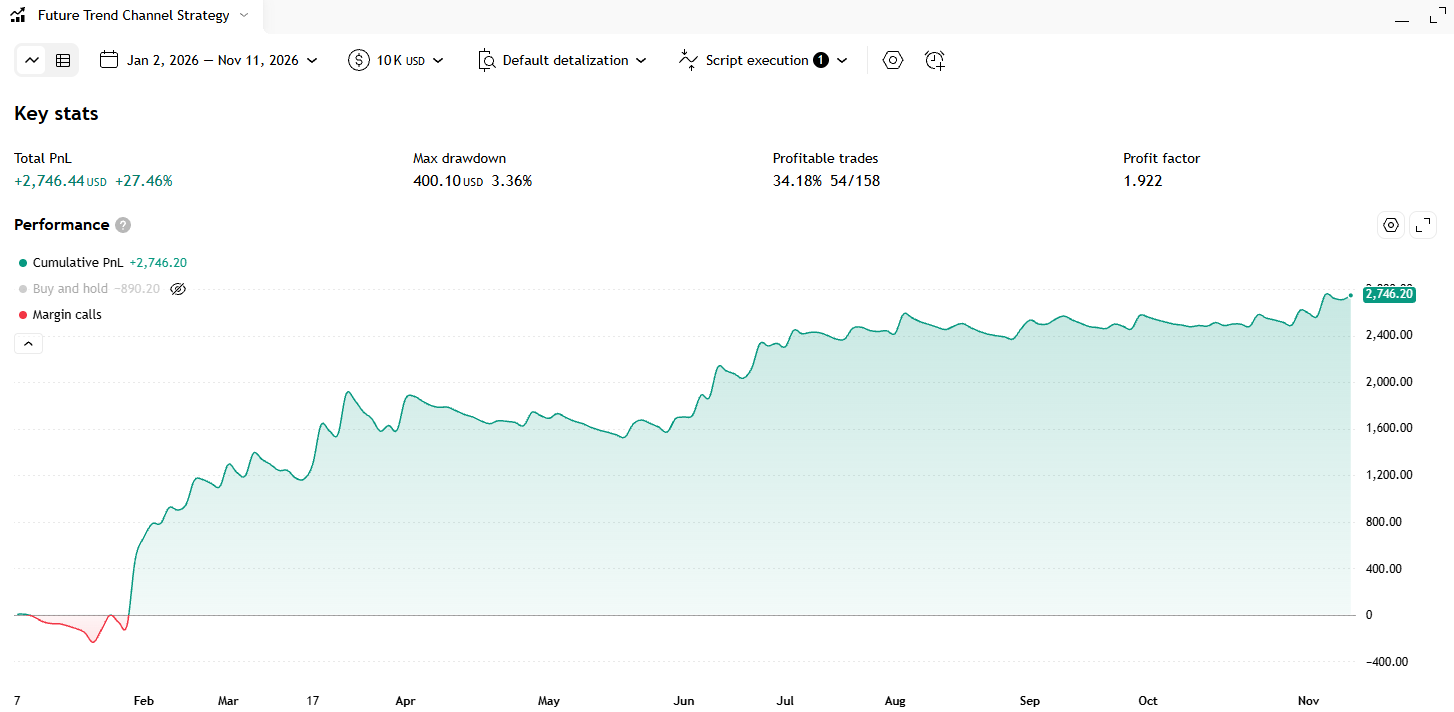
Not tested yet. Everything above comes from reading ChartPrime's original source code, not from running it against historical data.
Is the future-price label a reliable forecast?
No. It is a straight-line extrapolation of the channel's average slope since the trend was confirmed — if the pace of the move speeds up or slows down relative to that average, the projected price can drift quite far from what actually happens.
Is there an automated MT5 or OKX version?
Not yet — no Strategy/MT5 conversion exists for this indicator in this post. Once one is published, you can get AI to connect to MetaTrader 5 (in Vietnamese) or connect to the OKX exchange (in Vietnamese) to run signals from this channel.
Can I get this indicator customised?
Yes — Code2Trade offers a custom TradingView indicator and trading bot coding service (Pine Script, MT5); send your request through the Code2Trade contact form.
For educational purposes only, not investment advice. Trading involves risk of loss.