High Volume Points TradingView indicator
Circles pivots whose volume stood out, with a clear live-vs-used level line · the Strategy version converted from this indicator has been backtested on gold XAUUSD M15, net profit +29.20%.
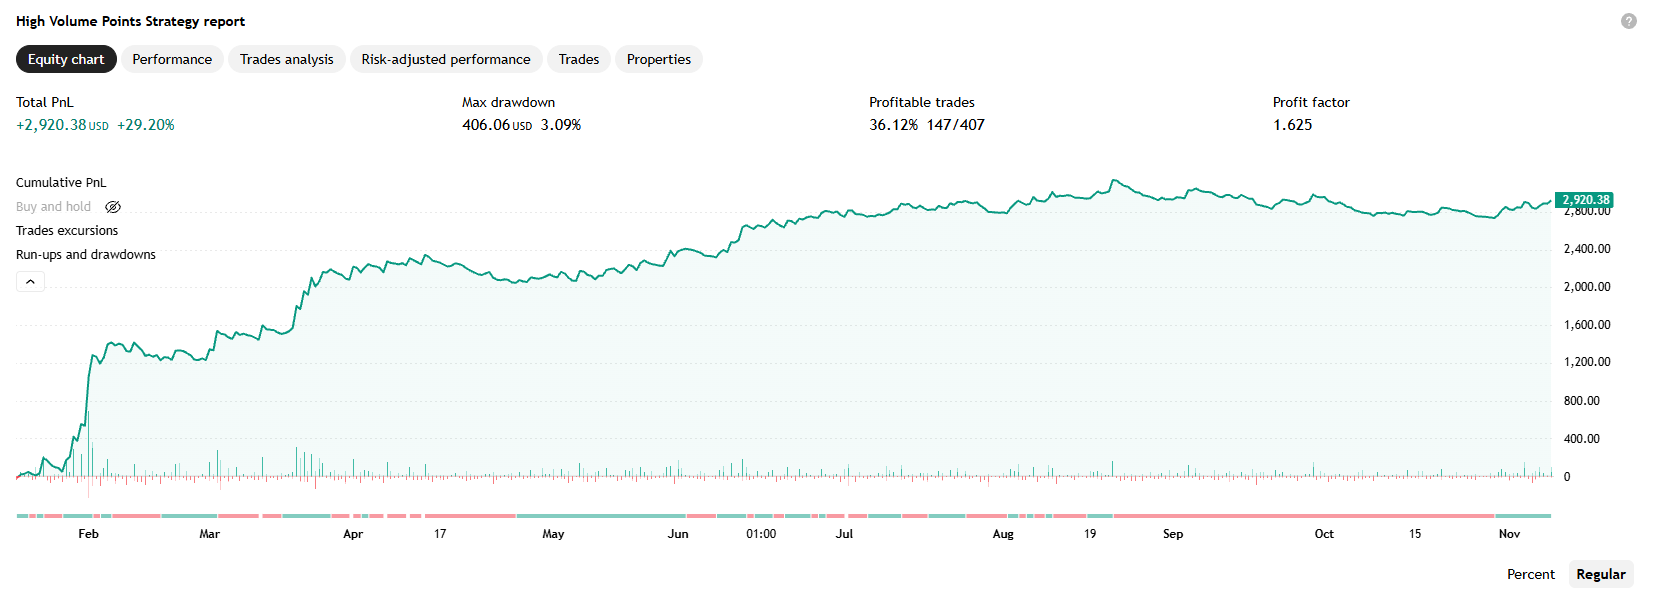
Quick summary: The High Volume Points indicator automatically circles pivot highs/lows whose trading volume stands out against the last 1000 bars, with a horizontal level line that shows whether that zone is still "live" (solid) or already used up (dotted) · the Strategy version converted from this indicator has been backtested on Gold Spot/U.S. Dollar (OANDA), M15: net profit +2,920.38 USD (+29.20%), profit factor 1.625, 36.12% win rate (147/407 trades).

What is the High Volume Points indicator? The idea behind it
The High Volume Points indicator (indicator) is built on an observation familiar to traders who follow order flow: when a swing high or low coincides with a sharp spike in traded volume compared with what's normal, that usually points to organised activity — stops being swept, large orders being filled, or a wave of profit-taking or fresh entries hitting at once. Price tends to "remember" such zones and react when it comes back, so flagging them automatically helps a chart reader not miss them.
Rather than comparing volume to a fixed number, the indicator normalises each pivot's volume against the 95th percentile of the last 1,000 bars — meaning "high" here is always relative to the instrument and timeframe you're actually looking at, not a flat threshold meant to apply everywhere.
Comparing several ways to read order flow and volume? Browse related tools in the Code2Trade free TradingView indicator library.
What High Volume Points shows on the chart
Chart drawings
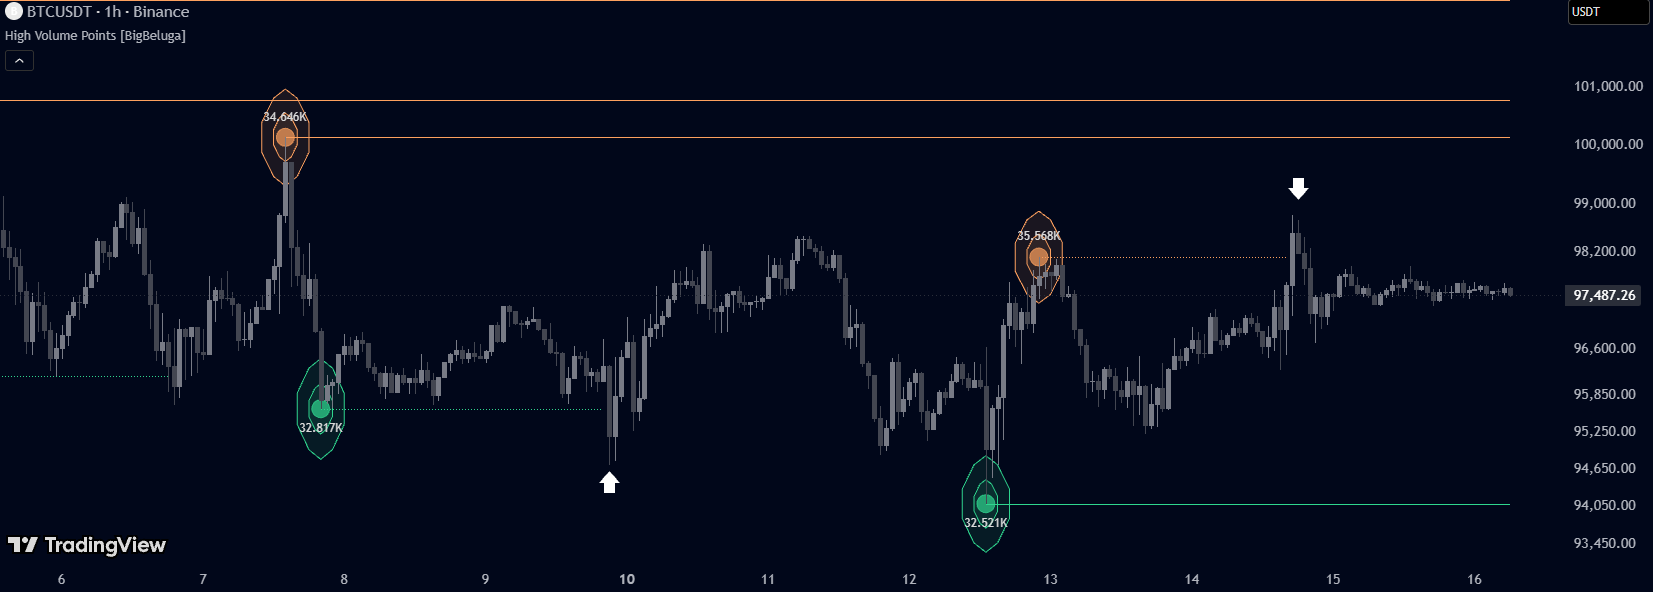
- Concentric rings: the more rings and the larger they are, the more that pivot's volume stood out — orange (default) for highs, green (default) for lows.
- Horizontal level line: starts exactly at the pivot price, slightly thicker for points with more rings. Solid and still extending right means price hasn't come back to that level yet; it switches to dotted and stops the moment a candle closes through it — the line itself tells you whether that zone is still "live" or already "used".
- Small circle marker + volume label: a small coloured dot (no text) sits right on the pivot, next to a text label giving that point's real volume number (e.g. 34.6K).
Alerts
- This indicator has no built-in alerts in the original code. To get notified when a new high-volume point appears, you'd need to build a manual alert or have the code extended.
How to trade with High Volume Points
Long setup
Wait for price to pull back into a green level line (a low) that's still solid — meaning that high-volume zone hasn't been used since it formed. More concentric rings mean a more extreme volume reading at that point, usually treated as a more notable zone. A reasonable stop sits below the original pivot low.
Short setup
The mirror image: wait for price to rally into an orange level line (a high) that's still solid. A reasonable stop sits above the original pivot high.
When NOT to use it
In a market where volume is fairly even and rarely clears the 95th percentile of the last 1,000 bars, the indicator can go quiet for long stretches — that doesn't mean there are no important zones, just that none has cleared the threshold yet. It also only draws for pivots within the chart's last 300 bars; an otherwise-qualifying high-volume pivot older than that is never drawn. If you set "Left Bars" and "Right Bars" to different values, note the volume sum uses 2×Left Bars, not Left+Right Bars, so mismatched inputs mean the volume window no longer lines up exactly with the pivot-confirmation window.
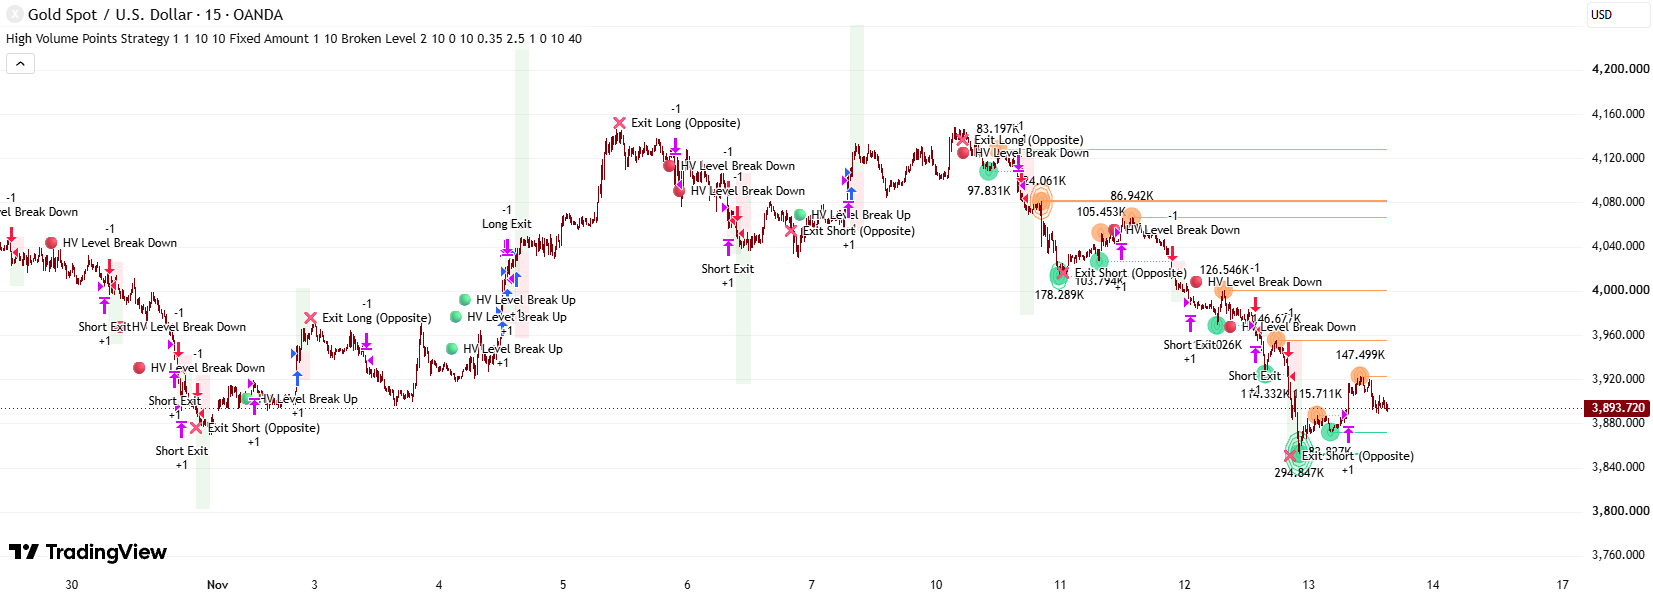
Below is a screenshot of the Strategy version converted from the High Volume Points indicator, showing how these high-volume levels can drive automated entries and exits — not a feature of the base indicator itself, which only displays and never places orders.

How High Volume Points works
Inputs and what each one does
- step ("Diameter Of Circles"): decimal, default 1. Spacing between the concentric rings — larger makes the whole ring cluster bigger and more visible, without changing the ring count. (Layer 1, 6 in the flowchart)
- filter_vol ("Filter Points by Volume"): decimal 0-6, default 2. The minimum normalised volume score a pivot needs to be drawn at all; the actual normalised score can exceed 6 even though the input field only accepts up to 6. (Layer 1, 5 in the flowchart)
- leftBars / rightBars ("Left Bars" / "Right Bars"): integers, default 15 each. Bars on each side required to confirm a real pivot high/low; rightBars is also the confirmation lag — a pivot is only known that many bars after it happened. (Layer 1, 2 in the flowchart)
- show_lvl ("Show Levels"): tick box, default on. Shows/hides the horizontal level lines — note that turning it off deletes every level line currently on the chart, not just hides them. (Layer 1, 7 in the flowchart)
- upper_col / lower_col: two colour pickers, default orange and green. Colour the rings, level line and marker dot only. (Layer 1, 7, 8 in the flowchart)
Main calculation blocks
- Finding pivots and summing volume: ph/pl are standard pivot highs/lows, lagging rightBars bars. volume_ sums volume over leftBars×2 bars around that point. (Layer 2 in the flowchart)
- Reference benchmark: reference_vol = the 95th-percentile reading of volume_ over the last 1,000 bars — a "high but not the absolute maximum" benchmark, so one single outlier candle can't distort it. (Layer 3 in the flowchart)
- Normalising: norm_vol = volume_ ÷ reference_vol × 5. E.g. volume_ 48,000, reference_vol 42,000 → norm_vol ≈ 5.7 — about 14% above the 95th-percentile benchmark. (Layer 4 in the flowchart)
- Qualifying check: a pivot is only processed further once it actually exists (ph/pl valid), its norm_vol exceeds filter_vol, it sits within the chart's last 300 bars, and the bar is confirmed (closed). (Layer 5 in the flowchart)
- Counting the rings: loops i from 0 to 10, drawing one more ring each time norm_vol still exceeds i. E.g. norm_vol ≈ 5.7 → 6 rings (for i = 0, 1, 2, 3, 4, 5). The ring count (width1/width2) also sets how thick the level line will be. (Layer 6 in the flowchart)
- Tracking the level line: each qualifying point creates a new level line, added to one shared tracking list. From the next bar on, every tracked line (not just the newest one) gets re-checked: if price has crossed it, it turns dotted and drops out of tracking; otherwise it extends further right. (Layer 7 in the flowchart)
Outputs: drawings, orders, alerts
- Concentric rings, the horizontal level line, the marker dot and the volume label are the four things you actually see on the chart — the base indicator places no orders and raises no alerts of its own. (Last layer in the flowchart)
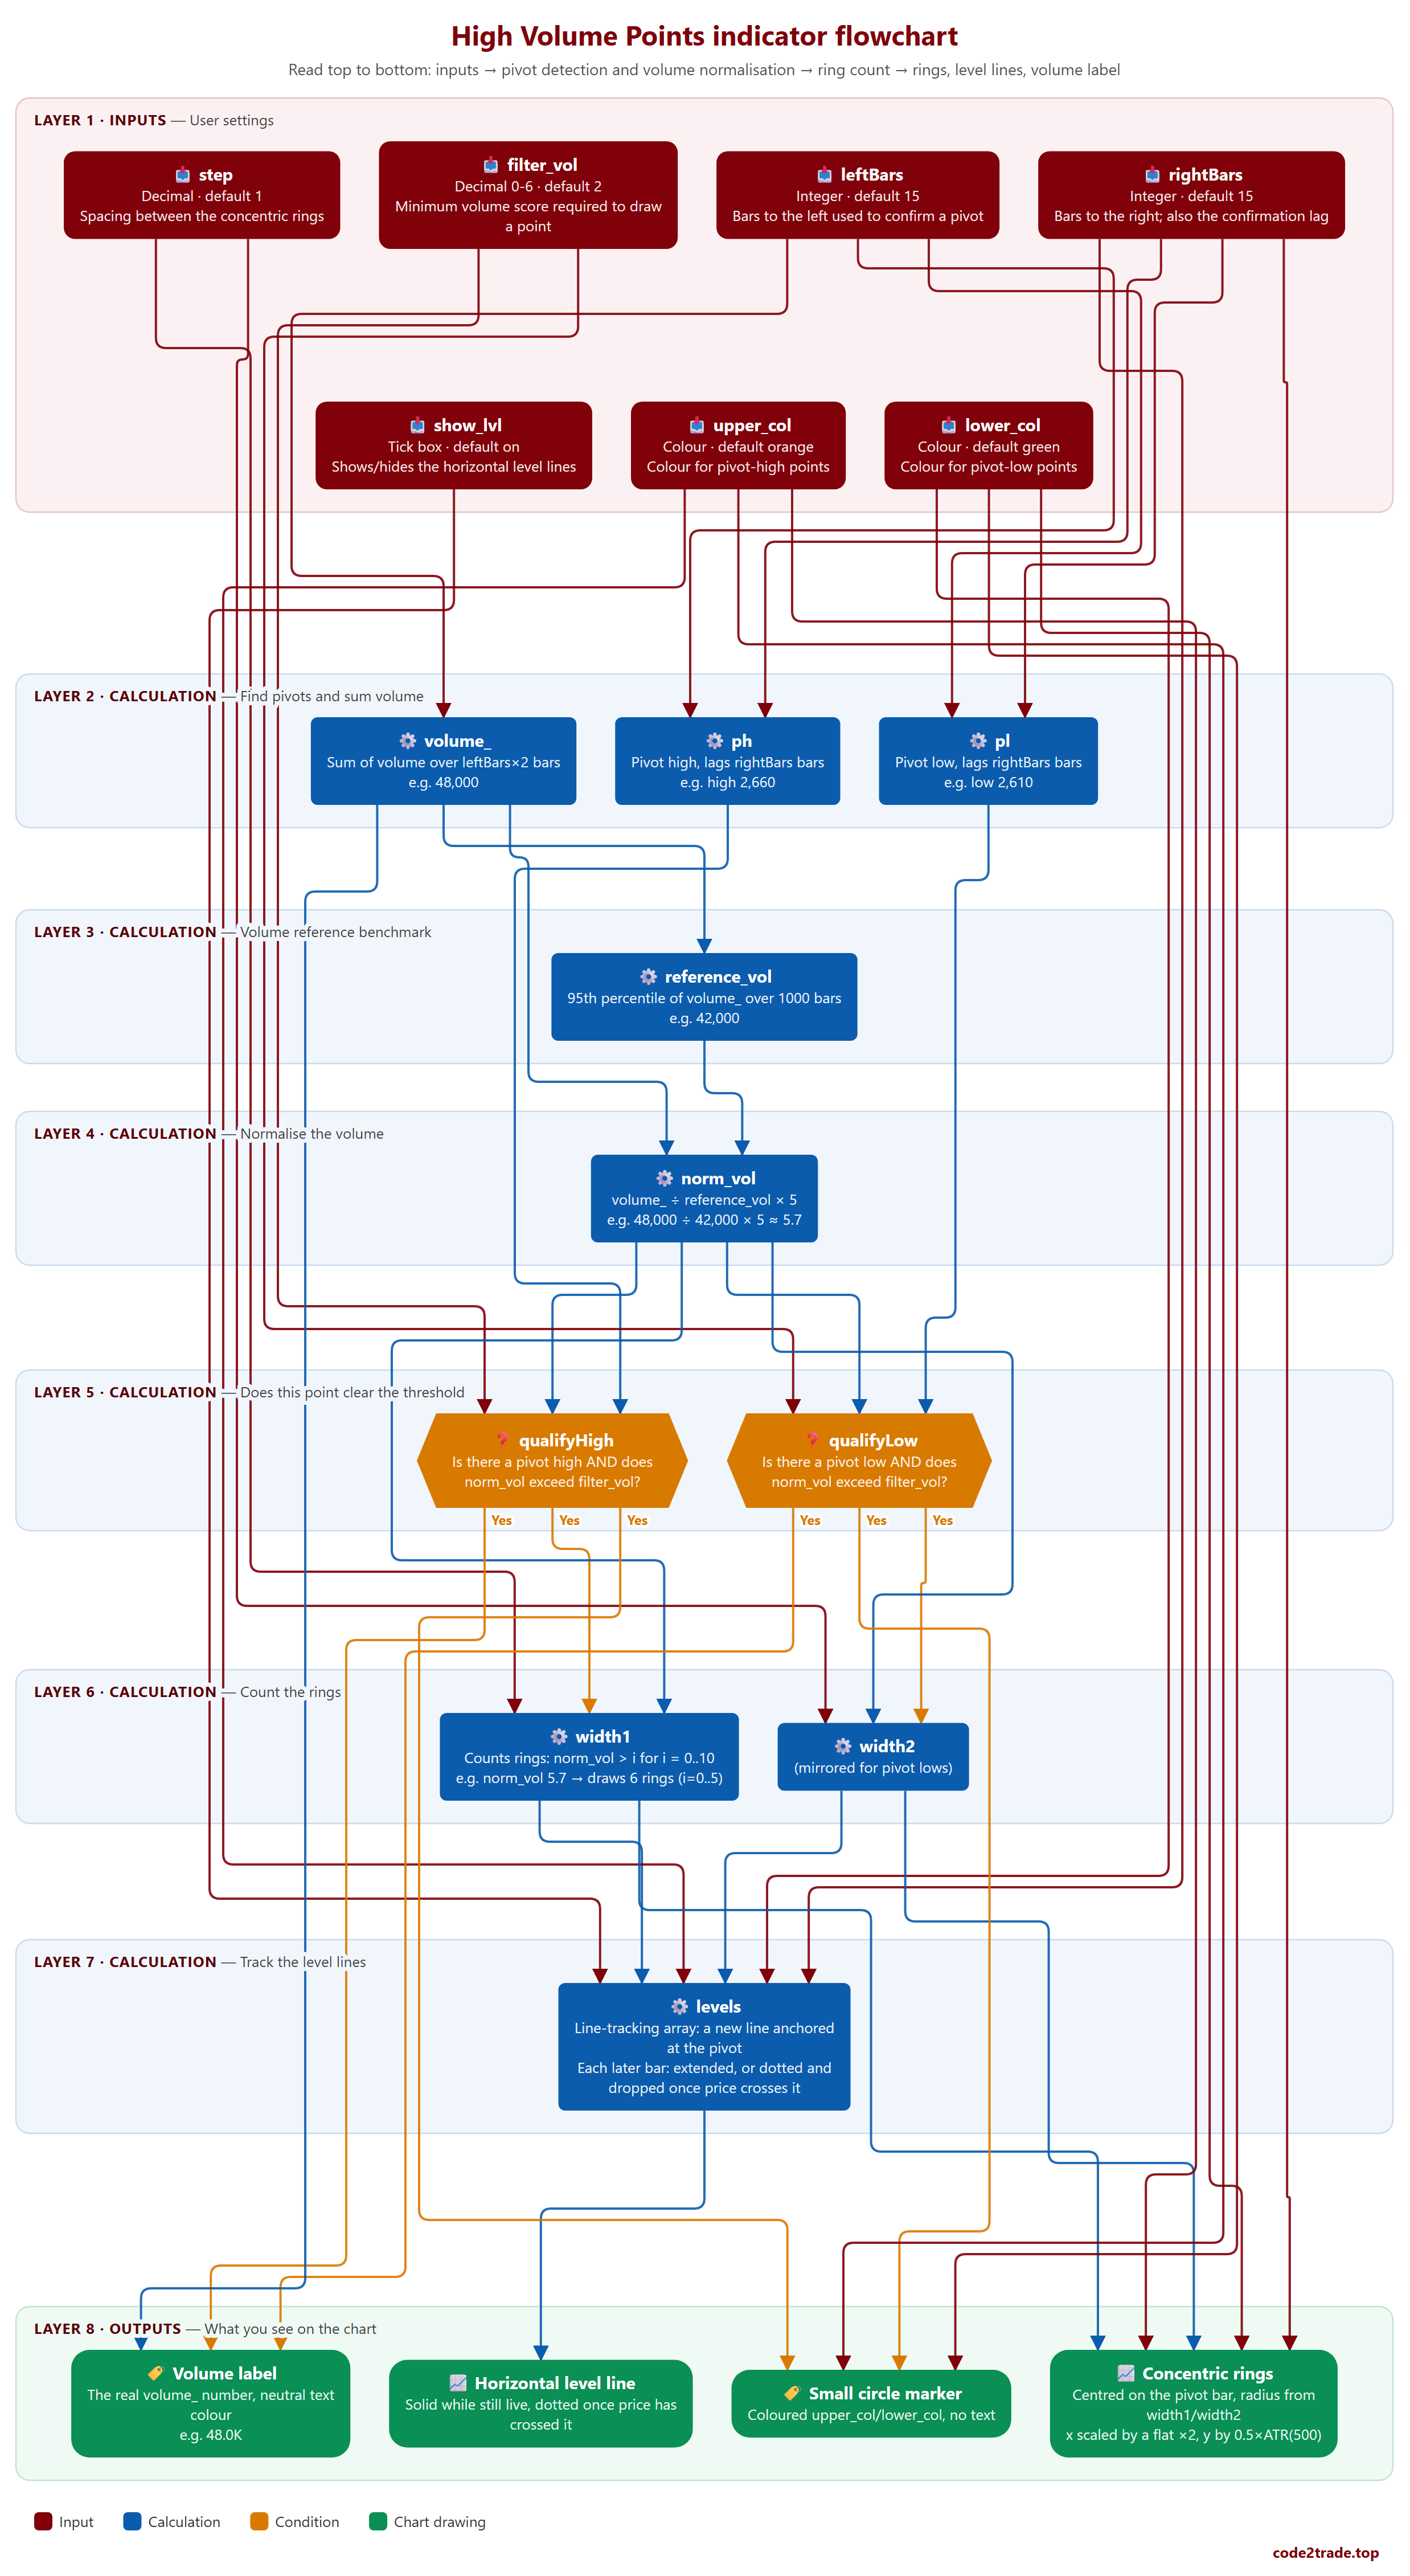
High Volume Points flowchart, layer by layer

How to read the flowchart, layer by layer
Read the flowchart from top to bottom: each layer only uses results from the layer above it; the last layer is what you see on the chart.
- Layer 1 — Inputs: User settings.
- step — Decimal · default 1; Spacing between the concentric rings → leads to: width1, width2
- filter_vol — Decimal 0-6 · default 2; Minimum volume score required to draw a point → leads to: qualifyHigh, qualifyLow
- leftBars — Integer · default 15; Bars to the left used to confirm a pivot → leads to: ph, pl, volume_
- rightBars — Integer · default 15; Bars to the right; also the confirmation lag → leads to: ph, pl, levels, rings
- show_lvl — Tick box · default on; Shows/hides the horizontal level lines → leads to: levels
- upper_col — Colour · default orange; Colour for pivot-high points → leads to: levels, rings, dotMarker
- lower_col — Colour · default green; Colour for pivot-low points → leads to: levels, rings, dotMarker
- Layer 2 — Calculation: Find pivots and sum volume.
- ph — Pivot high, lags rightBars bars; e.g. high 2,660 → leads to: qualifyHigh
- pl — Pivot low, lags rightBars bars; e.g. low 2,610 → leads to: qualifyLow
- volume_ — Sum of volume over leftBars×2 bars; e.g. 48,000 → leads to: reference_vol, norm_vol, volumeLabel
- Layer 3 — Calculation: Volume reference benchmark.
- reference_vol — 95th percentile of volume_ over 1000 bars; e.g. 42,000 → leads to: norm_vol
- Layer 4 — Calculation: Normalise the volume.
- norm_vol — volume_ ÷ reference_vol × 5; e.g. 48,000 ÷ 42,000 × 5 ≈ 5.7 → leads to: qualifyHigh, qualifyLow, width1, width2
- Layer 5 — Calculation: Does this point clear the threshold.
- qualifyHigh — Is there a pivot high AND does norm_vol exceed filter_vol? → leads to: width1 (Yes), dotMarker (Yes), volumeLabel (Yes)
- qualifyLow — Is there a pivot low AND does norm_vol exceed filter_vol? → leads to: width2 (Yes), dotMarker (Yes), volumeLabel (Yes)
- Layer 6 — Calculation: Count the rings.
- width1 — Counts rings: norm_vol > i for i = 0..10; e.g. norm_vol 5.7 → draws 6 rings (i=0..5) → leads to: levels, rings
- width2 — (mirrored for pivot lows) → leads to: levels, rings
- Layer 7 — Calculation: Track the level lines.
- levels — Line-tracking array: a new line anchored at the pivot; Each later bar: extended, or dotted and dropped once price crosses it → leads to: levelLine
- Layer 8 — Outputs: What you see on the chart.
- Concentric rings — Centred on the pivot bar, radius from width1/width2; x scaled by a flat ×2, y by 0.5×ATR(500)
- Horizontal level line — Solid while still live, dotted once price has crossed it
- Small circle marker — Coloured upper_col/lower_col, no text
- Volume label — The real volume_ number, neutral text colour; e.g. 48.0K
This flowchart and analysis were built with AI following the Zero2Hero course: create indicators and trading bots using AI, no coding required.
High Volume Points FAQ
Does High Volume Points work for forex, gold or crypto?
Yes — it only needs volume and candle data, so it runs on any TradingView market with volume (forex tick volume, gold XAUUSD, crypto, stocks…). The screenshots in this post come from BTCUSDT H1 (Binance) and XAUUSD M15 (OANDA).
Is the High Volume Points indicator profitable?
The base indicator only draws on the chart, with no win/loss numbers of its own. The Strategy version converted from this indicator has been backtested on Gold Spot/U.S. Dollar (OANDA), M15: net profit +2,920.38 USD (+29.20%), max drawdown 406.06 USD (3.09%), 147/407 trades won (36.12%), profit factor 1.625.

Is there an automated MT5 or OKX version?
This post doesn't include an official MT5 conversion yet. You can get AI to connect to MetaTrader 5 (in Vietnamese) or connect to the OKX exchange (in Vietnamese) to run signals from the indicator or this Strategy version.
Can I get this indicator customised?
Yes — Code2Trade offers a custom TradingView indicator and trading bot coding service (Pine Script, MT5); send your request through the Code2Trade contact form.
For educational purposes only, not investment advice. Trading involves risk of loss.