1. FVG Volume Profile Indicator Description [ChartPrime]
Smart trade volume analysis tool inside Fair Value Gap (price imbalance) zones
1.1 Indicator Concept
The FVG Volume Profile indicator is based on the theory of Fair Value Gaps (FVG)—also known as “price imbalance” zones. These are gaps on the price chart formed when the market moves too quickly, creating price areas with little to no trades executed.
Core principle: The market tends to return to “fill” these FVGs because they are considered unfairly priced zones. However, not all FVGs are equally valuable.
This indicator goes further by analyzing traded volume inside each FVG using a lower timeframe. This helps traders understand:
- Trade density: Where volume concentrates within the FVG
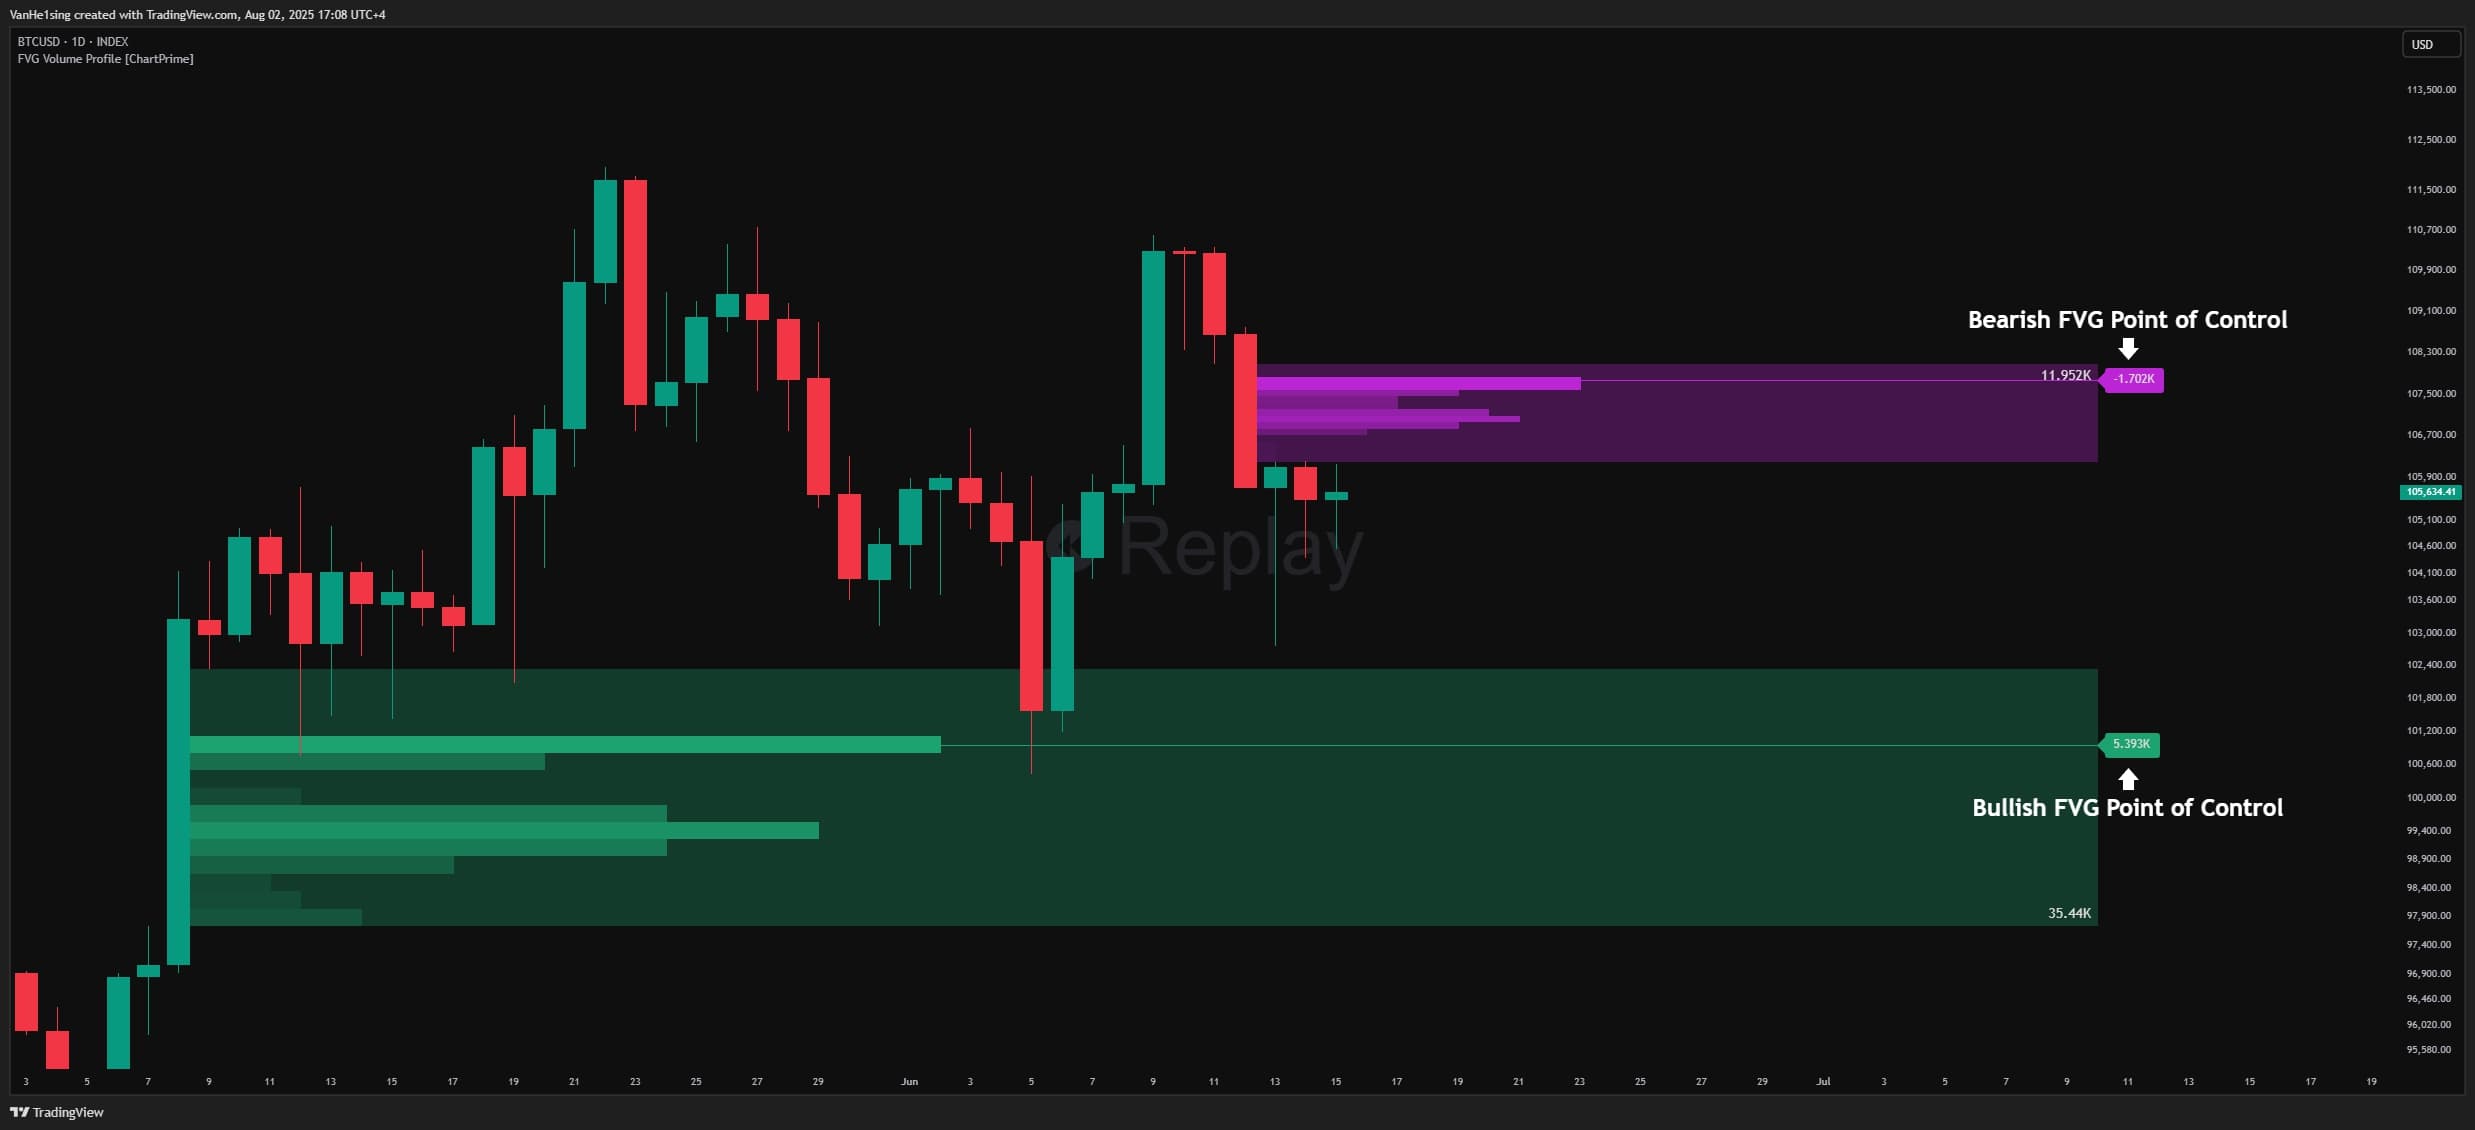
- Point of Control (POC): The price level with the highest traded volume, often a strong support/resistance area
- Strength of the FVG: FVGs with higher volume often trigger stronger price reactions
1.2 Indicator Features
Displayed on the chart:
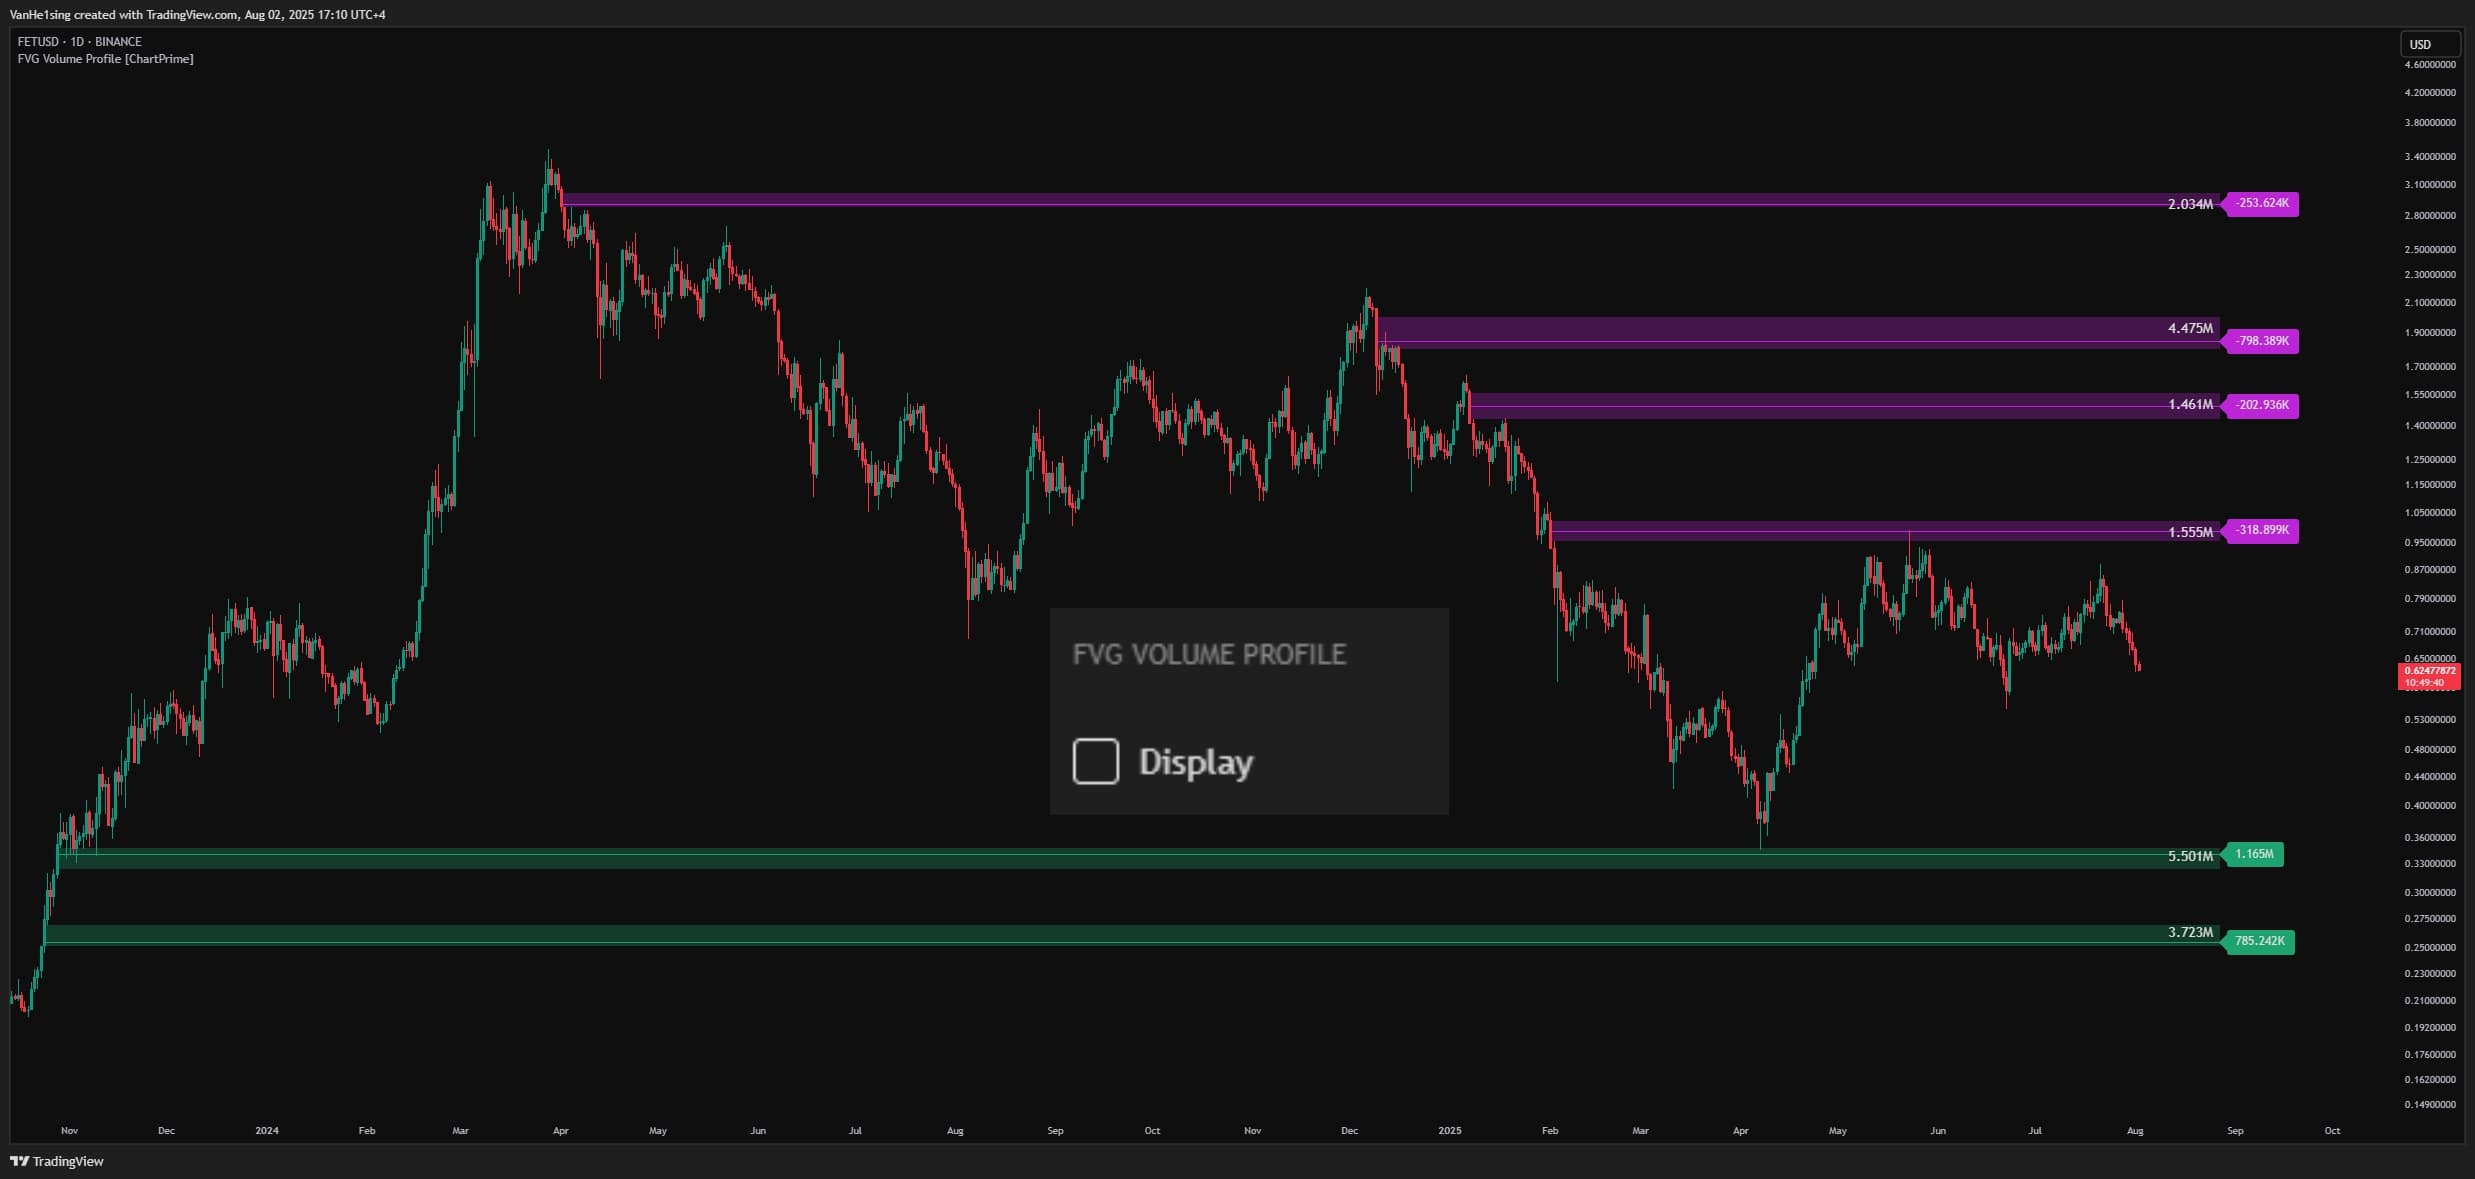
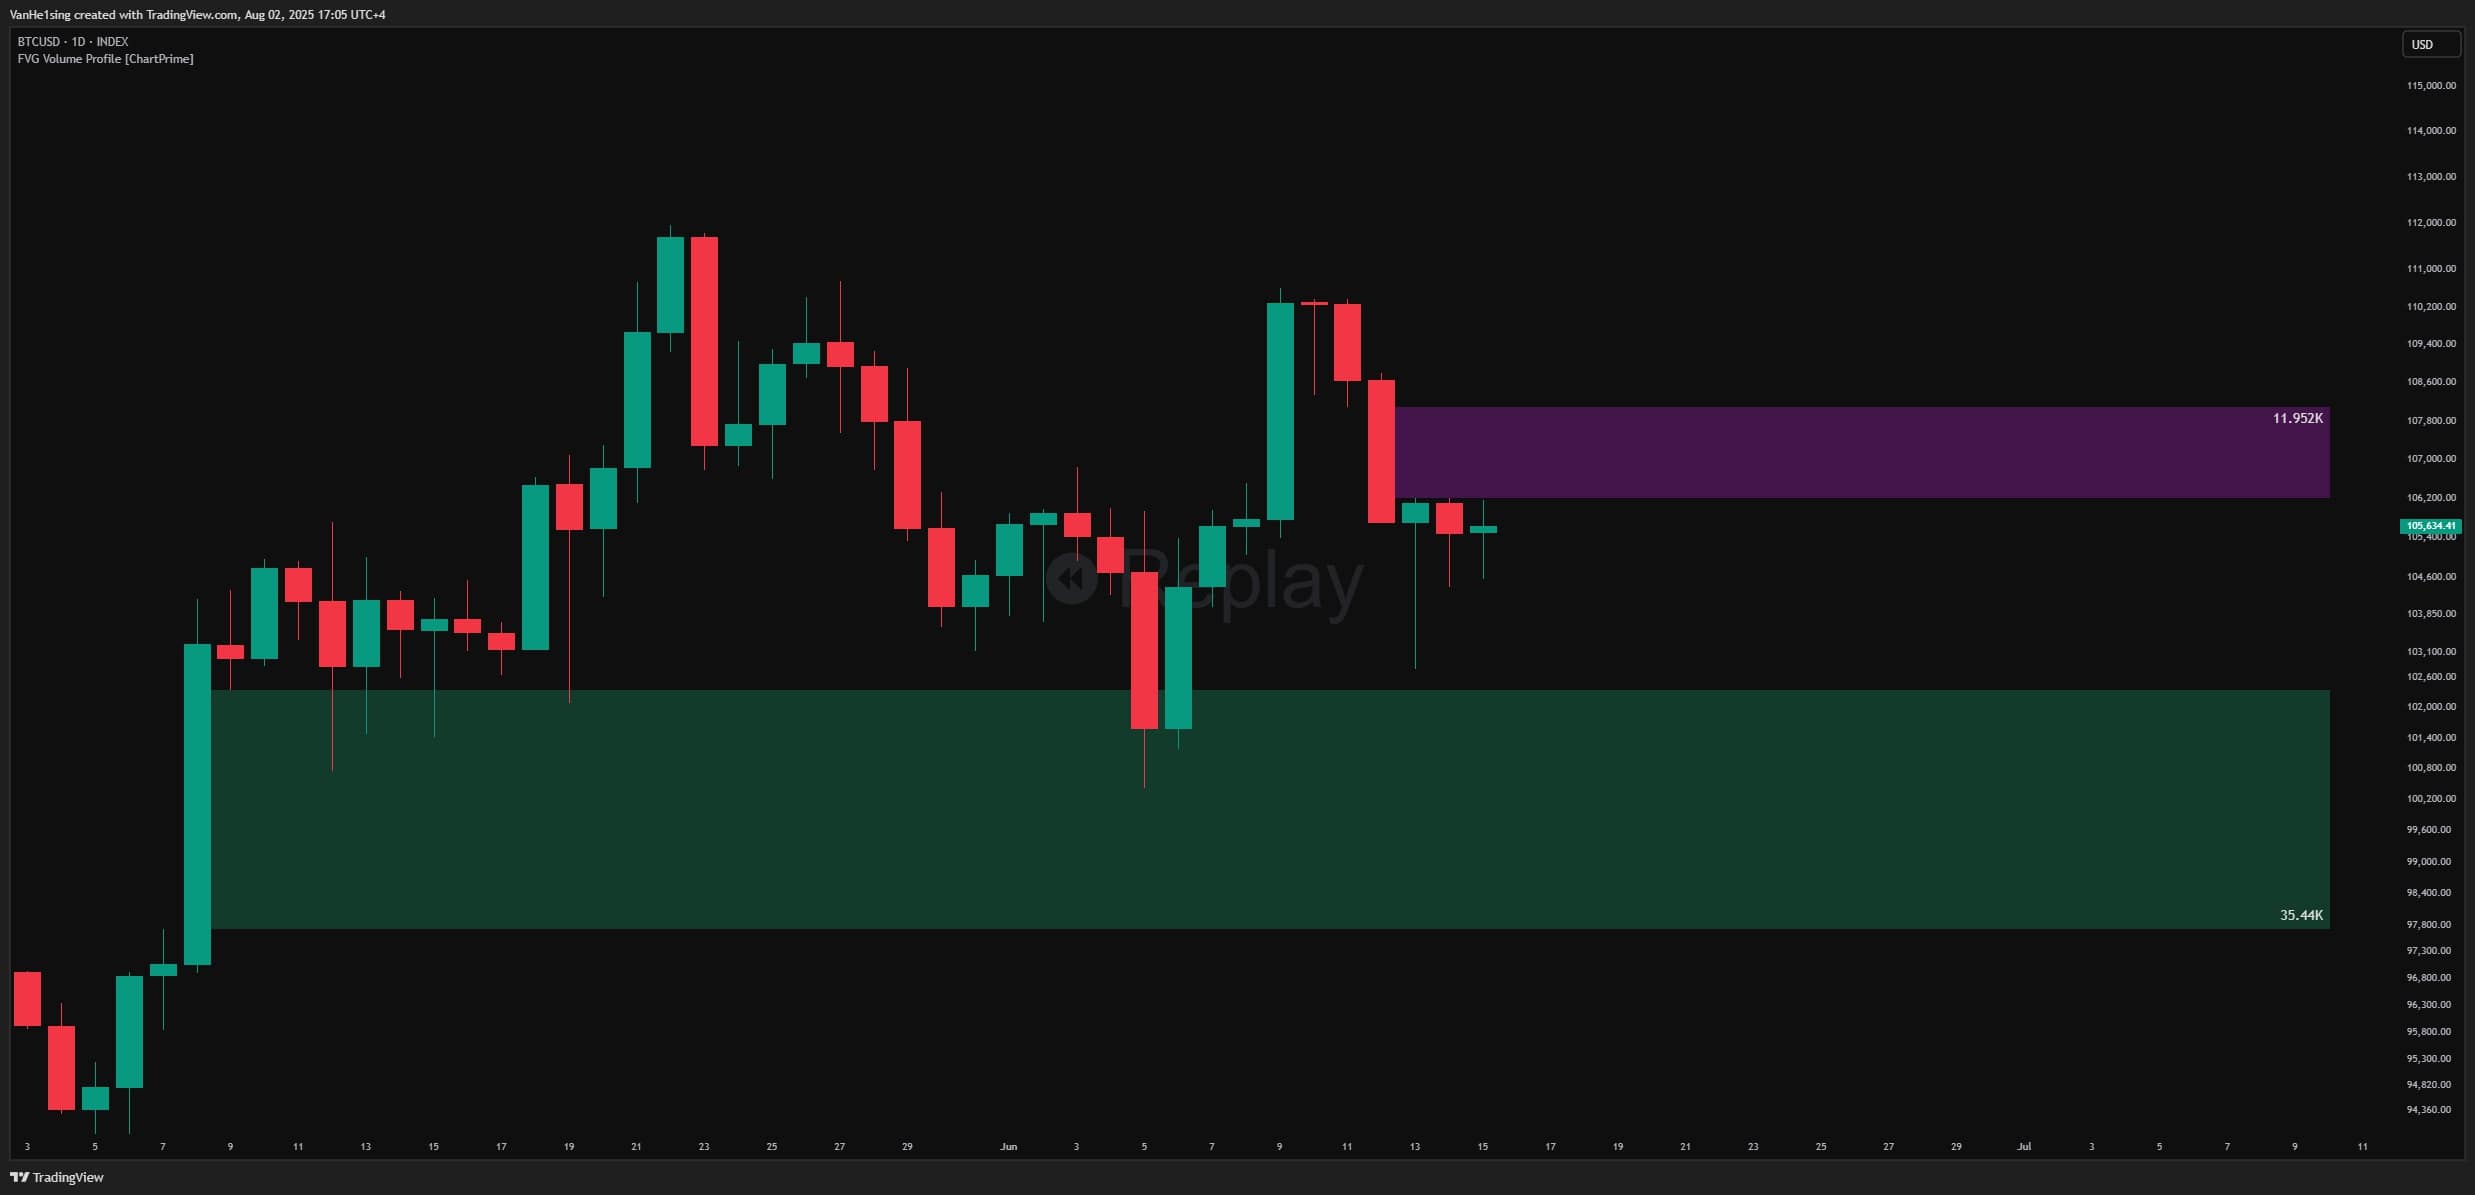
- FVG Box: A green rectangle (bullish FVG) or purple rectangle (bearish FVG) marking the imbalance zone. The box automatically extends to the right and shows the total traded volume inside.
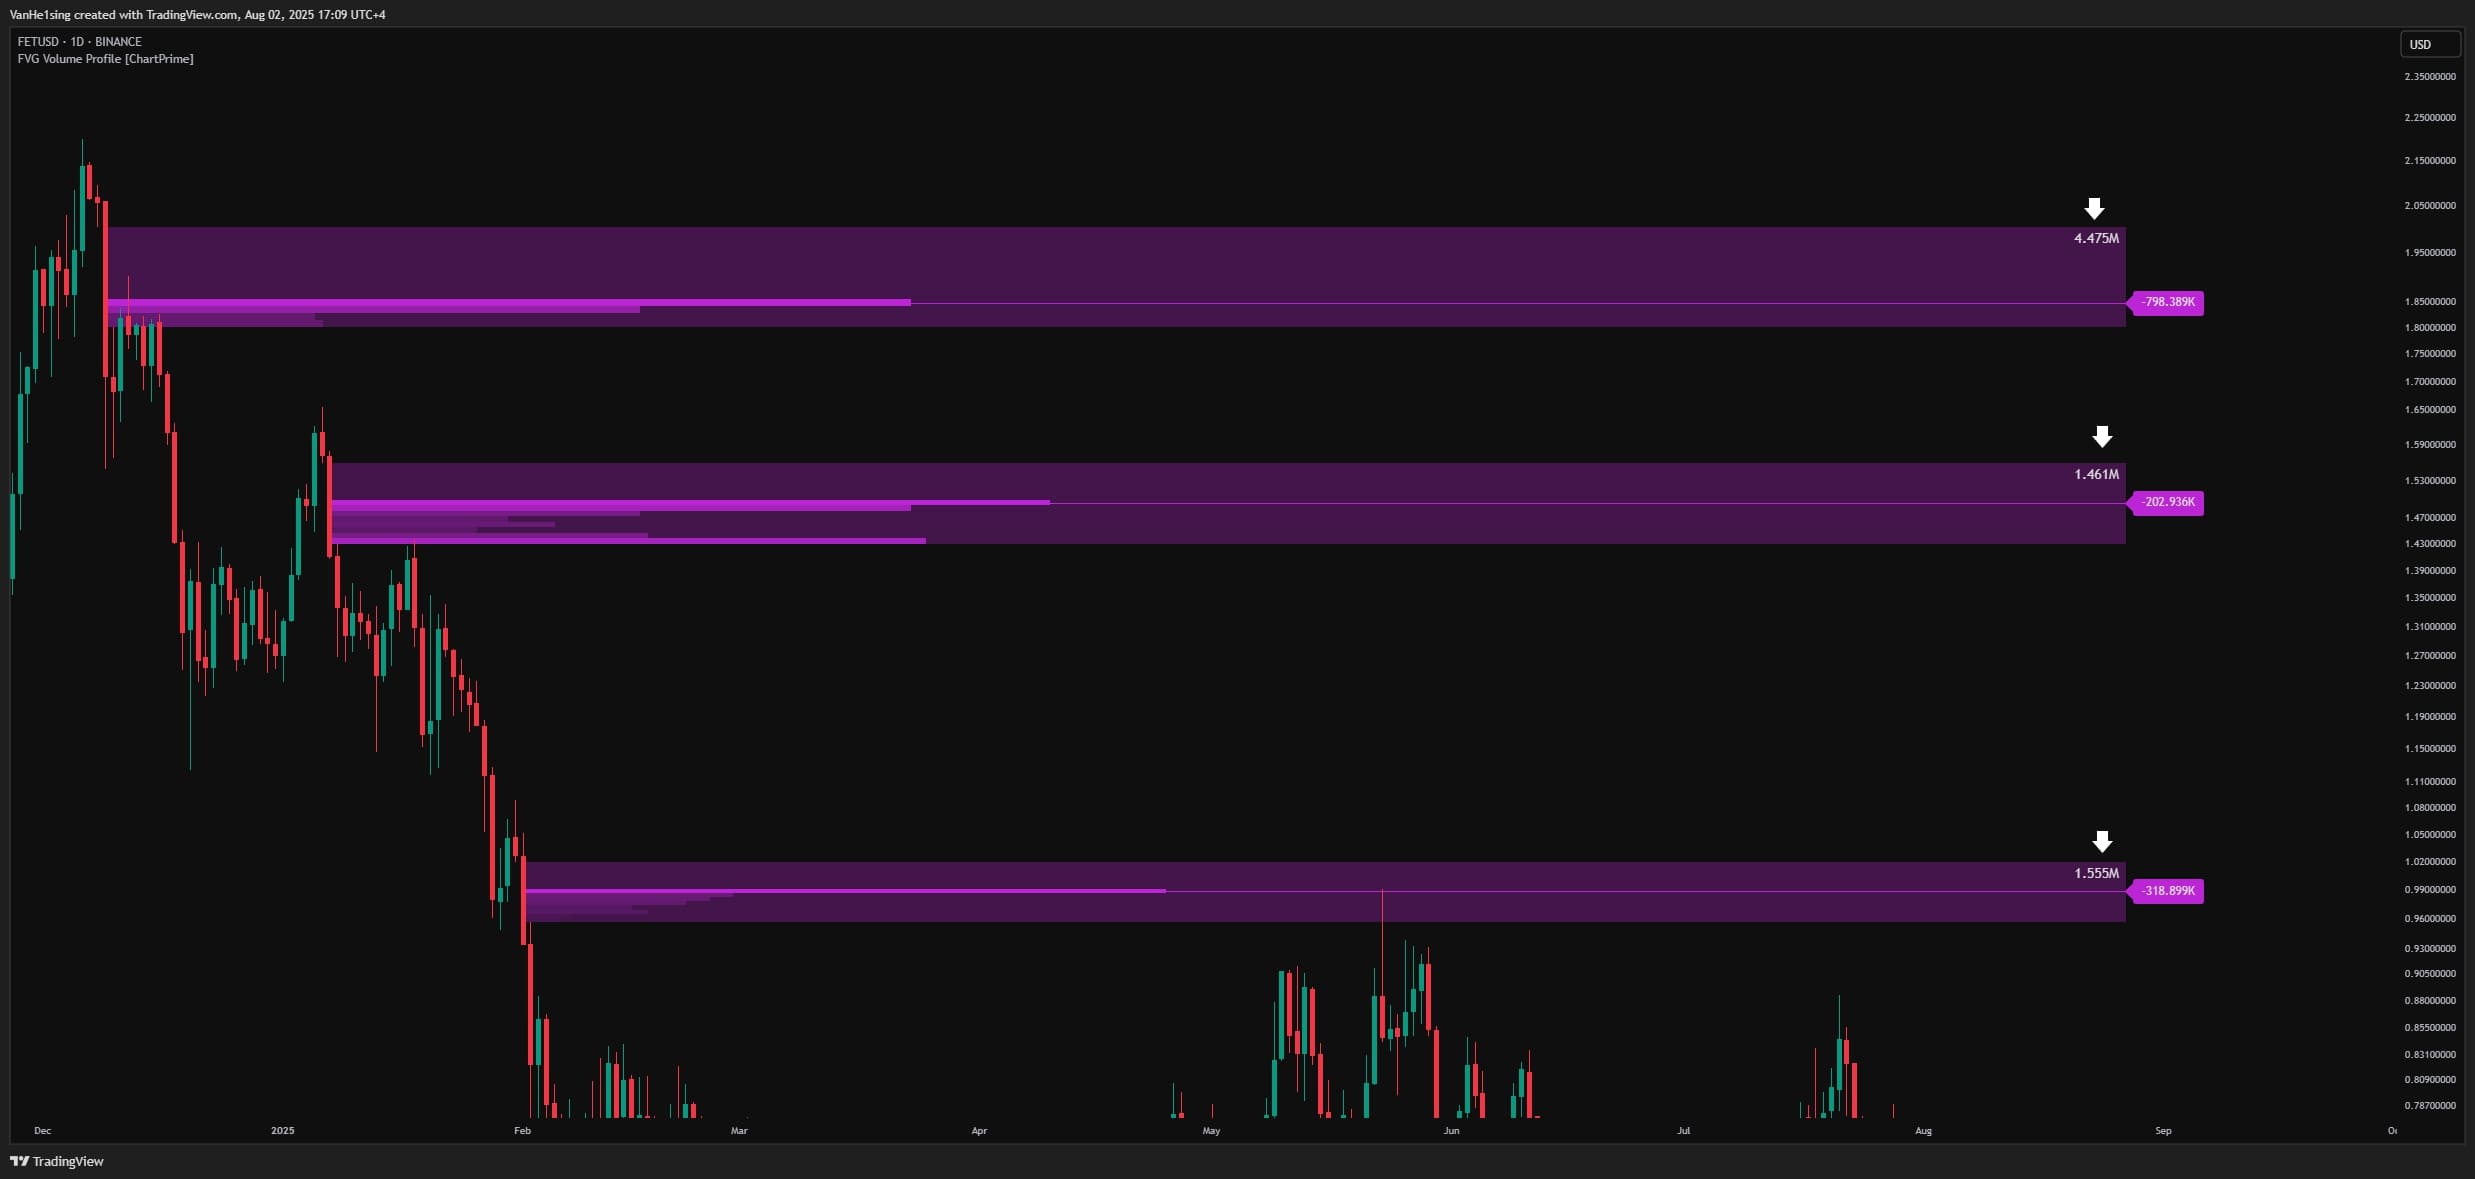
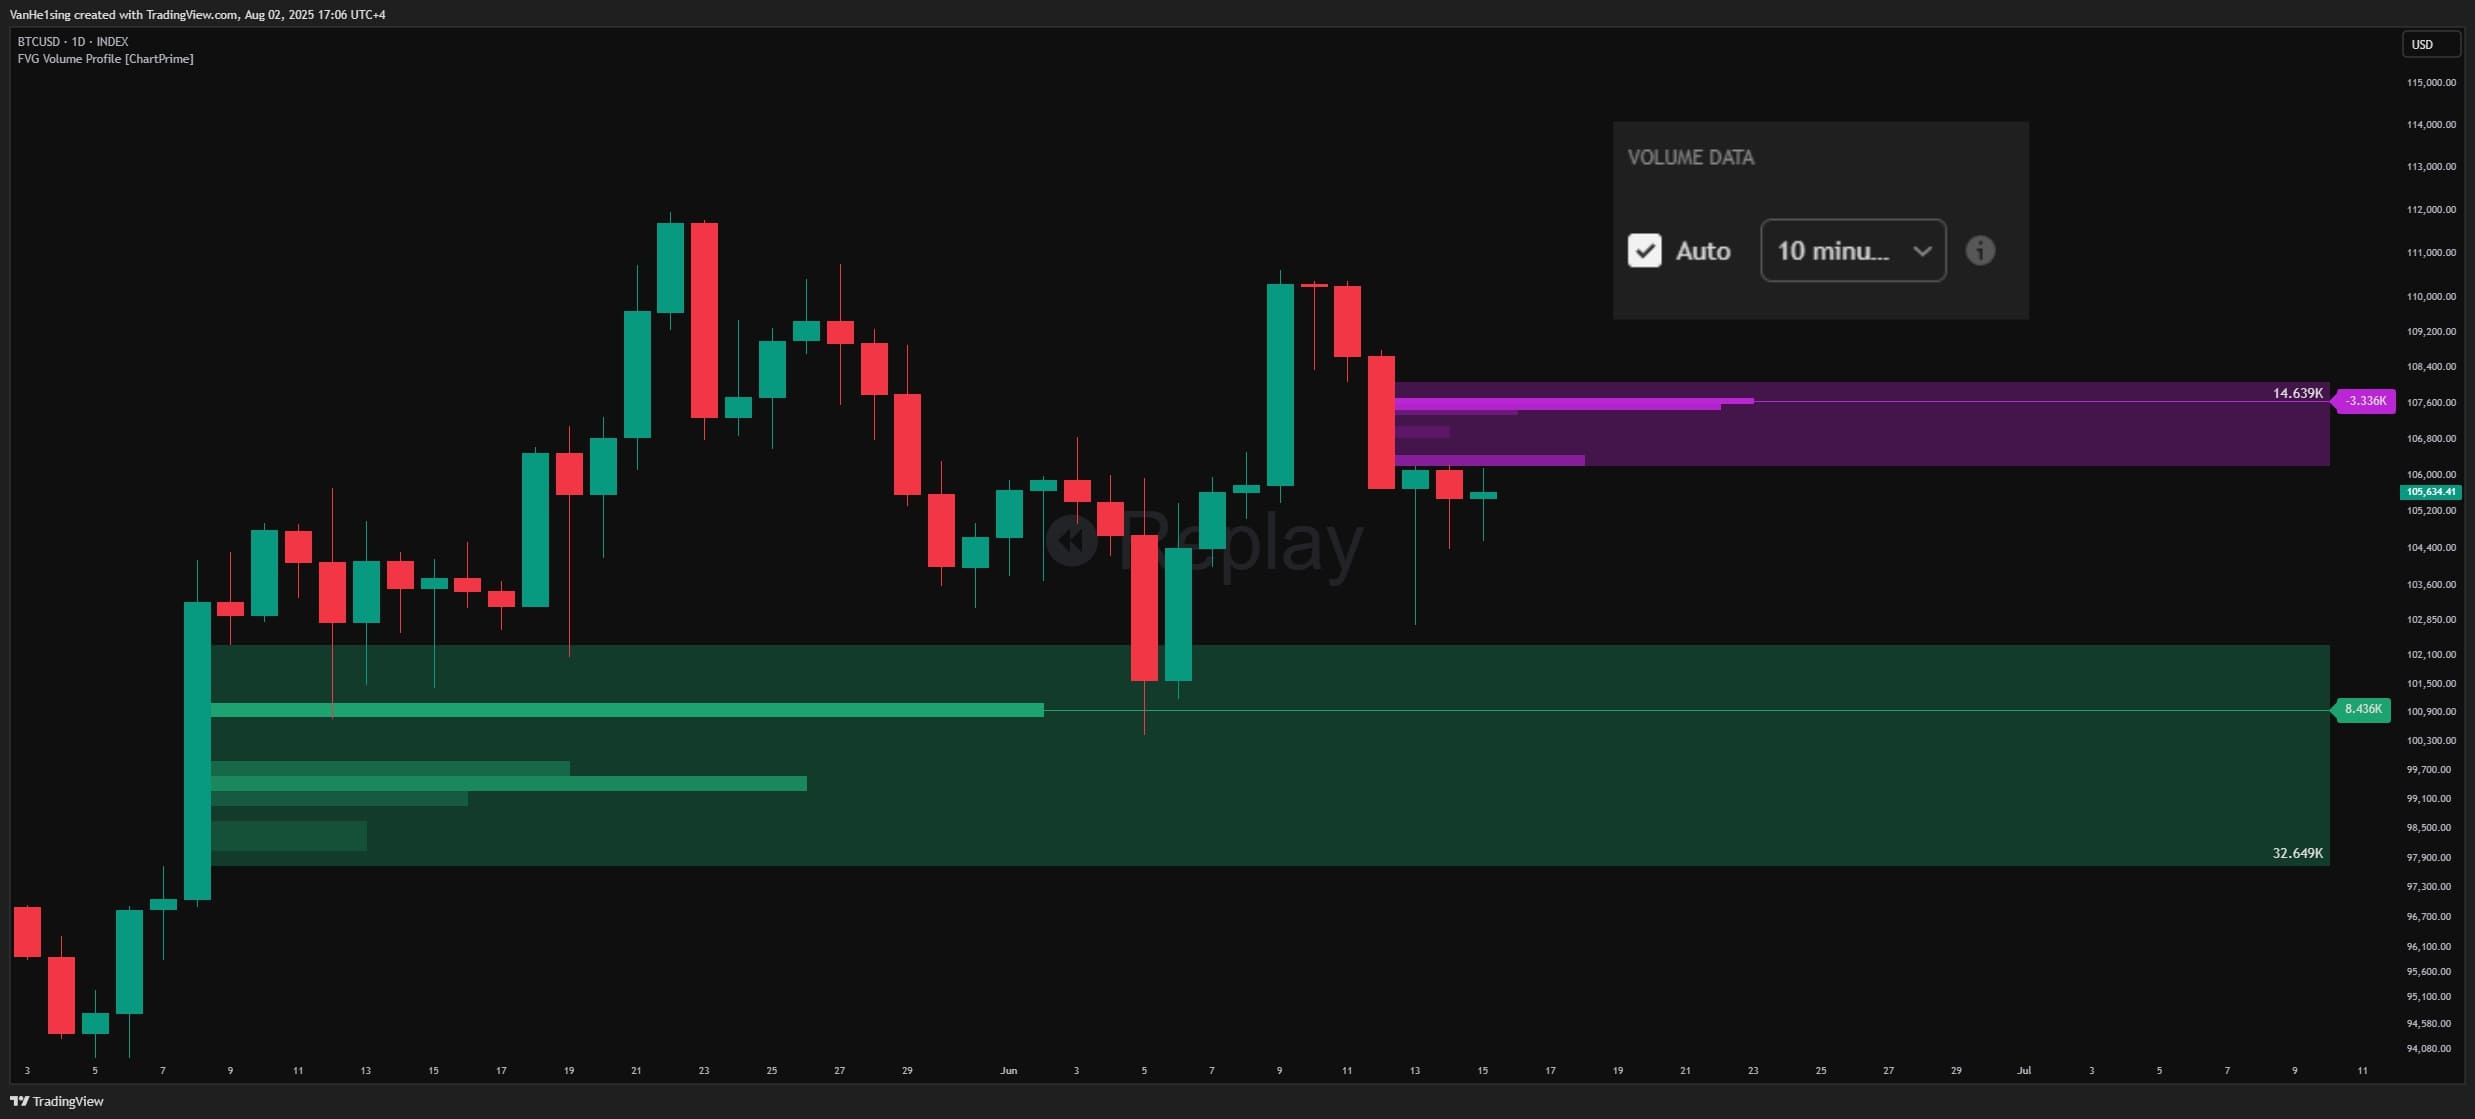
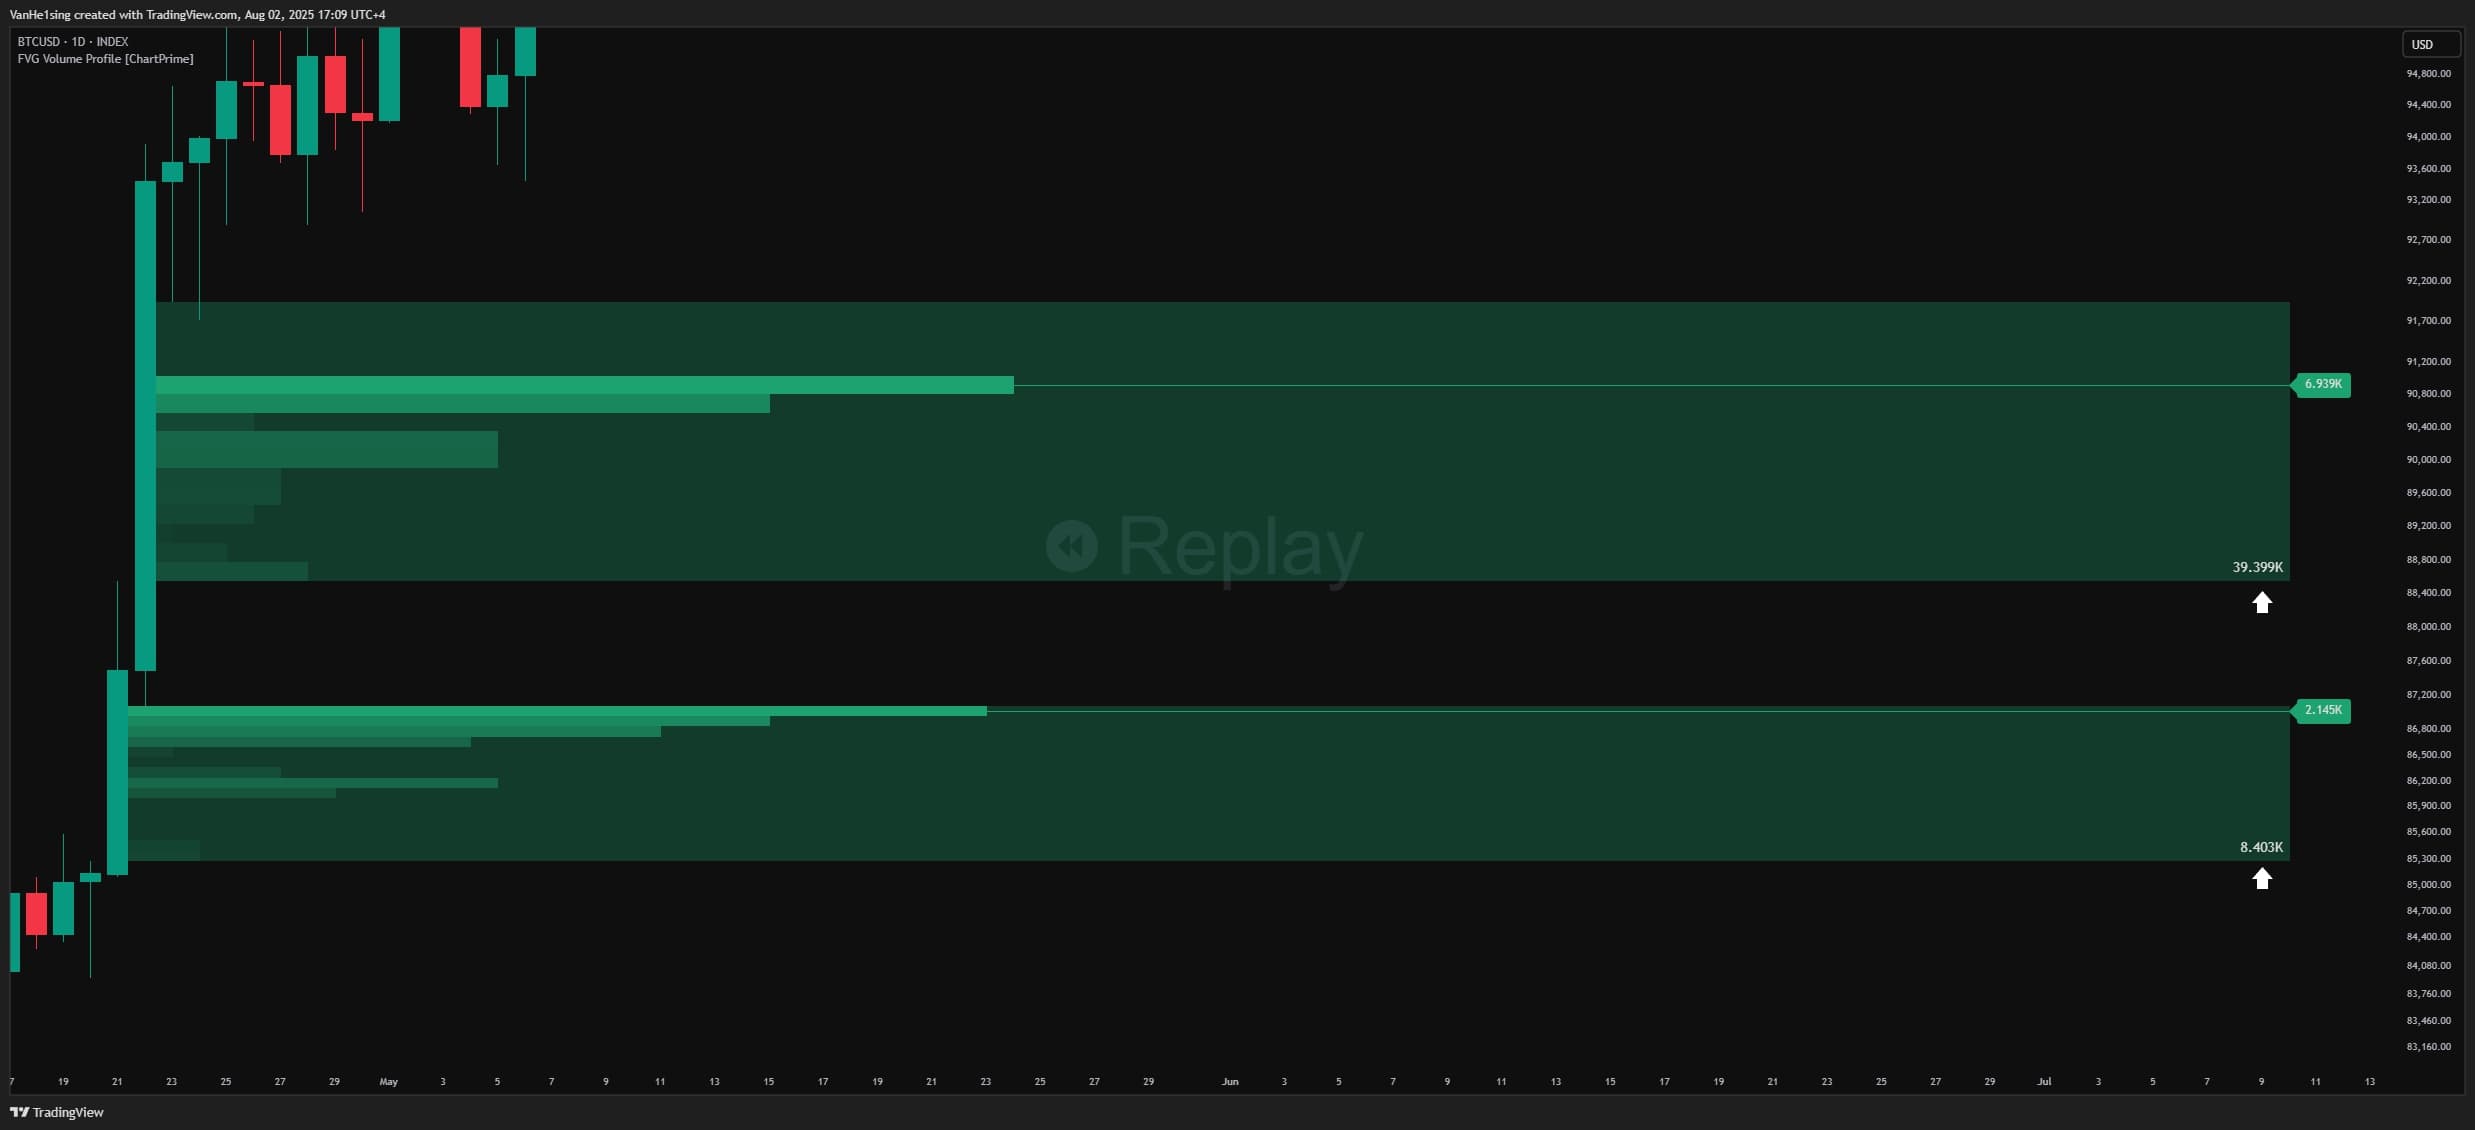
- Vertical Volume Profile: Horizontal bars inside each FVG representing volume distribution by price level. Colors go from light to dark depending on density (darker = more trades).
- POC Line (Point of Control): A green (bullish) or purple (bearish) horizontal line marking the price level with the highest volume inside the FVG. This is the most important level to watch.
- POC Label: Displays the traded volume at the POC, helping assess how strong that level is.
- Total FVG Volume: A number displayed in the corner of each FVG box (bottom-right for bullish FVGs, top-right for bearish FVGs).
Adjustable options:
- Auto Timeframe mode: Automatically selects a 10x smaller timeframe to analyze volume (e.g., on a 1-hour chart it uses 6-minute data)
- Manual Timeframe mode: Allows choosing a specific lower timeframe for deeper analysis
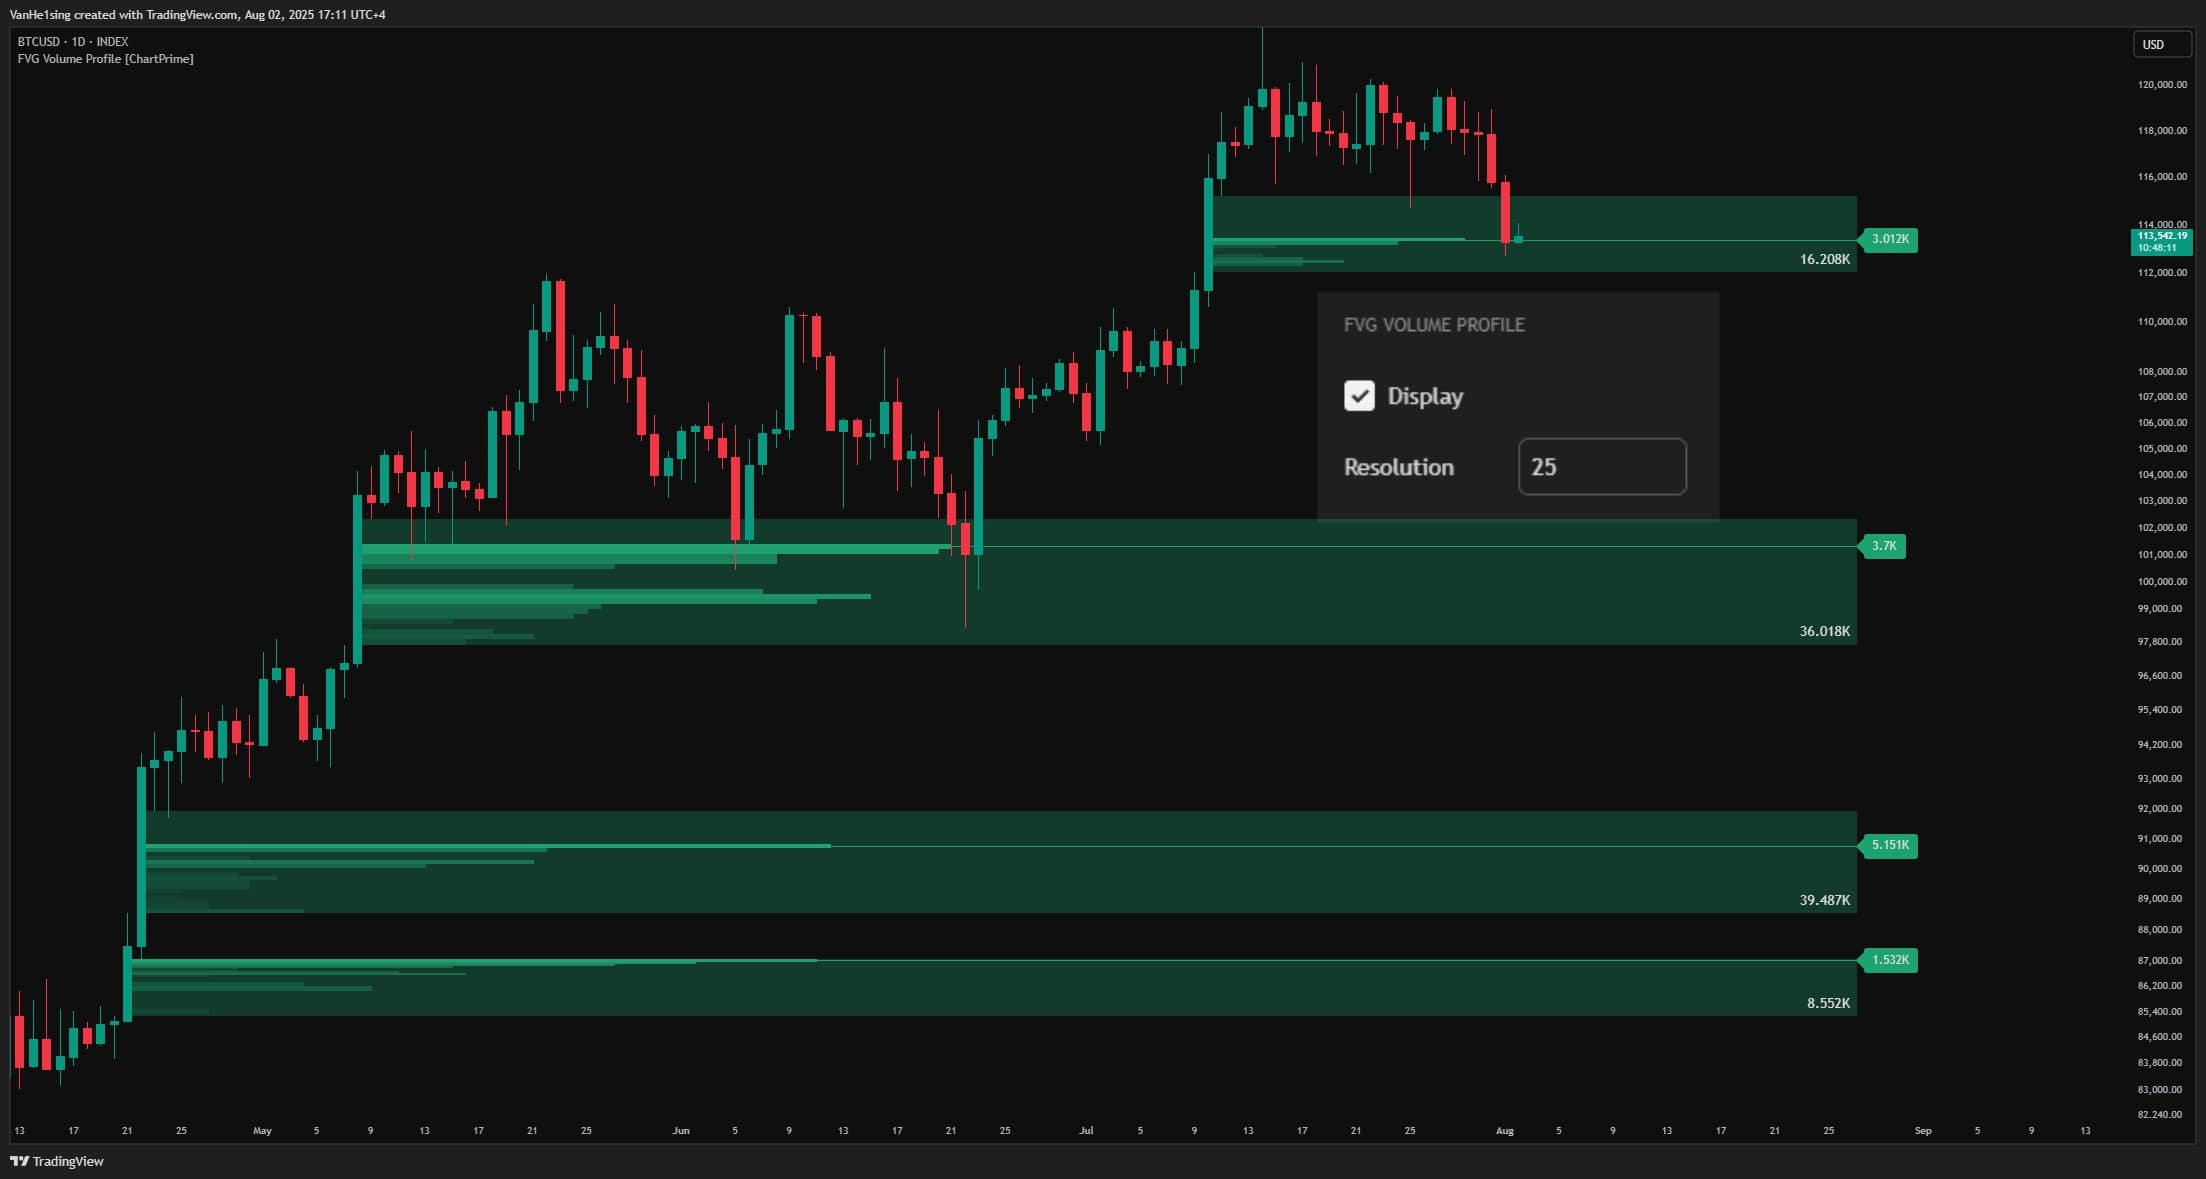
- Resolution: Adjust how many “bins” to segment the FVG—more bins = more detail (default 15)
- Filter Gaps: Keep only sufficiently large FVGs based on standard deviation to avoid noise from insignificant gaps
- Toggle Volume Profile: You can hide the detailed volume profile, keeping only the FVG box and POC line for a cleaner interface
Alerts:
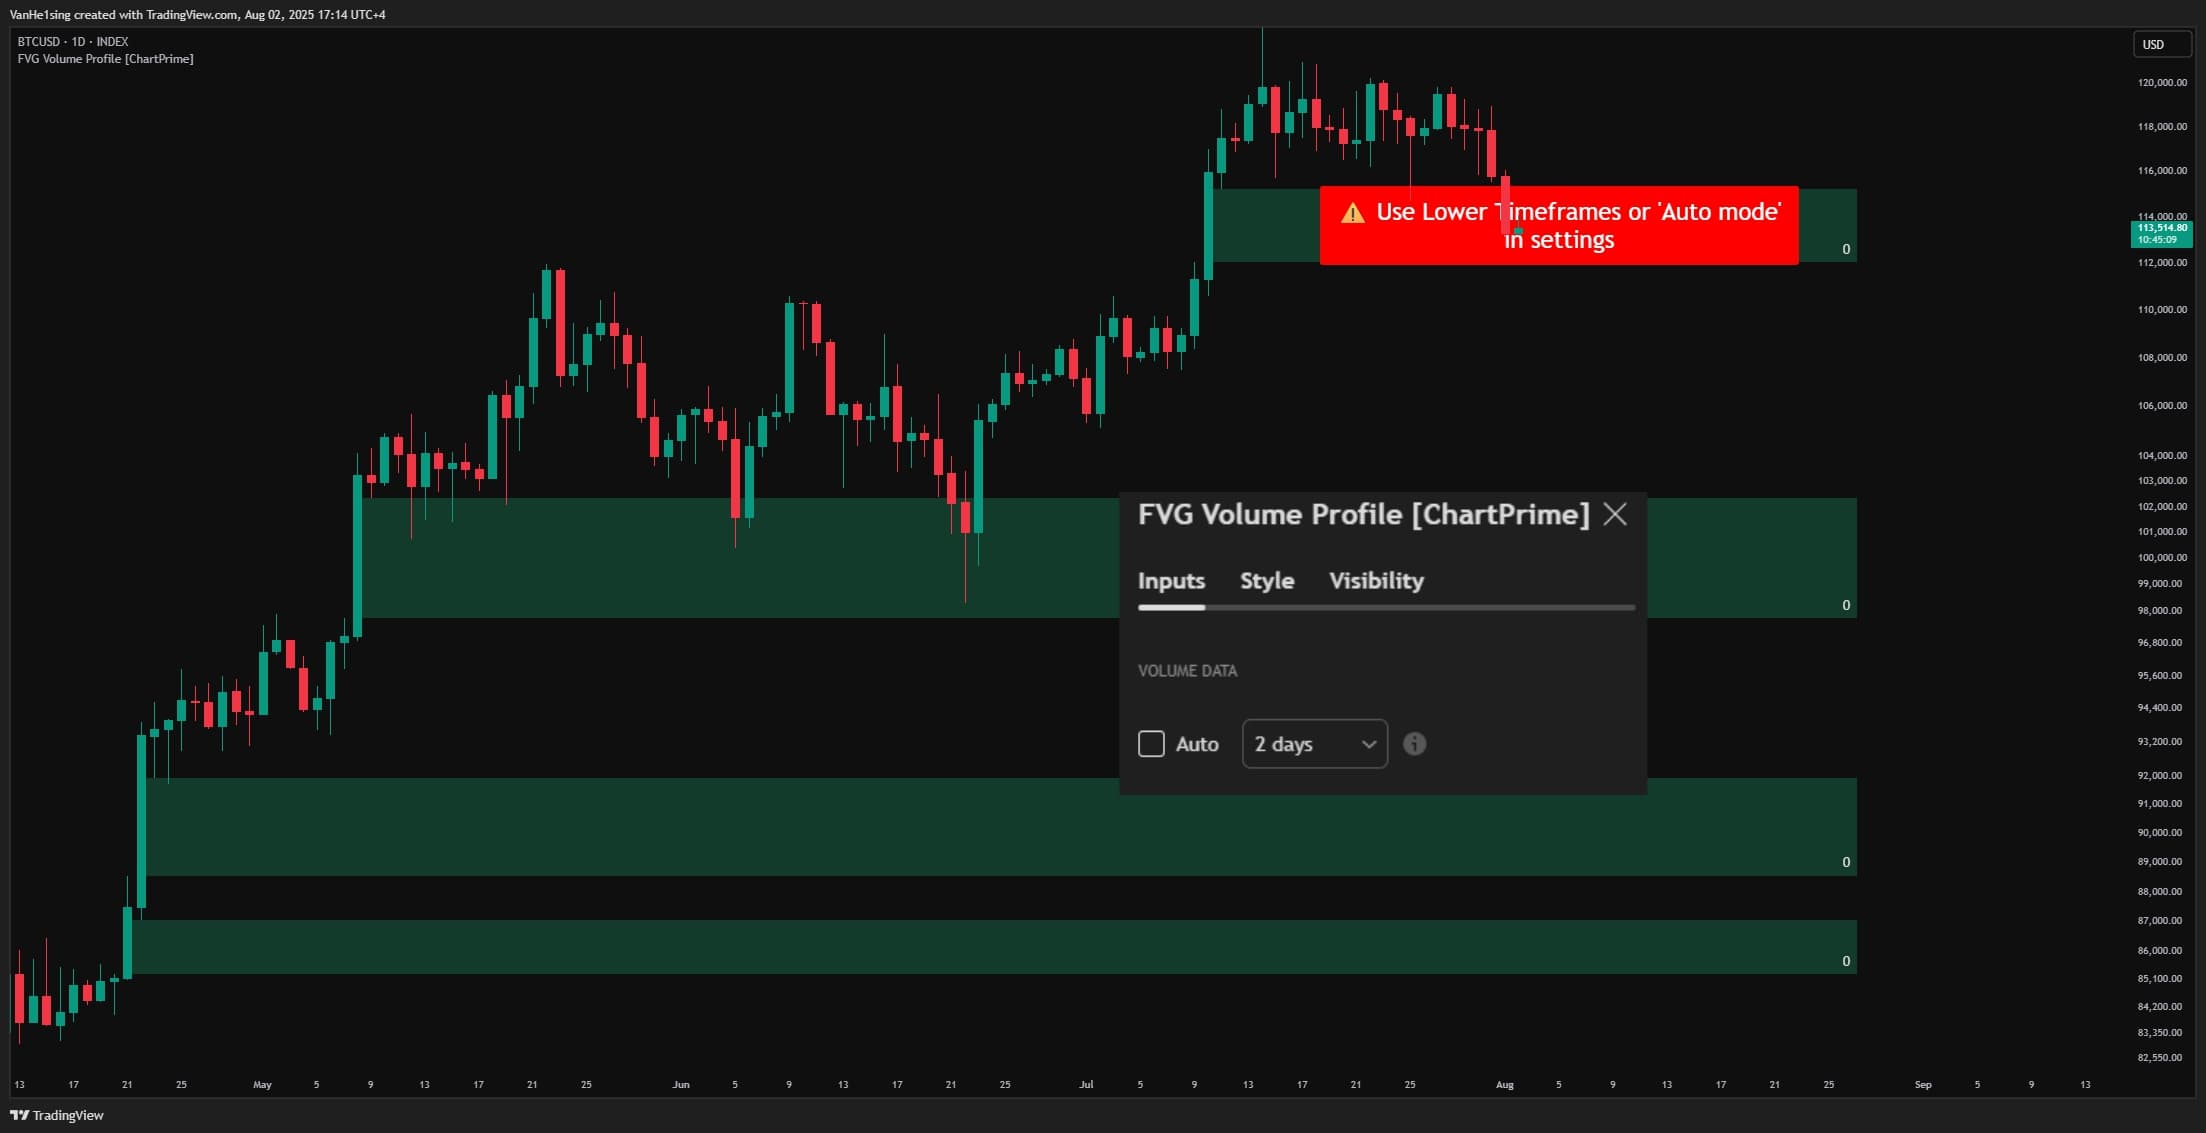
- Timeframe selection error: If the selected lower timeframe is invalid (greater than or equal to the current chart timeframe), the indicator shows a ⚠️ warning asking for adjustment
1.3 How to Use the Indicator
-
Identify strong support/resistance:
FVGs with high total volume are usually important. When price revisits these FVGs, strong reactions (bounce or breakout) are likely.
-
Pinpoint entries with POC:
Instead of entering randomly within a wide FVG, wait for price to approach the POC. The POC is where liquidity concentrates the most, often causing hesitation or strong reactions.
-
Place reasonable Stop Loss:
Set SL outside the complete FVG, or below/above the POC if you want a tighter SL. If price breaks through POC, that FVG may have lost effectiveness.
-
Take profit with multiple targets:
Scale out at subsequent FVGs or at the POC of another FVG. This helps optimize the Risk/Reward ratio.
-
Combine trend context with the volume view:
- Bullish FVG + POC near the top: Indicates strong buying pressure; price may only tag the top of the FVG then continue higher
- Bullish FVG + POC near the bottom: Suggests substantial selling activity; price may fill deeper into the FVG
- Similarly for bearish FVGs -
Assess FVG strength:
Compare total volume across FVGs. The one with higher volume tends to have a stronger impact when retested.
-
Track “filled” FVGs:
When closing price crosses an FVG boundary (bullish FVG closes below its low; bearish FVG closes above its high), the indicator auto-removes that FVG from the chart—indicating the zone has completed its role or lost value.
1.4 How the Indicator Works
Inputs & roles
- Price data (OHLC): Close, high, low, and open from the last 3 candles to detect FVGs. This is the primary source that determines whether a structural gap exists.
- Lower Timeframe volume data (variables c and v): Arrays of closes and volumes from all lower timeframe candles within a single candle of the current chart timeframe. For example, on a 1H chart with a 6-minute lower TF, each 1H candle contains 10 x 6-minute candles (60/6 = 10).
- Filter Gaps (variable gap_filter): Threshold based on standard deviation. Only sufficiently large FVGs (above threshold) are considered, filtering out insignificant noise.
- Number of bins (variable bins): Controls the detail level of the volume profile—how many segments the FVG is divided into for distribution analysis.
- Timeframe Settings: Auto or Manual to choose the lower TF used for volume analysis.
Main logic blocks
-
LOGIC 1 – Detect FVG (detectFairValueGap()):
Bullish FVG: When low (current candle low) > high[2] (high of the candle 2 bars back) AND high[1] > high[2] AND gap size > filter threshold. This means there is a gap between the current candle and the one 2 bars back, with the middle candle not filling it.
Bearish FVG: The opposite—high < low[2] AND low[1] < low[2] AND gap size > filter threshold. -
LOGIC 2 – Normalize FVG size:
Use ta.stdev() with a 200-bar lookback to normalize gap size. This adapts the indicator to different volatility regimes across symbols and timeframes.
-
LOGIC 3 – Pull lower timeframe data (request.security_lower_tf()):
Fetch arrays of closes (c) and volumes (v) from the selected lower TF. In Auto mode, lower TF = chart TF / 10; otherwise use the manually specified TF.
-
LOGIC 4 – Split the FVG into bins:
Each FVG is evenly divided into bins segments vertically (default 15). Each bin represents a small price range within the FVG. Formula: binSize = (fvg_upper - fvg_lower) / bins
-
LOGIC 5 – Allocate volume to each bin:
For each bin, iterate over all lower-TF candles and accumulate the volume for candles whose close lies within that bin’s price range. Condition: math.abs(close_LTF - bin_midpoint) <= binSize. The result is volumeProfile, an array holding total volume per bin.
-
LOGIC 6 – Find POC (Point of Control):
Use volumeProfile.max() to locate the bin with the highest volume. Draw a horizontal poc line at that bin’s midpoint price and attach a pocLbl label showing the volume value.
-
LOGIC 7 – Draw Volume Profile Boxes:
Create horizontal boxes for each bin, with width proportional to volume relative to the max bin. Formula: boxWidth = (bin_volume / max_volume) * scale_factor. Gradient color from light (low volume) to dark (high volume).
-
LOGIC 8 – Manage dynamic FVGs:
Each new FVG is pushed into the fvgs array (custom type fvg). If there are more than 10 FVGs, the oldest is removed to keep the chart clean. FVGs automatically extend to the right over time.
-
LOGIC 9 – Remove FVG when filled:
During updates, if the close crosses the FVG boundary (bullish FVG: low < FVG.bottom; bearish FVG: high > FVG.top), the FVG box, POC line, label, and volume boxes are all removed, and that FVG is dropped from the array.
Outputs & practical roles
-
FVG Box (object box):
A light green (bullish) or light purple (bearish) rectangle marking the FVG on the chart. Traders use it to spot key areas of interest.
-
Volume Profile Boxes (array volumeBoxes):
Horizontal bars inside the FVG with varying color and length. Traders read them to gauge trade density per price level—longer/darker bars = more volume.
-
POC Line (object line):
A green or purple horizontal line marking the highest-volume price within the FVG. Potential entry level or strongest S/R inside the FVG.
-
POC Label (object label):
Displays the volume at POC. Traders use it to compare strength across different FVGs.
-
Total Volume Label (text inside the FVG Box):
Total traded volume across the entire FVG. Helps assess the overall importance of that FVG.
📖 Example of the processing flow:
Scenario: Viewing BTC/USDT on the 1-hour chart, Auto timeframe mode.
Step 1 – Inputs:
- Candle 1 (2 bars back): High = 65000, Low = 64500
- Candle 2 (1 bar back): High = 65200, Low = 64800
- Candle 3 (current): High = 66000, Low = 65300
- Analysis timeframe: 6 minutes (1H/10 = 6 minutes)
- Number of bins: 15
- Filter threshold: 0.5 standard deviation
Step 2 – Detect FVG:
- Check: Current Low (65300) > High[2] (65000)? ✓ Yes
- Check: High[1] (65200) > High[2] (65000)? ✓ Yes
- Gap size: (65300 − 65000) / stdev(200 bars) = 0.8 > 0.5 ✓ Pass
- Conclusion: Bullish FVG detected from 65000 to 65300 (300 USD gap)
Step 3 – Fetch lower timeframe data:
- Within the past 1H candle, there are 10 x 6-minute candles
- Close array: [64520, 64580, 64650, 64720, 64800, 64950, 65100, 65150, 65200, 65280]
- Volume array: [150, 200, 180, 220, 300, 280, 250, 190, 210, 240] (in BTC)
Step 4 – Split FVG into bins:
- FVG from 65000 to 65300, 15 bins
- Each bin = (65300 − 65000) / 15 = 20 USD
- Bin 1: 65000–65020, Bin 2: 65020–65040, …, Bin 15: 65280–65300
Step 5 – Allocate volume to bins:
- Iterate over 10 LTF candles: the 6th 6-minute candle has close=64950 (outside FVG 65000–65300, skip)
- 7th candle: close=65100, volume=250 → in Bin 5 (65080–65100) → Bin 5 += 250
- 8th candle: close=65150, volume=190 → in Bin 8 (65140–65160) → Bin 8 += 190
- 9th candle: close=65200, volume=210 → in Bin 10 (65180–65200) → Bin 10 += 210
- 10th candle: close=65280, volume=240 → in Bin 14 (65260–65280) → Bin 14 += 240
- Result: volumeProfile = [0,0,0,0,250,0,0,190,0,210,0,0,0,240,0]
Step 6 – Find POC:
- Max volume = 250 (at Bin 5)
- POC = midpoint of Bin 5 = (65080 + 65100) / 2 = 65090
- Draw a green horizontal line at 65090
- Attach label: “250 BTC”
Step 7 – Draw Volume Boxes:
- Bin 5 (volume=250, max): Longest bar, dark green
- Bin 14 (volume=240): Length 96% of Bin 5, medium green
- Bin 10 (volume=210): Length 84%, lighter green
- Bin 8 (volume=190): Length 76%, very light green
- Other bins: Not drawn (volume = 0)
Step 8 – Display on chart:
- Light-green FVG box from 65000–65300, extending to the right
- Four horizontal volume bars at the respective price levels
- Prominent POC line at 65090
- Bottom-right corner label: “2220 BTC” (total volume = 250+190+210+240)
Step 9 – Monitor & remove:
- Price continues to 66000; FVG still valid (low hasn’t touched 65000)
- After 5 bars, price pulls back to 64900 (low < 65000 = FVG bottom)
- Indicator automatically removes the entire FVG from the chart
- Meaning: The FVG has been “filled”—the market returned to balance that zone
How traders can use this:
- When the FVG formed at 65300, mark 65000–65300 as potential support
- Pay special attention to 65090 (POC)—the highest liquidity area
- If price retests, consider a buy near 65090 with SL below 65000
- Targets can be the next FVG or prior resistance
- If price breaks below 65000, this FVG failed = weak structure


Use the analysis above + the code below to instruct AI to modify the indicator and turn it into a trading bot—no coding required!
How to do it here -> 👉ZERO2HERO👈
					// This Pine Script™ code is subject to the terms of the Mozilla Public License 2.0 at https://mozilla.org/MPL/2.0/
// © ChartPrime


//@version=6
indicator('FVG Volume Profile [ChartPrime]', overlay = true, max_boxes_count = 500, max_lines_count = 100, max_bars_back = 5000, max_labels_count = 500)

// --------------------------------------------------------------------------------------------------------------------}
// --------------------------------------------------------------------------------------------------------------------{

bool autoTf = input.bool(true, "Auto", inline = "1", group = "Volume DATA")
string tf1 = input.timeframe(
     "10",
     "",
     inline = "1",
     group = "Volume DATA",
     tooltip = "Select the custom timeframe for detecting volume of Fair Value Gaps. To use this setting, turn off the 'Auto' toggle. Otherwise, the indicator will follow the chart's 10 times lower timeframe automatically."
 )
bool   hideVP = input.bool(true, "Display", group = "FVG Volume Profile")
int    bins   = input.int(15, "Resolution", group = "FVG Volume Profile")


float  gap_filter = input.float(0.5, 'Filter Gaps', step = 0.01)

color  bull_color = input.color(#1da370, 'Bullish Color')
color  bear_color = input.color(#bc25d6, 'Bearish Color')


type fvg
    box FVG
    bool isBull
    array<float> volumeProfile
    array<box> volumeBoxes
    line poc
    label pocLbl


// --------------------------------------------------------------------------------------------------------------------}
// --------------------------------------------------------------------------------------------------------------------{
time_ = timeframe.in_seconds(tf1)/60
currentTime = timeframe.in_seconds("")/60

// Warning
if time_ >= currentTime and not autoTf
    label.delete(label.new(bar_index+3, hl2, "⚠️ Use Lower Timeframes or 'Auto mode'\nin settings", style = label.style_label_center, color = color.rgb(255, 0, 0), size = size.huge)[1])


array<float>   c       = request.security_lower_tf('', time_ >= currentTime and not autoTf ? "" : (autoTf ? str.tostring(int(currentTime/10)) : tf1), close)
array<float>   v       = request.security_lower_tf('', time_ >= currentTime and not autoTf ? "" : (autoTf ? str.tostring(int(currentTime/10)) : tf1), volume)

float bearish_gap_size = (low[2] - high) / ta.stdev(low[2] - high, 200)
float bullish_gap_size = (low - high[2]) / ta.stdev(low - high[2], 200)


detectFairValueGap() =>
    var pocLblAllow = true
    var fvgs    = array.new<fvg>()
    volumeP     = array.new<float>(bins, 0.)
    volumeBoxes = array.new<box>(bins, box(na))
    poc         = line(na)
    pocLbl      = label(na)

    // Conditions to detect bullish and bearish gaps
    bool bullish_gap_condition = low > high[2] and high[1] > high[2] and bullish_gap_size > gap_filter
    bool bearish_gap_condition = high < low[2] and low[1] < low[2] and bearish_gap_size > gap_filter

    cls_array = c[1]
    vol_array = v[1]

    // Bullish FVG logic
    if bullish_gap_condition
        pocLblAllow := false
        fvg_lower = high[2]
        fvg_upper = low

        fvg_box = box.new(bar_index - 1, fvg_upper, bar_index + 3, fvg_lower, border_color = na, border_width = 0, bgcolor = color.new(bull_color, 70))

        binSize = (fvg_upper-fvg_lower)/bins

        for k = 0 to bins -1
            volumeP.set(k, 0.)

        if cls_array.size() > 0
            for k = 0 to bins -1

                lower = fvg_lower + binSize * k
                mid = lower + binSize/2
                for i = 0 to cls_array.size() - 1

                    cls = cls_array.get(i)
                    vol = vol_array.get(i)

                    if math.abs(cls-mid) <= binSize
                        volumeP.set(k, volumeP.get(k) + vol)

        for k = 0 to bins -1

            lower = fvg_lower + binSize * k
            upper = lower + binSize
            mid = lower + binSize/2

            volumeBoxes.set(k, box.new(bar_index-1, upper, bar_index-1, lower, border_width = 0))

            vol = volumeP.get(k)
            if volumeP.max() != 0
                if vol == volumeP.max() and not pocLblAllow
                    poc    := line.new(bar_index-1, mid, bar_index-1, mid, color = bull_color)
                    pocLbl := label.new(bar_index-1, mid, str.tostring(volumeP.max(), format.volume), style = label.style_label_left, color = bull_color, textcolor = chart.fg_color)
                    pocLblAllow := true

        fvgs.push(fvg.new(fvg_box, true, volumeP, volumeBoxes, poc, pocLbl))

    // Bearish FVG logic
    if bearish_gap_condition
        pocLblAllow := false
        fvg_upper = low[2]
        fvg_lower = high

        fvg_box = box.new(bar_index - 1, fvg_upper, bar_index + 3, fvg_lower, border_color = na, border_width = 0, bgcolor = color.new(bear_color, 70))


        binSize = (fvg_upper-fvg_lower)/bins

        for k = 0 to bins -1
            volumeP.set(k, 0.)

        if cls_array.size() > 0
            for k = 0 to bins -1

                lower = fvg_lower + binSize * k
                mid = lower + binSize/2

                for i = 0 to cls_array.size() - 1

                    cls = cls_array.get(i)
                    vol = vol_array.get(i)

                    if math.abs(cls-mid) <= binSize
                        volumeP.set(k, volumeP.get(k) + vol)

        for k = 0 to bins -1

            lower = fvg_lower + binSize * k
            upper = lower + binSize
            mid = lower + binSize/2
            vol = volumeP.get(k)

            volumeBoxes.set(k, box.new(bar_index-1, upper, bar_index-1, lower, border_width = 0))


            if volumeP.max() != 0  and not pocLblAllow
                if vol == volumeP.max()
                    poc := line.new(bar_index-1, mid, bar_index-1, mid, color = bear_color)
                    pocLbl := label.new(bar_index-1, mid, str.tostring(volumeP.max()*-1, format.volume), style = label.style_label_left, color = bear_color, textcolor = chart.fg_color)
                    pocLblAllow := true


        fvgs.push(fvg.new(fvg_box, false, volumeP, volumeBoxes, poc, pocLbl))


    if fvgs.size() > 10
        f = fvgs.shift()
        f.FVG.delete()
        f.poc.delete()
        f.pocLbl.delete()


        for b in  f.volumeBoxes
            b.delete()


    if fvgs.size() > 0

        for f in fvgs

            f.FVG.set_right(bar_index+25)

            top = f.FVG.get_top()
            bot = f.FVG.get_bottom()
            left = f.FVG.get_left()
            right = f.FVG.get_right()
            binSize = (top-bot)/bins

            boxes = f.volumeBoxes

            f.poc.set_x2(right)
            f.pocLbl.set_x(right)

            f.FVG.set_text(str.tostring(f.volumeProfile.sum(), format.volume))
            f.FVG.set_text_halign(text.align_right)
            if f.isBull
                f.FVG.set_text_valign(text.align_bottom)
            else
                f.FVG.set_text_valign(text.align_top)

            f.FVG.set_text_size(size.normal)
            f.FVG.set_text_color(chart.fg_color)

            if f.isBull

                if low < f.FVG.get_bottom()
                    f.FVG.delete()
                    for b in boxes
                        b.delete()
                    f.poc.delete()
                    f.pocLbl.delete()

                    fvgs.remove(fvgs.indexof(f))

                for k = 0 to bins -1

                    lower = bot + binSize * k
                    upper = lower + binSize

                    volSum   = f.volumeProfile.max()
                    volRatio = f.volumeProfile.get(k) / volSum * 50
                    step = (right-left)/100
                    boxWidth = math.round(volRatio * step)
                    box_id = boxes.get(k)

                    bgColor = color.from_gradient(f.volumeProfile.get(k), 0, f.volumeProfile.max(), color.new(bull_color, 100), bull_color)

                    if boxWidth != 0 and hideVP

                        box_id.set_right(left+boxWidth)
                        box_id.set_bgcolor(bgColor)

            else

                if high > f.FVG.get_top()
                    f.FVG.delete()
                    for b in boxes
                        b.delete()
                    f.poc.delete()
                    f.pocLbl.delete()

                    fvgs.remove(fvgs.indexof(f))

                for k = 0 to bins -1

                    lower = bot + binSize * k
                    upper = lower + binSize

                    volSum   = f.volumeProfile.max()
                    volRatio = f.volumeProfile.get(k) / volSum

                    boxWidth = math.round(volRatio * (right-left)/2.5)
                    box_id = boxes.get(k)

                    bgColor = color.from_gradient(f.volumeProfile.get(k), 0, f.volumeProfile.max(), color.new(bear_color, 100), bear_color)

                    if boxWidth != 0 and hideVP
                        box_id.set_right(left+boxWidth)
                        box_id.set_bgcolor(bgColor)


detectFairValueGap()

// --------------------------------------------------------------------------------------------------------------------}
Các chỉ báo khác
FVG Volume Profile Analysis
The FVG Volume Profile indicator is based on the theory of Fair Value Gaps (FVG)—also known as “price imbalance” zones. These are gaps on the price chart formed when the market moves too quickly, creating price areas with little to no trades executed.

TP RSI Indicator
TP RSI v2.0 is built on the three-dimensional integration principle in technical analysis: Trend, Momentum, and Volatility. Instead of switching between multiple indicators, TP RSI brings everything onto a single screen.

Lorentzian Harmonic Flow – Temporal Market Dynamic (⚡LHF)
LHF (Lorentzian Harmonic Flow) posits that market time doesn’t tick evenly like a clock. When volatility spikes, time is “compressed” — a week’s worth of action can unfold in minutes. When the market ranges, time “expands” — price oscillates with no clear trend.
LHF applies the Lorentz formula from Einstein’s