1. Indicator Description – ICT Anchored Market Structures with Validation
A market-structure analysis tool based on Pure Price Action
1.1 Indicator Concept
This indicator is built on the Market Structure theory of ICT — a well-known price analysis approach in the trading community. The core idea is: price does not move randomly; it follows rule-based structures.
Main principles:
- Swing Points: The key highs and lows on the chart. They are like “markers” indicating where the market previously reversed or paused.
- Market Structure: How the market forms consecutive highs and lows. If each high is higher than the previous high and each low is higher than the previous low → the market is in an uptrend. Conversely → a downtrend.
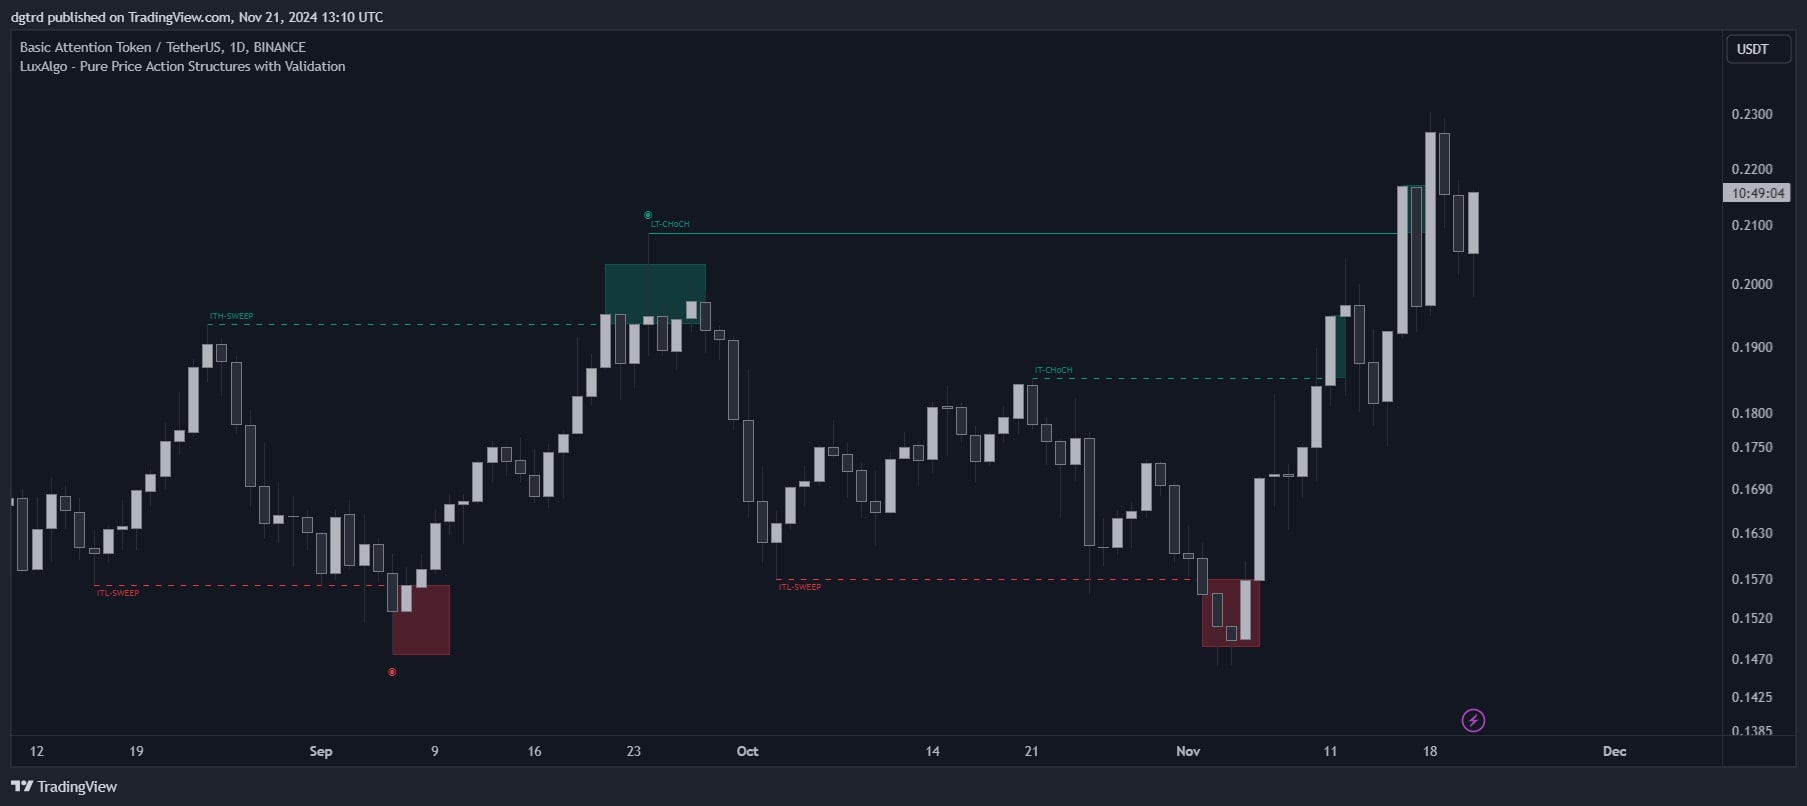
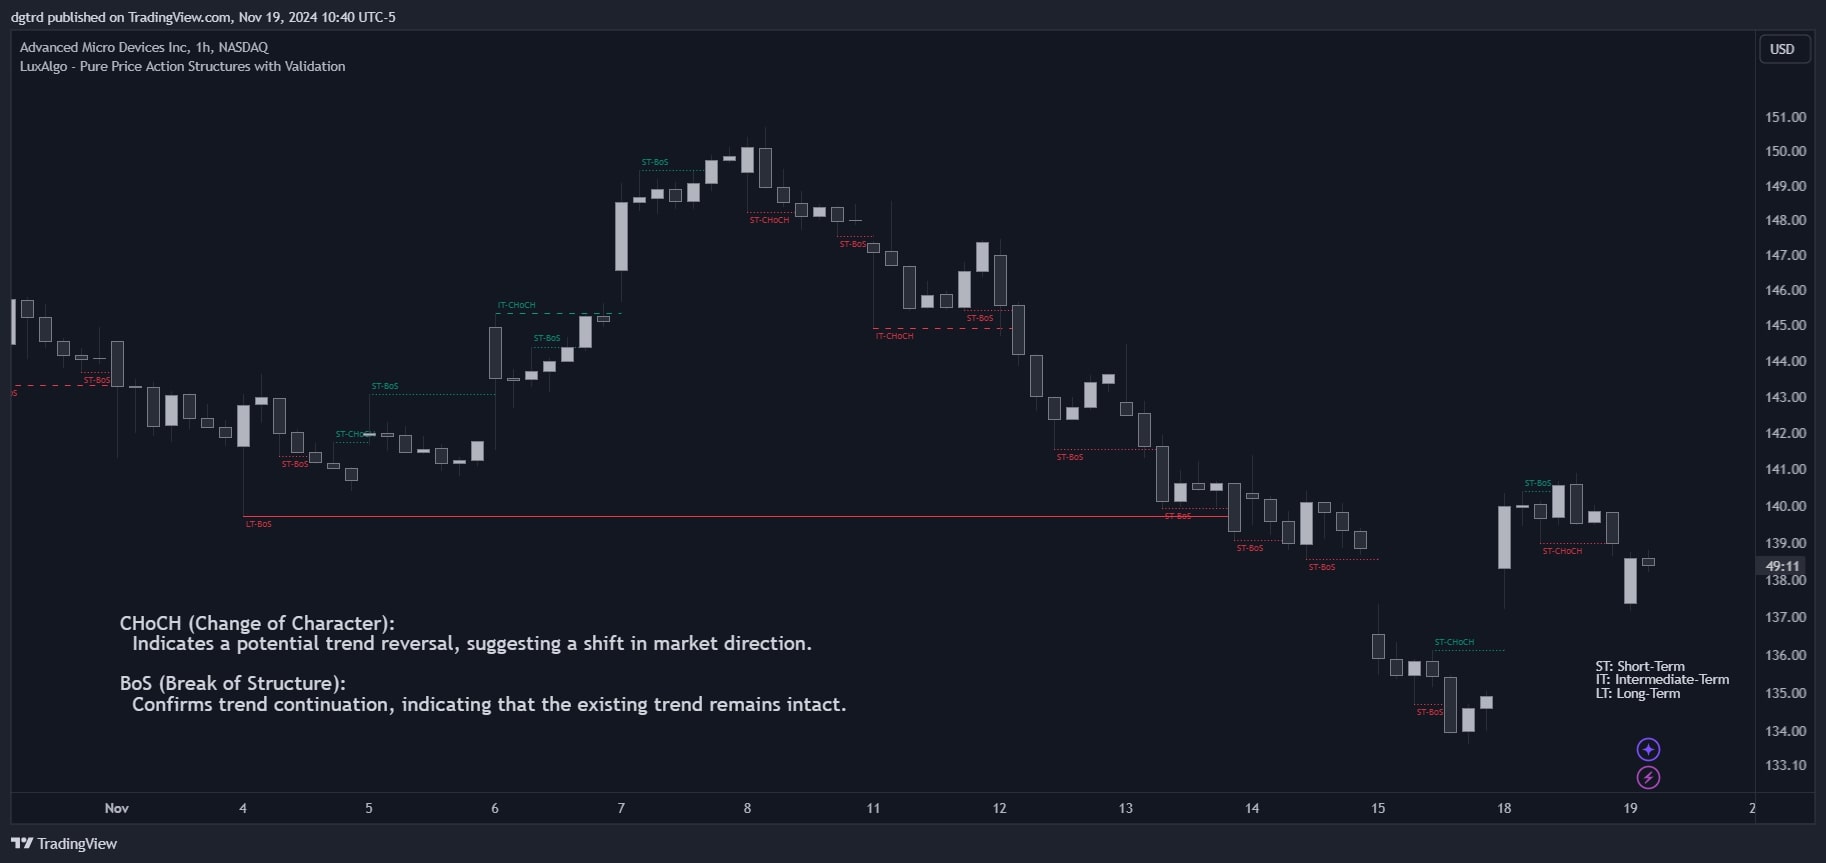
- CHoCH (Change of Character): When price breaks a significant swing point, signaling a potential reversal of trend.
- BoS (Break of Structure): When price breaks a swing point in the direction of the current trend, confirming trend continuation.
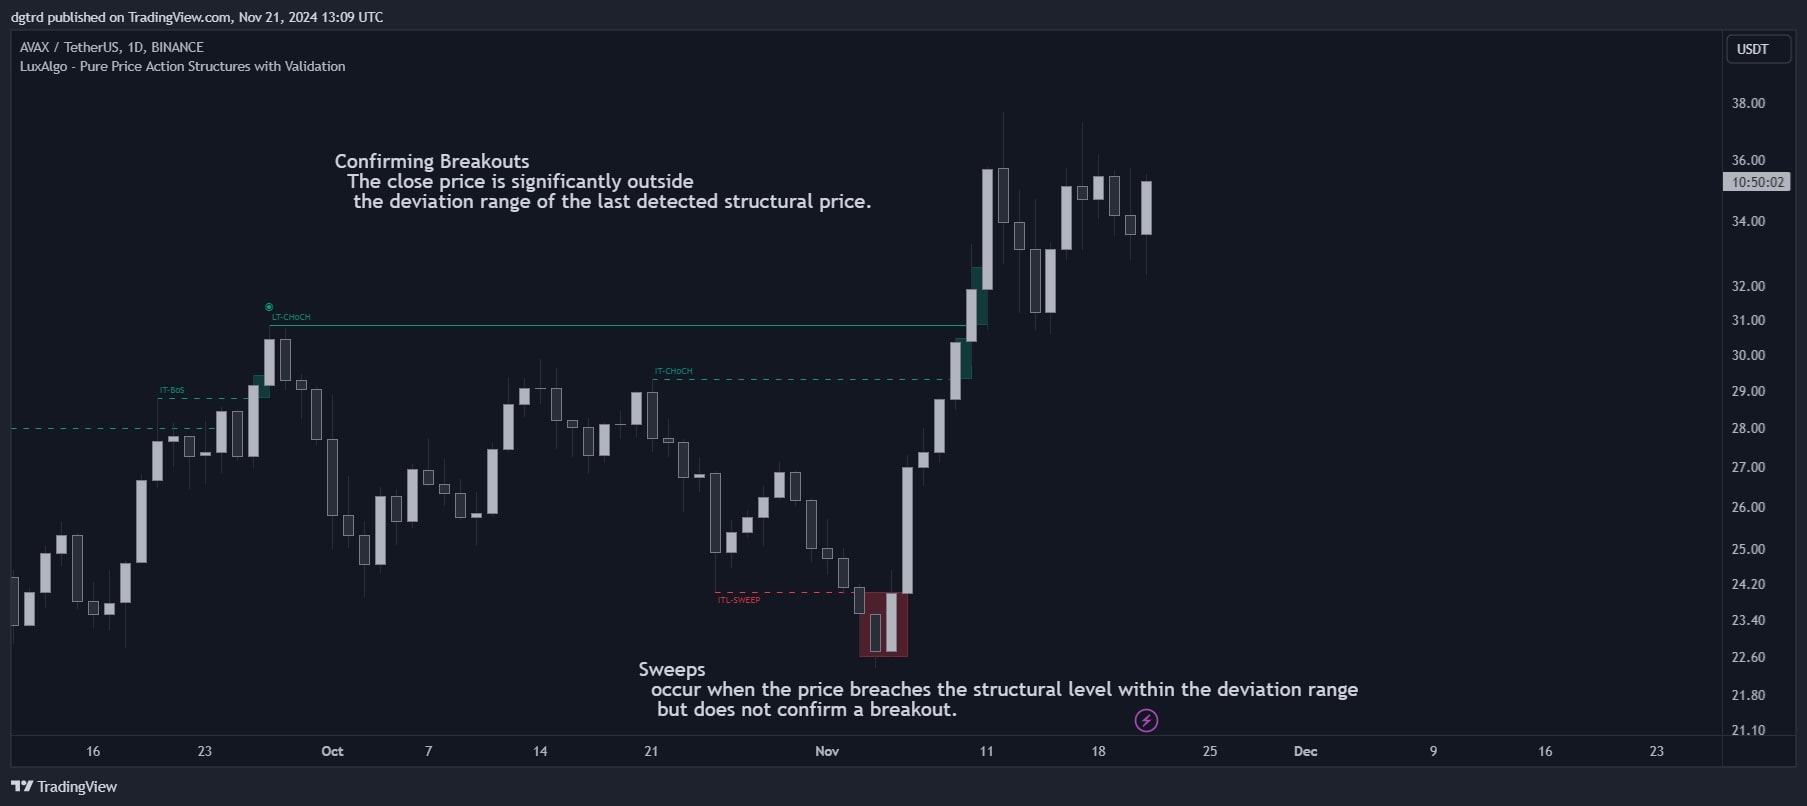
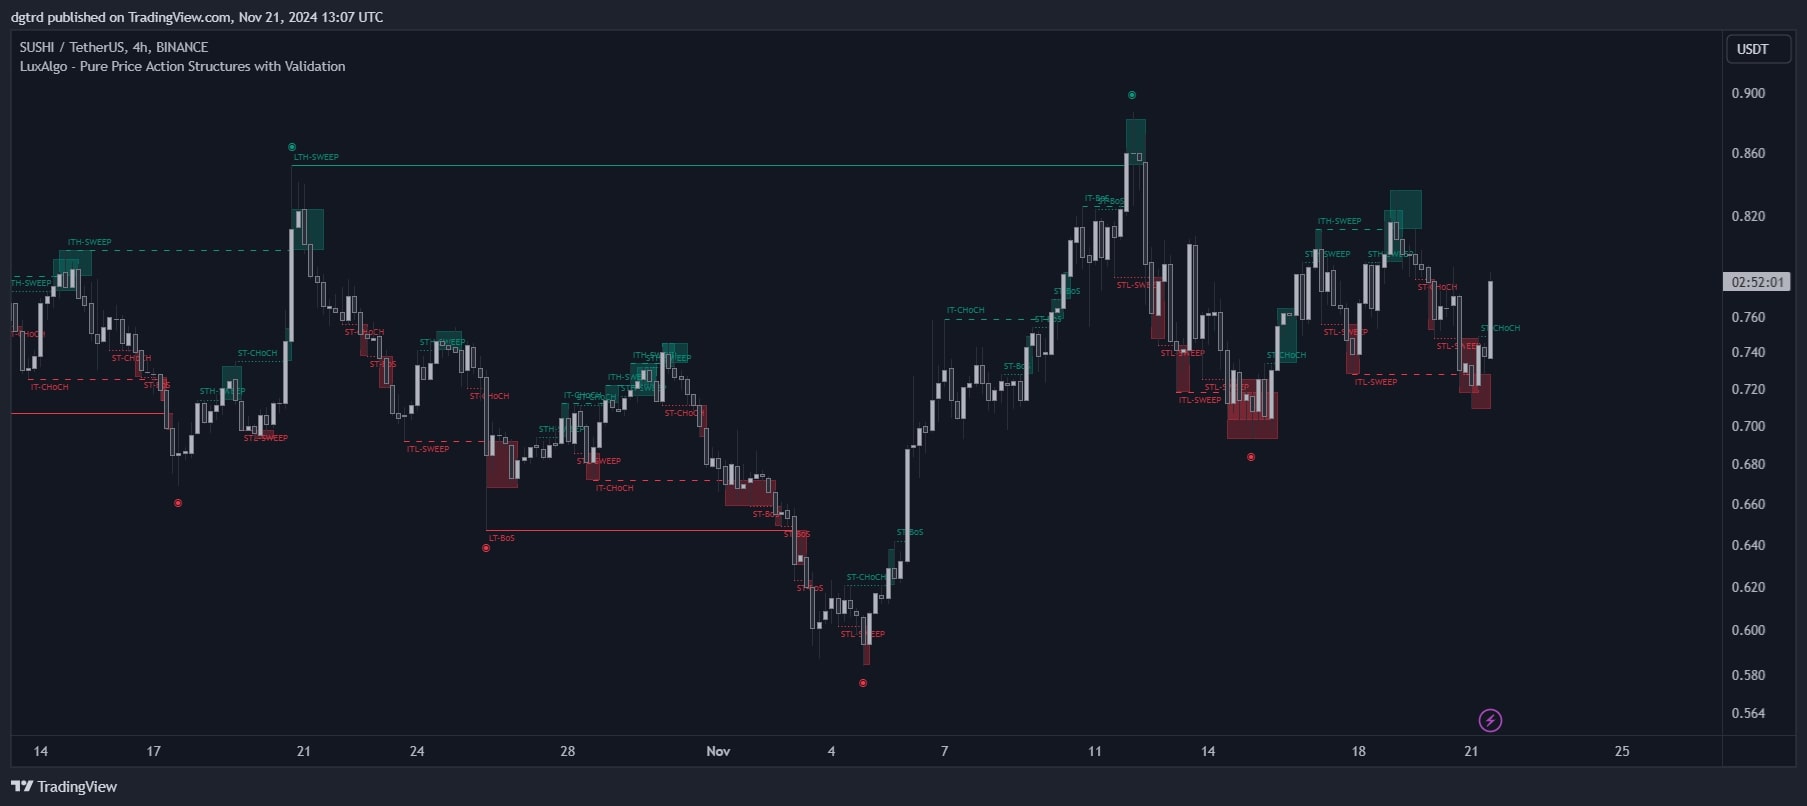
- Sweep: Sometimes price just “tags” a key level to “sweep” traders’ stop-loss orders, then immediately reverses. This is a trap, not a true breakout.
1.2 Indicator Features
What the indicator displays and alerts:
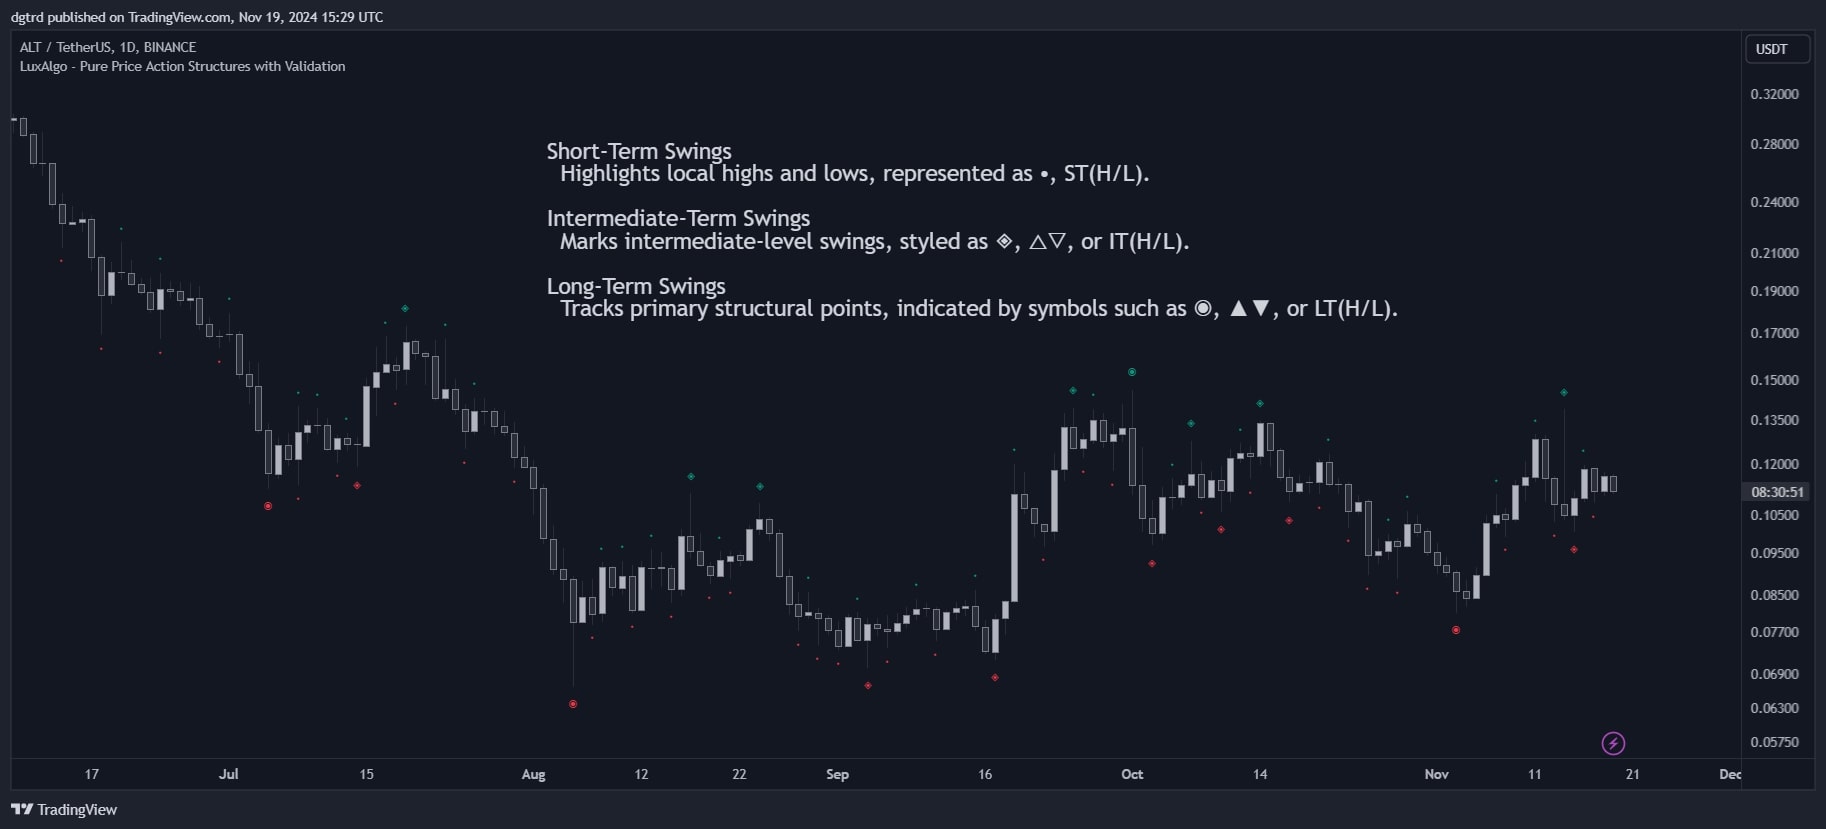
- Swing Points: Displayed with symbols like ⦁, ◈, ◉ or text such as ST-HH, IT-LL... at key highs/lows. Three tiers:
- Short-Term (ST): Small swings, occur frequently
- Intermediate-Term (IT): Medium swings, derived from short-term swings
- Long-Term (LT): Largest swings, derived from intermediate-term swings
- Market Structure Lines: Horizontal lines extended forward from swing points, marking critical levels to watch. Signals appear when price interacts with these lines.
- CHoCH/BoS Labels: When price breaks a structure line, the indicator automatically attaches labels:
- ST-CHoCH, IT-CHoCH, LT-CHoCH: Potential reversal at the corresponding tier
- ST-BoS, IT-BoS, LT-BoS: Trend continuation at the corresponding tier
- SWEEP Labels: If price merely tags a level without closing sufficiently beyond it, the label turns into SWEEP (e.g., ST-SWEEP), warning it may be a fake-out.
- Sweep Box: A faintly colored zone showing where price oscillated while validating whether it’s a real break or just a sweep. Helps visualize the breadth of the liquidity grab.
1.3 How to Use the Indicator
- Determine trend: Observe swing points. Consecutive Higher Highs (HH) and Higher Lows (HL) → uptrend. Lower Highs (LH) and Lower Lows (LL) → downtrend.
- Find entries on reversals: When CHoCH appears (especially IT-CHoCH or LT-CHoCH), it may signal the end of the old trend. Look for entries in the new direction. Example: market is falling, a bullish CHoCH appears → consider longs.
- Confirm ongoing trend: When you see BoS, especially at higher tiers (IT or LT), it signals the current trend remains strong. Look for pullback entries in trend direction.
- Avoid SWEEP traps: If the indicator shows SWEEP instead of CHoCH/BoS, don’t rush to trade in the breakout’s direction. It may be a stop-hunt before reversal.
- Set Stop Loss and Take Profit:
- Stop Loss: Place beyond the nearest swing point. For a long → SL below the recent swing low.
- Take Profit: Target the opposite swing point or the next liquidity pools (next swing high/low).
- Multi-timeframe confluence: Monitor all three tiers (ST, IT, LT). The strongest signals occur when all three align. Example: LT-BoS bullish + IT-BoS bullish + ST-CHoCH bullish → very strong bullish bias.
1.4 How the Indicator Works
Inputs & roles
- Open, High, Low, Close of each candle: The only raw data required. From these four values (especially High and Low), the indicator identifies swing points.
- Bar Index: Each candle’s position on the time axis, allowing correct placement of lines and labels.
- No user inputs: The indicator is fully price-driven, requiring no parameter tuning by the trader (100% objective).
Main logic blocks
- Block 1 – Detect Swing Points (queryPatterns):
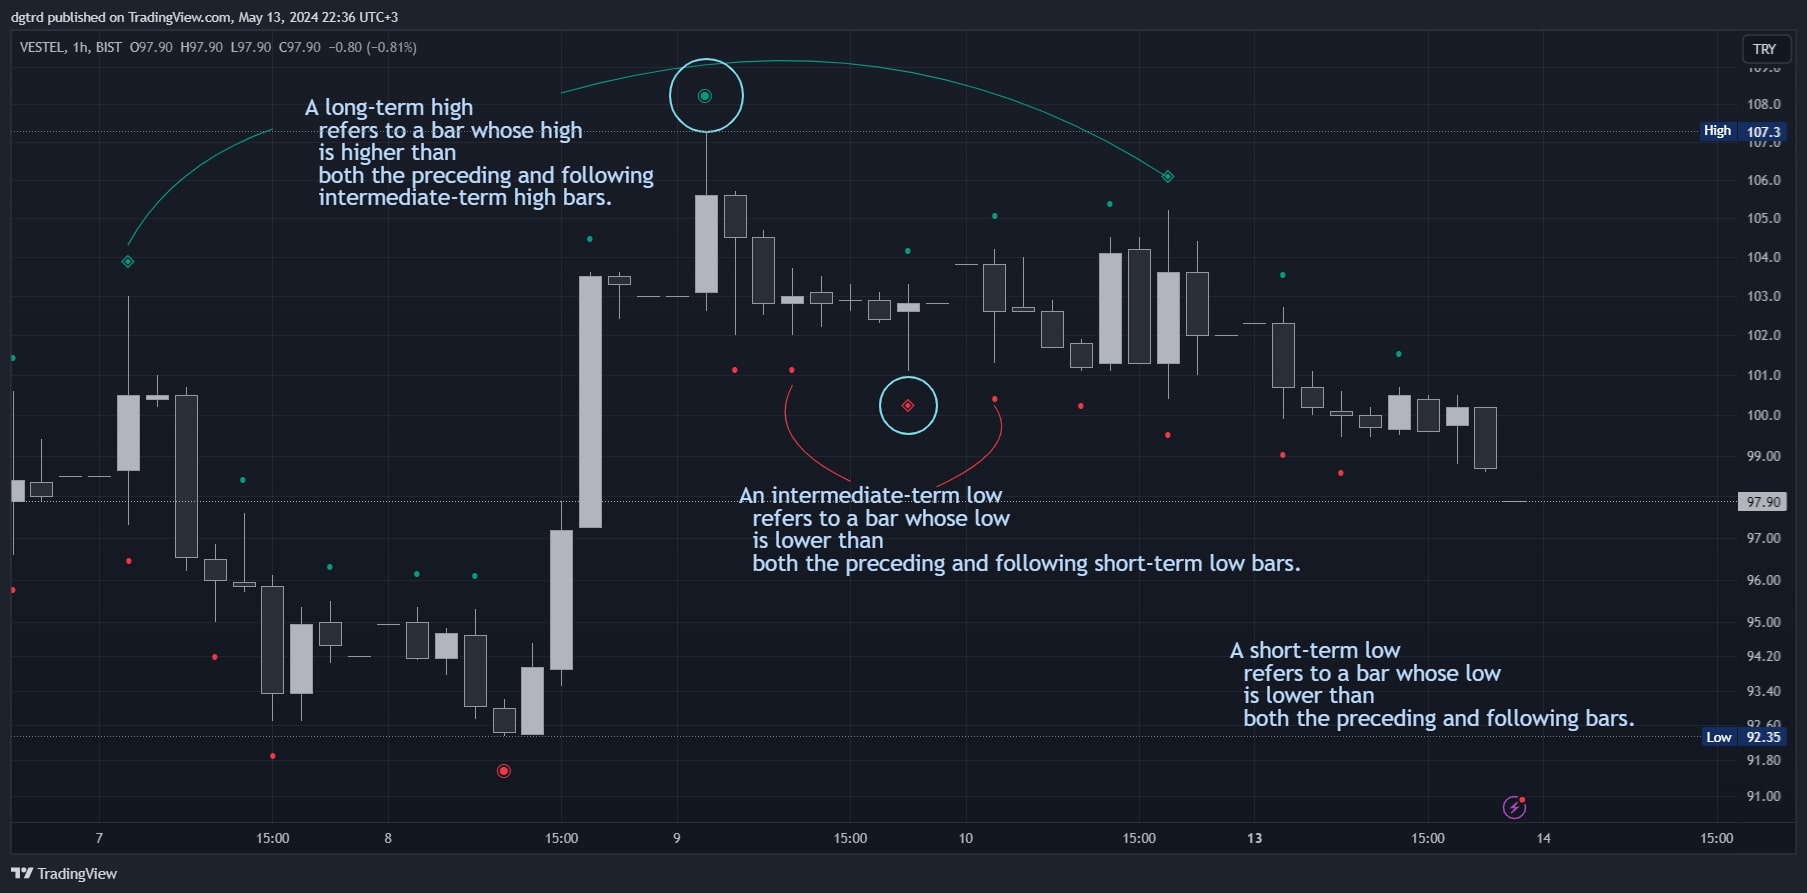
- Mechanism: Compare three consecutive candles. If the middle candle’s high is higher than both neighbors → Swing High. If the middle low is lower than both neighbors → Swing Low.
- Role: Identifies key “markers” on the chart. This is the foundation for market-structure detection.
- Code logic: prevPrice < midPrice and midPrice >= lastPrice (for swing high) and the inverse for swing low.
- Block 2 – Update Pattern (updatePattern):
- Mechanism: When a new swing is detected, store the price and position of the latest three swings (previous, mid, last). Clear the isCrossed flag to prepare for tracking the next break.
- Role: Maintains memory of recent swing points, needed to build higher tiers (IT, LT).
- Block 3 – Detect higher-tier structures:
- Intermediate Term (IT): Built from Short-Term swings. When three ST swings form a pattern → one IT swing is defined.
- Long Term (LT): Built from Intermediate-Term swings. When three IT swings form a pattern → one LT swing is defined.
- Role: Creates a multi-layered structure so traders can see the big picture (LT) and the details (ST) simultaneously.
- Block 4 – Render market structures (renderStructures):
- Mechanism: When price closes beyond a swing point (bullish: close > lastPrice, bearish: close < lastPrice), draw a horizontal line from that swing and set isCrossed = true. Start a faint box from this location.
- Role: Visual alert that an important structure level was just touched. Attach CHoCH or BoS depending on the prior state.
- Label logic: If prior bias was opposite → CHoCH. If aligned → BoS.
- Block 5 – Validate breaks (validateStructures):
- Mechanism: Compute 17-period ATR to form a deviation zone. If the close moves sufficiently beyond it (> lastPrice + ATR or < lastPrice − ATR) → confirm true break. If price oscillates within the ATR band around the swing → relabel as SWEEP.
- Role: Distinguishes real breakouts from fake liquidity sweeps, helping avoid traps.
- Sweep Box: The faint box expands candle by candle until confirmation. If it’s a sweep, the box remains within a narrow oscillation range.
Outputs & usage roles
- Swing Icons: Symbols ⦁, ◈, ◉ or text like ST-HH, IT-LL... plotted at highs/lows. Role: Quickly highlights key levels without manual drawing.
- Market Structure Lines: Horizontal lines extended from swing points. Role: Mark levels to watch; price interaction here often triggers movement.
- CHoCH/BoS Labels: Text above/below the line. Role: Indicates event type (reversal or continuation) and tier (ST, IT, LT).
- SWEEP Labels: Switches to “SWEEP” when a fake-out is detected. Role: Warns traders not to trust that breakout.
- Sweep Boxes: Shaded zones around the oscillation area. Role: Visualize the breadth of the sweep move to gauge strength/weakness.
Step 1 – Inputs: BTC at 50,000 USD. Previous candle high = 50,200; current candle high = 50,500; the one before that high = 50,100.
Step 2 – Swing detection logic: Compare: 50,100 < 50,200 < 50,500. The 50,200 candle is not a swing high (the next candle is higher). Wait for one more candle. New candle high = 50,300. Now: 50,200 < 50,500 > 50,300 → the 50,500 candle is a short-term Swing High (ST-HH).
Step 3 – Render structure: Draw a horizontal line at 50,500. When price closes above 50,500 (e.g., at 50,600), the indicator draws the line from that swing and attaches the “ST-BoS” label (uptrend and continuation break).
Step 4 – Validation: ATR(17) = 300. Validation band: 50,500 ± 300 = [50,200 – 50,800]. If price closes at 50,850 (beyond 50,800) → confirm true break. If price only oscillates within 50,200 – 50,800 then reverses → relabel as “ST-SWEEP”.
Step 5 – Outputs: The trader sees the symbol at 50,500, the horizontal line, the “ST-BoS” (or “ST-SWEEP”) label, and the shaded box. Decision: If BoS → look for long entries. If SWEEP → wait for clearer signals.


Use the analysis above + the code below to instruct AI to modify the indicator and turn it into a trading bot—no coding required!
How to do it here -> 👉ZERO2HERO👈
					// This work is licensed under a Attribution-NonCommercial-ShareAlike 4.0 International (CC BY-NC-SA 4.0) https://creativecommons.org/licenses/by-nc-sa/4.0/
// © LuxAlgo

//@version=5

indicator("ICT Anchored Market Structures with Validation [LuxAlgo]", 'LuxAlgo - ICT AMS', true, max_labels_count = 500, max_boxes_count = 500, max_lines_count = 500)

//---------------------------------------------------------------------------------------------------------------------
// Settings
//---------------------------------------------------------------------------------------------------------------------{

display  = display.all - display.status_line

stGroup = 'Short Term Structures'
stSwings = input.string('Disabled', 'Swings', options = ['⦁', 'ST(H/L)', 'Disabled'], inline = 'NA', group = stGroup, display = display)
stSwingsSZ  = input.string('Tiny', 'Size', options = ['Tiny', 'Small', 'Normal', 'Large'], inline = 'NA', group = stGroup, display = display)
stMarketStructures = input.bool(true, 'Market Structures', group = stGroup)
stMSSweepT = input.string('Enabled', '  Market Structure Validation', options = ['Enabled', 'Disabled'], group = stGroup, display = display), stMSSweep = stMSSweepT == 'Enabled'
stMSTextT = input.string('Enabled', '  Market Structure Labels', options = ['Enabled', 'Disabled'], group = stGroup, display = display), stMSText = stMSTextT == 'Enabled'
stMSLineStyle = input.string('Dotted', '  Line Style', options = ['Solid', 'Dashed', 'Dotted'], group = stGroup, inline = 'LN', display = display)
stMSLineWidth = input.int(1, 'Width', minval = 1, group = stGroup, inline = 'LN', display = display)
stBullMSColor = input.color(#089981, 'Swing and Line Colors, Bullish', group = stGroup, inline = 'MS')
stBearMSColor = input.color(#f23645, 'Bearish', group = stGroup, inline = 'MS')

itGroup = 'Intermediate Term Structures'
itSwings = input.string('Disabled', 'Swings', options = ['◈', '△▽', 'IT(H/L)', 'Disabled'], inline = 'NA', group = itGroup, display = display)
itSwingsSZ  = input.string('Small', 'Size', options = ['Tiny', 'Small', 'Normal', 'Large'], inline = 'NA', group = itGroup, display = display)
itMarketStructures = input.bool(true, 'Market Structures', group = itGroup)
itMSSweepT = input.string('Enabled', '  Market Structure Validation', options = ['Enabled', 'Disabled'], group = itGroup, display = display), itMSSweep = itMSSweepT == 'Enabled'
itMSTextT = input.string('Enabled', '  Market Structure Labels', options = ['Enabled', 'Disabled'], group = itGroup, display = display), itMSText = itMSTextT == 'Enabled'
itMSLineStyle = input.string('Dashed', '  Line Style', options = ['Solid', 'Dashed', 'Dotted'], group = itGroup, inline = 'LN', display = display)
itMSLineWidth = input.int(1, 'Width', minval = 1, group = itGroup, inline = 'LN', display = display)
itBullMSColor = input.color(#089981, 'Swing and Line Colors, Bullish', group = itGroup, inline = 'MS')
itBearMSColor = input.color(#f23645, 'Bearish', group = itGroup, inline = 'MS')

ltGroup = 'Long Term Structures'
ltSwings = input.string('◉', 'Swings', options = ['◉', '▲▼', 'LT(H/L)', 'Disabled'], inline = 'NA', group = ltGroup, display = display)
ltSwingsSZ  = input.string('Small', 'Size', options = ['Tiny', 'Small', 'Normal', 'Large'], inline = 'NA', group = ltGroup, display = display)
ltMarketStructures = input.bool(true, 'Market Structures', group = ltGroup)
ltMSSweepT = input.string('Enabled', '  Market Structure Validation', options = ['Enabled', 'Disabled'], group = ltGroup, display = display), ltMSSweep = ltMSSweepT == 'Enabled'
ltMSTextT = input.string('Enabled', '  Market Structure Labels', options = ['Enabled', 'Disabled'], group = ltGroup, display = display), ltMSText = ltMSTextT == 'Enabled'
ltMSLineStyle = input.string('Solid', '  Line Style', options = ['Solid', 'Dashed', 'Dotted'], group = ltGroup, inline = 'LN', display = display)
ltMSLineWidth = input.int(1, 'Width', minval = 1, group = ltGroup, inline = 'LN', display = display)
ltBullMSColor = input.color(#089981, 'Swing and Line Colors, Bullish', group = ltGroup, inline = 'MS')
ltBearMSColor = input.color(#f23645, 'Bearish', group = ltGroup, inline = 'MS')

//---------------------------------------------------------------------------------------------------------------------}
// User Defined Types
//---------------------------------------------------------------------------------------------------------------------{

type BAR
    float   open  = open
    float   high  = high
    float   low   = low
    float   close = close
    int     index = bar_index

type ICTMS
    float   lastPrice
    float   midPrice
    float   prevPrice

    int     lastIndex
    int     midIndex
    int     prevIndex

    label   lastLabel
    label   midLabel
    label   prevLabel

    bool    isCrossed
    bool    isConfirmed

    int     marketStructure

    line    msLine
    box     msLabel
    box     swpBox

type MS
    int type = 0


//---------------------------------------------------------------------------------------------------------------------}
// Generic Variables
//---------------------------------------------------------------------------------------------------------------------{

BAR bar = BAR.new()

//---------------------------------------------------------------------------------------------------------------------}
// Functions / Methods
//---------------------------------------------------------------------------------------------------------------------{

textSize(sizeInText) =>
    switch sizeInText
        'Tiny'   => size.tiny
        'Small'  => size.small
        'Normal' => size.normal
        => size.large

lineStyle(styleInText) =>
    switch styleInText
        'Solid'     => line.style_solid
        'Dotted'    => line.style_dotted
        'Dashed'    => line.style_dashed

queryPatterns(lastPrice, midPrice, prevPrice, isSwingHigh) =>
    if isSwingHigh
        prevPrice < midPrice and midPrice >= lastPrice
    else
        prevPrice > midPrice and midPrice <= lastPrice

method queryPatterns(ICTMS this, isSwingHigh) =>
    if isSwingHigh
        this.prevPrice < this.midPrice and this.midPrice >= this.lastPrice
    else
        this.prevPrice > this.midPrice and this.midPrice <= this.lastPrice

method updatePattern(ICTMS this, price, index) =>
    this.isCrossed := false
    this.prevPrice := this.midPrice, this.midPrice := this.lastPrice, this.lastPrice := price
    this.prevIndex := this.midIndex, this.midIndex := this.lastIndex, this.lastIndex := index
    this.prevLabel := this.midLabel, this.midLabel := this.lastLabel

method setType(MS this, value) =>
    this.type := value

method renderStructures(ICTMS this, isBullish, marketStructure, termText, color, style, width, labelEnabled) =>

    condition = isBullish ? bar.close > this.lastPrice : bar.close < this.lastPrice

    if condition and not this.isCrossed
        this.isCrossed := true
        this.isConfirmed := false
        this.msLine := line.new(this.lastIndex, this.lastPrice, bar.index, this.lastPrice, color = color, style = lineStyle(style), width = width)
        this.swpBox := box.new(bar.index, this.lastPrice, bar.index, this.lastPrice, color.new(color, 73), bgcolor = color.new(color, 73))

        if labelEnabled
            this.msLabel := box.new(this.lastIndex, this.lastPrice, bar.index, this.lastPrice, color(na), bgcolor = color(na),
             text = marketStructure.type == (isBullish ? -1 : 1) ? termText + '-CHoCH' : termText + '-BoS', text_size = size.tiny, text_halign = text.align_left, text_valign = isBullish ? text.align_bottom : text.align_top, text_color = color.new(color, 17))

        marketStructure.setType(isBullish ? 1 : -1)

method validateStructures(ICTMS this, isBullish, deviation, termText, labelEnabled) =>
    if (bar.close > (this.lastPrice + deviation) or bar.close < (this.lastPrice - deviation)) and not this.isConfirmed // and this.isCrossed
        this.isConfirmed := true
        this.swpBox.set_right(bar.index)
        if isBullish
            if bar.close < (this.lastPrice - deviation) and labelEnabled
                this.msLabel.set_text(termText + '-SWEEP')
        else
            if bar.close > (this.lastPrice + deviation) and labelEnabled
                this.msLabel.set_text(termText + '-SWEEP')
    else
        if isBullish
            if bar.close > (this.lastPrice - deviation) and bar.close < (this.lastPrice + deviation) and this.isCrossed and not this.isConfirmed // bar.close > this.lastPrice and
                this.swpBox.set_right(bar.index), this.swpBox.set_top(math.max(math.min(bar.high, this.lastPrice + deviation), this.swpBox.get_top()))
        else
            if bar.close > (this.lastPrice - deviation) and bar.close < (this.lastPrice + deviation) and this.isCrossed and not this.isConfirmed // bar.close < this.lastPrice and
                this.swpBox.set_rightbottom(bar.index, math.min(math.max(bar.low, this.lastPrice - deviation), this.swpBox.get_bottom()))
            //else if not this.isConfirmed
            //    this.swpBox.set_right(bar.index)

//---------------------------------------------------------------------------------------------------------------------}
// Calculations - ICT Short Term Market Structures
//---------------------------------------------------------------------------------------------------------------------{

sweepATR = ta.atr(17)

var ICTMS stLow  = ICTMS.new()
var ICTMS stHigh = ICTMS.new()
var MS stMS = MS.new()

if queryPatterns(bar.low, bar.low[1], bar.low[2], false)
    stLow.updatePattern(bar.low[1], bar.index[1])
    TX = stSwings == '⦁' ? '⦁' : stLow.midPrice > stLow.lastPrice ? 'ST-LL' : 'ST-LH'
    stLow.lastLabel := label.new(stLow.lastIndex, stLow.lastPrice, TX, color = color(na), textcolor = stSwings != 'Disabled' ? stBearMSColor : color(na), style = label.style_label_up, size = textSize(stSwingsSZ))

if queryPatterns(bar.high, bar.high[1], bar.high[2], true)
    stHigh.updatePattern(bar.high[1], bar.index[1])
    TX = stSwings == '⦁' ? '⦁' : stHigh.midPrice > stHigh.lastPrice ? 'ST-HL' : 'ST-HH'
    stHigh.lastLabel := label.new(bar.index[1], bar.high[1], TX, color = color(na), textcolor = stSwings != 'Disabled' ? stBullMSColor : color(na), style = label.style_label_down, size = textSize(stSwingsSZ))

if stMarketStructures
    stLow.renderStructures(false, stMS, 'ST', stBearMSColor, stMSLineStyle, stMSLineWidth, stMSText)
    stHigh.renderStructures(true, stMS, 'ST', stBullMSColor, stMSLineStyle, stMSLineWidth, stMSText)

if stMSSweep
    stLow.validateStructures(false, sweepATR, 'STL', stMSText)
    stHigh.validateStructures(true, sweepATR, 'STH', stMSText)

//---------------------------------------------------------------------------------------------------------------------}
// Calculations - ICT Intermediate Term Market Structures
//---------------------------------------------------------------------------------------------------------------------{

var ICTMS itLow  = ICTMS.new()
var ICTMS itHigh = ICTMS.new()
var MS itMS = MS.new()

cITL = stLow.queryPatterns(false)

if cITL and cITL != cITL[1]
    itLow.updatePattern(stLow.midPrice, stLow.midIndex)

    itLow.lastLabel := stLow.midLabel

    if itSwings != 'Disabled'
        TX = itSwings == '△▽' ? '△' : itSwings == '◈' ? '◈' : itLow.lastPrice > itLow.midPrice ? 'IT-LH' : 'IT-LL'
        stLow.midLabel.set_text(TX)
        stLow.midLabel.set_size(textSize(itSwingsSZ))
        stLow.midLabel.set_textcolor(itBearMSColor)

cITH = stHigh.queryPatterns(true)

if cITH and cITH != cITH[1]
    itHigh.updatePattern(stHigh.midPrice, stHigh.midIndex)

    itHigh.lastLabel := stHigh.midLabel

    if itSwings != 'Disabled'
        TX = itSwings == '△▽' ? '▽' : itSwings == '◈' ? '◈' : itHigh.lastPrice > itHigh.midPrice ? 'IT-HH' : 'IT-HL'
        stHigh.midLabel.set_text(TX)
        stHigh.midLabel.set_size(textSize(itSwingsSZ))
        stHigh.midLabel.set_textcolor(itBullMSColor)

if itMarketStructures
    itLow.renderStructures(false, itMS, 'IT', itBearMSColor, itMSLineStyle, itMSLineWidth, itMSText)
    itHigh.renderStructures(true, itMS, 'IT', itBullMSColor, itMSLineStyle, itMSLineWidth, itMSText)

if itMSSweep
    itLow.validateStructures(false, sweepATR, 'ITL', itMSText)
    itHigh.validateStructures(true, sweepATR, 'ITH', itMSText)

//---------------------------------------------------------------------------------------------------------------------}
// Calculations - ICT Long Term Market Structures
//---------------------------------------------------------------------------------------------------------------------{

var ICTMS ltLow  = ICTMS.new()
var ICTMS ltHigh = ICTMS.new()
var MS ltMS = MS.new()

cLTL = itLow.queryPatterns(false)

if cLTL and cLTL != cLTL[1]
    ltLow.isCrossed := false

    TX = ltSwings == '▲▼' ? '▲' : ltSwings == '◉' ? '◉' : ltLow.lastPrice > itLow.midPrice ? 'LT-LL' : 'LT-LH'

    ltLow.lastPrice := itLow.midPrice
    ltLow.lastIndex := itLow.midIndex

    if ltSwings != 'Disabled'
        itLow.midLabel.set_text(TX)
        itLow.midLabel.set_size(textSize(ltSwingsSZ))
        itLow.midLabel.set_textcolor(ltBearMSColor)

cLTH = itHigh.queryPatterns(true)

if cLTH and cLTH != cLTH[1]
    ltHigh.isCrossed := false

    TX = ltSwings == '▲▼' ? '▼' : ltSwings == '◉' ? '◉' : ltHigh.lastPrice > itHigh.midPrice ? 'LT-HL' : 'LT-HH'

    ltHigh.lastPrice := itHigh.midPrice
    ltHigh.lastIndex := itHigh.midIndex

    if ltSwings != 'Disabled'
        itHigh.midLabel.set_text(TX)
        itHigh.midLabel.set_size(textSize(ltSwingsSZ))
        itHigh.midLabel.set_textcolor(ltBullMSColor)

if ltMarketStructures
    ltLow.renderStructures(false, ltMS, 'LT', ltBearMSColor, ltMSLineStyle, ltMSLineWidth, ltMSText)
    ltHigh.renderStructures(true, ltMS, 'LT', ltBullMSColor, ltMSLineStyle, ltMSLineWidth, ltMSText)

if ltMSSweep
    ltLow.validateStructures(false, sweepATR, 'LTL', ltMSText)
    ltHigh.validateStructures(true, sweepATR, 'LTH', ltMSText)

//---------------------------------------------------------------------------------------------------------------------}
Other Indicators
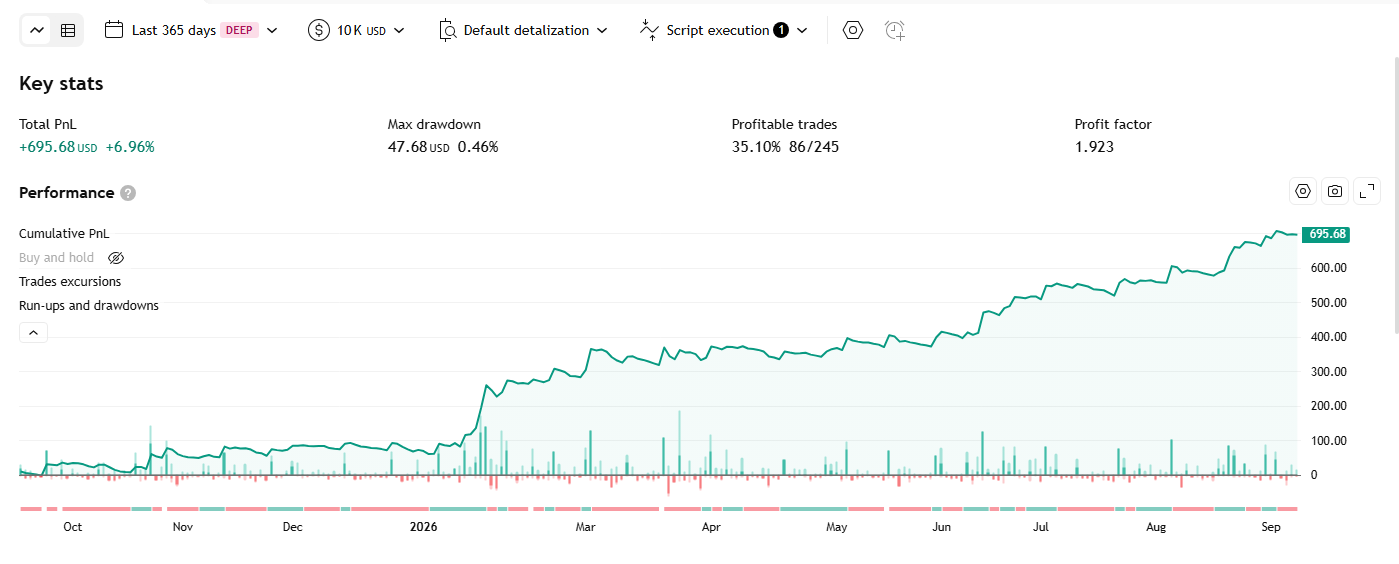
TP RSI Indicator – Strategy
An extended RSI: an adaptive neutral zone based on the RSI’s own volatility, a 5-layer EMA ribbon drawn on top of RSI itself, a Regular/Hidden divergence detector, and a second, fully independent Bollinger Bands overlay for visual reference.
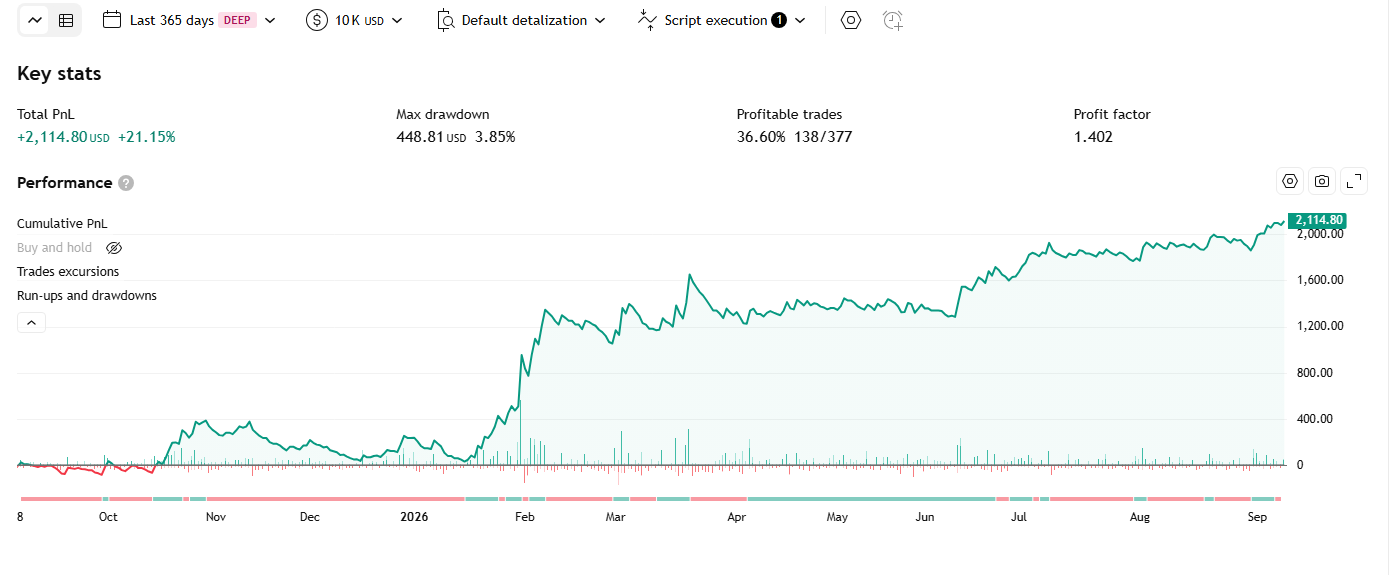
ICT Anchored Market Structures with Validation Indicator – Strategy
An ICT (Inner Circle Trader) indicator that tracks market structure across 3 nested tiers (Short/Intermediate/Long Term), identifies BoS/CHoCH at each tier, and automatically detects false breakouts (liquidity sweeps) before accepting a genuine structure break.
Trend Duration Forecast Indicator – Strategy
Determines trend direction from the slope of a Hull Moving Average (HMA), measures each trend’s actual duration, stores a rolling history of durations per direction, then uses that historical average to “forecast” how much longer the current trend might run.