1. Indicator Description — Ideal SMC – Clean Pro
All-in-one SMC toolkit: Order Block, FVG, Liquidity Pools, BOS, HTF, Trend Filter & Setups. Clean, tidy, and clear.
1.1 Indicator Concept
The indicator follows Smart Money Concepts (SMC): price moves because of supply–demand imbalances and the hunt for liquidity. From there, we focus on four key pillars:
- Order Block (OB): institutional order zones; price often retests them before continuing.
- Fair Value Gap (FVG): a 3-candle void showing imbalance; price tends to fill it over time.
- Liquidity Pools (EQH/EQL): clusters of equal highs/lows that collect liquidity.
- Break of Structure (BOS): bullish/bearish structure break that confirms short-term trend change.
The indicator turns these ideas into clear tradable zones and setup signals, with Trend Filter, HTF (Higher Timeframe), TTL, Merge, etc., so your chart stays clean and actionable, not cluttered.
1.2 Indicator Features
- Automatic Order Block detection (bullish/bearish) with ATR filter, zone merging (Merge), mitigation flag (Mitigated), lifetime limit (TTL), and control to keep extending to the live bar (extendToLive) or stop after boxWidthBars.
- Automatic FVG detection (bull/bear) with ATR-based minimum size, mitigation tracking & TTL similar to OB.
- Liquidity Pools (EQH/EQL):
- Tolerance by ATR (useATRTol, tolATRmult) or by ticks (tolTicks).
- BOS plotted directly with arrows (Up/Down) to confirm structure shifts.
- Multi-Timeframe (useHTF, htfTf): draw stronger zones using higher timeframe data (e.g., H4/Daily).
- Trend Filter: only show zones in the current trend direction (useTrendFilter, obInTrendOnly, fvgInTrendOnly).
- Trade Setups “OB Retest + Trend”:
- Auto-draw Entry / SL / TP, allow signals only on bar close (onlyConfirmed), and set targets by R:R (rrTarget).
- Optional icons, labels, and lines (showIcons/showLabels/showLines).
- Display optimization: limit active zones (maxOBKeep, maxFVGKeep), and extend zones only while unmitigated (extendOnlyUnmitigated).
1.3 How to Use
- Set your bias: check BOS + HTF zones to decide long vs. short priority.
- Be patient: wait for price to return to an unmitigated OB/FVG in the Trend Filter direction.
- Entry: take the indicator’s “OB Retest + Trend” signal. Entry is typically the zone midpoint; SL is the opposite boundary.
- Risk management: set TP by rrTarget (default 2R). You can trail SL based on structure.
- Tune to your style:
Scalplower pivotLen, smaller boxWidthBars, shorter ttl, smaller minOBatr/minFVGatr. Intradaybalance sensitivity and cleanliness; combine with useHTF = H1/H4. Swingraise pivotLen, use HTF D/W, longer ttl, wider zones.
1.4 How the Indicator Works
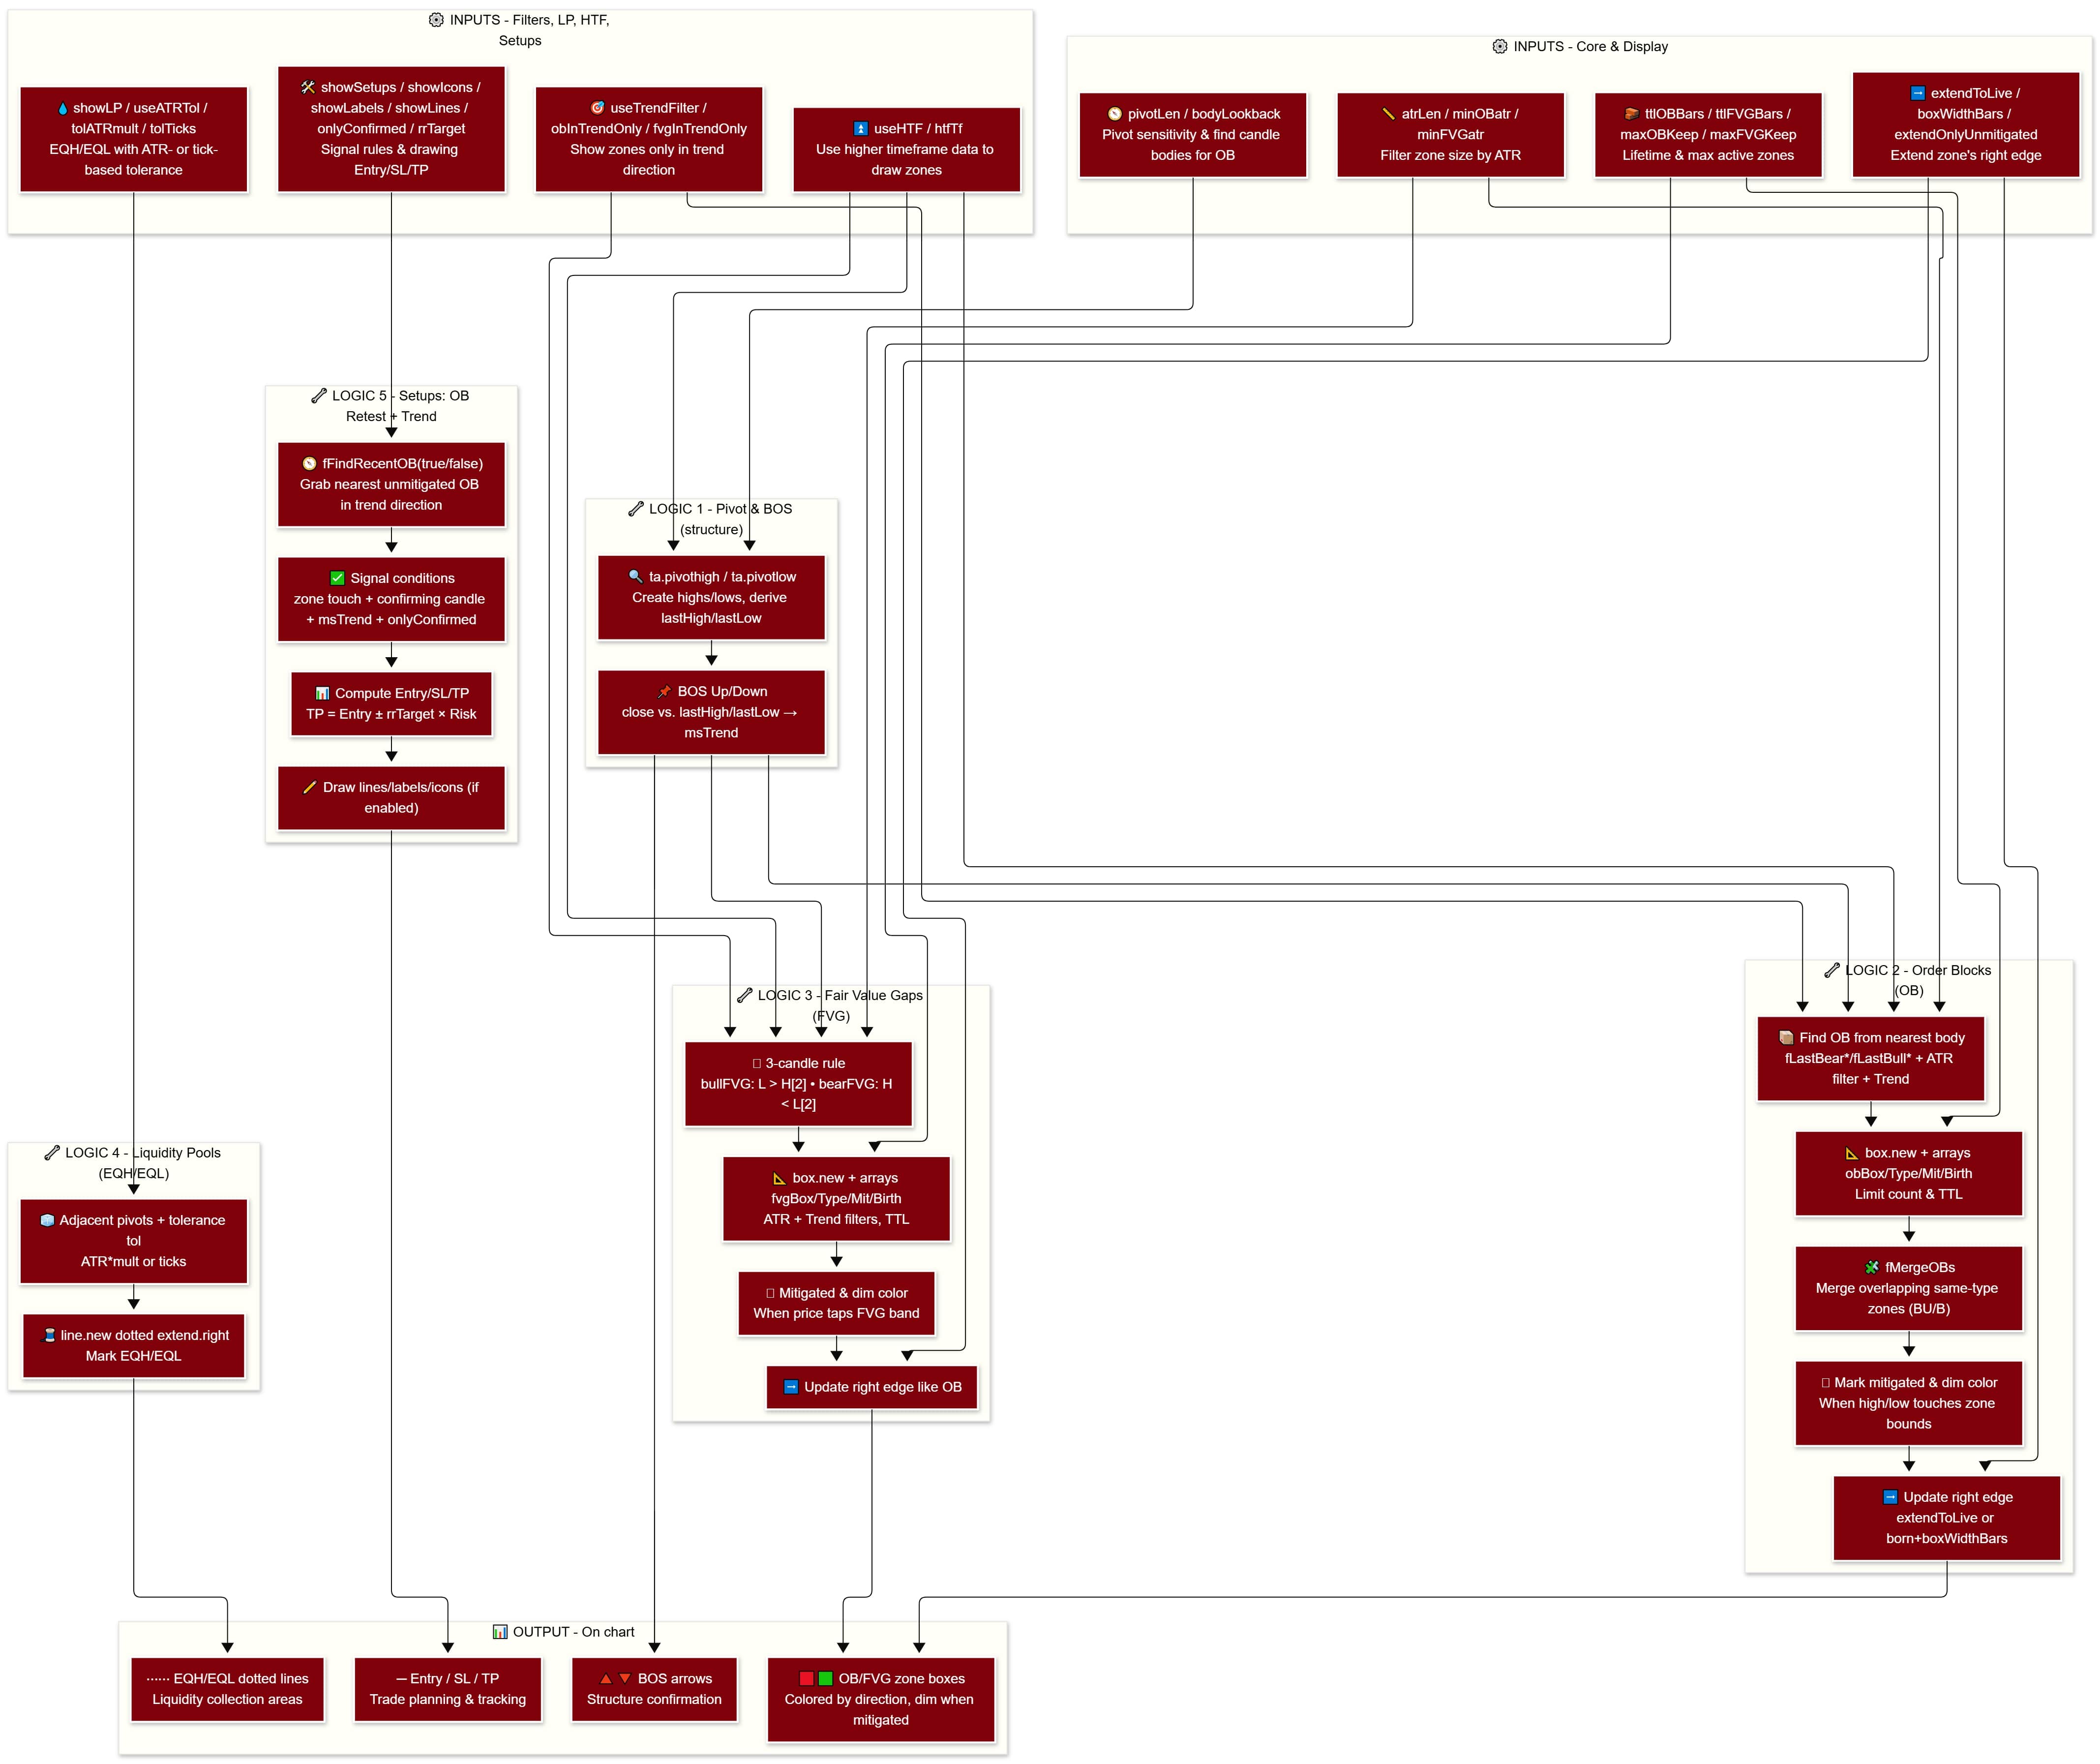
Inputs & roles
- Core: pivotLen (swing length), bodyLookback (scan candle bodies for OB), atrLen (ATR), minOBatr, minFVGatr (minimum thresholds).
- Display: ttlOBBars, ttlFVGBars, maxOBKeep, maxFVGKeep, extendOnlyUnmitigated, extendToLive, boxWidthBars.
- Liquidity Pools: showLP, useATRTol, tolATRmult, tolTicks.
- Filters: useTrendFilter, obInTrendOnly, fvgInTrendOnly.
- HTF: useHTF, htfTf (e.g., “240” = H4).
- Setups: showSetups, showIcons, showLabels, showLines, onlyConfirmed, rrTarget.
Main logic blocks
- Pivot & BOS detection: use ta.pivothigh / ta.pivotlow on srcH/srcL (HTF if enabled), then set bosUp/bosDown when breaking the nearest high/low.
- Order Block:
- Find the most recent bearish/bullish body (functions fLastBearBody*/fLastBullBody*) as OB bounds; filter by ATR & trend (allowBull/allowBear).
- Create box, store arrays (obBox, obType, obMit, obBirth); limit count & TTL; Merge overlapping same-type zones (fMergeOBs).
- Mark as “mitigated” when high/low intersects the zone; dim the color.
- FVG:
- 3-candle conditions: bullFVG if srcL > srcH[2]; bearFVG if srcH < srcL[2]; with ATR & trend filters.
- Create box, track mitigation, TTL, and control the right edge like OB.
- Liquidity Pools: detect EQH/EQL by comparing nearby pivots within tolerance tol (ATR-based or ticks), draw dotted lines extended to the right.
- Setups:
- Find the nearest unmitigated OB in the trend direction (fFindRecentOB), check price retest and candle confirmation.
- Compute Entry (mid-zone), SL (opposite edge), TP = Entry ± rrTarget × Risk; draw lines/labels if enabled.
Outputs & how they are used
- Zone boxes (OB/FVG) colored by direction; mitigated zones fade to reduce noise.
- LP lines (EQH/EQL) as dotted guides to areas prone to liquidity grabs.
- BOS arrows to confirm short-term bias.
- Entry/SL/TP lines plus icons/labels (if enabled) for planning and tracking trades.


Use the analysis above + the code below to instruct AI to modify the indicator and turn it into a trading bot—no coding required!
How to do it here -> 👉ZERO2HERO👈
					//@version=5
indicator("Ideal SMC – Clean Pro (Trend, Merge, TTL, HTF, Compact + Setups) [Stable + Floating Boxes]", overlay=true, max_boxes_count=500, max_labels_count=500, max_lines_count=500)

//================ Inputs ================
pivotLen        = input.int(6,  "Swing Length (pivot detection)", minval=2, group="Core")
bodyLookback    = input.int(20, "Body Lookback (OB search)",      minval=3, group="Core")
atrLen          = input.int(14, "ATR Length", minval=5, group="Core")
minOBatr        = input.float(0.80, "Min OB Size (x ATR)", step=0.05, group="Core")
minFVGatr       = input.float(0.35, "Min FVG Size (x ATR)", step=0.05, group="Core")

ttlOBBars   = input.int(300, "OB TTL (Bars; 0 = unlimited)", minval=0, group="Display")
ttlFVGBars  = input.int(300, "FVG TTL (Bars; 0 = unlimited)", minval=0, group="Display")
maxOBKeep   = input.int(12,  "Max active OBs", minval=1, maxval=200, group="Display")
maxFVGKeep  = input.int(8,   "Max active FVGs", minval=1, maxval=200, group="Display")
extendOnlyUnmitigated = input.bool(true, "Extend boxes only while unmitigated", group="Display")

// >>> Neu: Steuerung, ob Zonen bis zur Live-Kerze verlängern <<<
extendToLive   = input.bool(true, title="Extend zones to live bar", group="Display")
boxWidthBars   = input.int(80,    title="Max box width (bars) when not extended", minval=5, group="Display")

showLP      = input.bool(true, "Show Liquidity Pools (EQH/EQL)", group="LP")
useATRTol   = input.bool(true, "LP tolerance uses ATR (else ticks)", group="LP")
tolATRmult  = input.float(0.05, "LP tolerance ATR multiplier", step=0.01, group="LP")
tolTicks    = input.int(3, "LP tolerance ticks", minval=1, group="LP")

useTrendFilter = input.bool(true, "Filter: show zones only in trend direction", group="Filters")
obInTrendOnly  = input.bool(true, "Filter OBs by trend", group="Filters")
fvgInTrendOnly = input.bool(true, "Filter FVGs by trend", group="Filters")

useHTF     = input.bool(false, "Use HTF data for zones", group="HTF")
htfTf      = input.timeframe("240", "HTF timeframe", group="HTF")

// Setups
showSetups    = input.bool(true,  "Show Setups (OB Retest + Trend)", group="Setups")
showIcons     = input.bool(true,  "Setups: show icons",              group="Setups")
showLabels    = input.bool(false, "Setups: show labels (text)",      group="Setups")
showLines     = input.bool(true,  "Setups: draw Entry/SL/TP lines",  group="Setups")
onlyConfirmed = input.bool(true,  "Only on confirmed bar close",     group="Setups")
rrTarget      = input.float(2.0,  "TP Risk Reward (R multiple)", minval=1.0, step=0.5, group="Setups")

//================ Colors ================
color colBU  = color.new(color.lime,   80)
color colB   = color.new(color.red,    80)
color colFU  = color.new(color.teal,   80)
color colFD  = color.new(color.orange, 80)
color colEQH = color.new(color.fuchsia, 0)
color colEQL = color.new(color.aqua,    0)

//================ Core Series (typed) ================
float atrVal = ta.atr(atrLen)
float tick   = syminfo.mintick
float tol    = useATRTol and not na(atrVal) ? atrVal * tolATRmult : tick * tolTicks

float htfHigh  = request.security(syminfo.tickerid, htfTf, high,  barmerge.gaps_off, barmerge.lookahead_off)
float htfLow   = request.security(syminfo.tickerid, htfTf, low,   barmerge.gaps_off, barmerge.lookahead_off)
float htfClose = request.security(syminfo.tickerid, htfTf, close, barmerge.gaps_off, barmerge.lookahead_off)

float srcH = useHTF ? htfHigh  : high
float srcL = useHTF ? htfLow   : low
float srcC = useHTF ? htfClose : close

float ph = ta.pivothigh(srcH, pivotLen, pivotLen)
float pl = ta.pivotlow(srcL,  pivotLen, pivotLen)

var float lastHigh = na
var float lastLow  = na
if not na(ph)
    lastHigh := srcH[pivotLen]
if not na(pl)
    lastLow  := srcL[pivotLen]

bool bosUp   = not na(lastHigh) and srcC > lastHigh
bool bosDown = not na(lastLow)  and srcC < lastLow

var string msTrend = "none"
if bosUp
    msTrend := "up"
if bosDown
    msTrend := "down"

//================ Containers ================
var box[]    obBox    = array.new_box()
var string[] obType   = array.new_string()  // "BU"/"B"
var bool[]   obMit    = array.new_bool()
var int[]    obBirth  = array.new_int()

var box[]    fvgBox   = array.new_box()
var string[] fvgType  = array.new_string()  // "FU"/"FD"
var bool[]   fvgMit   = array.new_bool()
var int[]    fvgBirth = array.new_int()

//================ Helpers ================
fLastBearBodyLo() =>
    float lo = na
    for k = 1 to bodyLookback
        if close[k] < open[k]
            lo := math.min(open[k], close[k])
            break
    lo

fLastBearBodyHi() =>
    float hi = na
    for k = 1 to bodyLookback
        if close[k] < open[k]
            hi := math.max(open[k], close[k])
            break
    hi

fLastBullBodyLo() =>
    float lo = na
    for k = 1 to bodyLookback
        if close[k] > open[k]
            lo := math.min(open[k], close[k])
            break
    lo

fLastBullBodyHi() =>
    float hi = na
    for k = 1 to bodyLookback
        if close[k] > open[k]
            hi := math.max(open[k], close[k])
            break
    hi

fMergeOBs() =>
    int n = array.size(obBox)
    if n > 1
        for i = n - 1 to 1
            string ti = array.get(obType, i)
            box bi = array.get(obBox, i)
            float itop = box.get_top(bi)
            float ibot = box.get_bottom(bi)
            for k = i - 1 to 0
                string tk = array.get(obType, k)
                if tk == ti
                    box bk = array.get(obBox, k)
                    float ktop = box.get_top(bk)
                    float kbot = box.get_bottom(bk)
                    bool overlap = not (ibot > ktop or itop < kbot)
                    if overlap
                        float ntop = math.max(itop, ktop)
                        float nbot = math.min(ibot, kbot)
                        box.set_top(bk, ntop)
                        box.set_bottom(bk, nbot)
                        box.delete(bi)
                        array.remove(obBox, i)
                        array.remove(obType, i)
                        array.remove(obMit, i)
                        array.remove(obBirth, i)
                        break

//================ OB Logic ================
bool allowBull = not useTrendFilter or msTrend == "up"
bool allowBear = not useTrendFilter or msTrend == "down"

if bosUp and allowBull and not na(atrVal)
    float loB = fLastBearBodyLo()
    float hiB = fLastBearBodyHi()
    if not na(loB) and not na(hiB) and (hiB - loB) >= atrVal * minOBatr
        box b = box.new(bar_index, hiB, bar_index, loB, bgcolor=colBU)
        array.push(obBox, b)
        array.push(obType, "BU")
        array.push(obMit, false)
        array.push(obBirth, bar_index)
        while array.size(obBox) > maxOBKeep
            box old = array.shift(obBox)
            box.delete(old)
            array.shift(obType)
            array.shift(obMit)
            array.shift(obBirth)

if bosDown and allowBear and not na(atrVal)
    float loS = fLastBullBodyLo()
    float hiS = fLastBullBodyHi()
    if not na(loS) and not na(hiS) and (hiS - loS) >= atrVal * minOBatr
        box b2 = box.new(bar_index, hiS, bar_index, loS, bgcolor=colB)
        array.push(obBox, b2)
        array.push(obType, "B")
        array.push(obMit, false)
        array.push(obBirth, bar_index)
        while array.size(obBox) > maxOBKeep
            box old2 = array.shift(obBox)
            box.delete(old2)
            array.shift(obType)
            array.shift(obMit)
            array.shift(obBirth)

// OB maintain (Guards + floating right edge)
int nOb = array.size(obBox)
if nOb > 0
    for i = nOb - 1 to 0
        box bb  = array.get(obBox, i)
        float top = box.get_top(bb)
        float bot = box.get_bottom(bb)
        bool m = array.get(obMit, i)
        if not m and not na(top) and not na(bot) and high >= bot and low <= top
            array.set(obMit, i, true)
            color dimCol = array.get(obType, i) == "BU" ? color.new(color.lime, 90) : color.new(color.red, 90)
            box.set_bgcolor(bb, dimCol)
        // >>> HIER: rechte Kante abhängig von extendToLive / boxWidthBars <<<
        int bornX = array.get(obBirth, i)
        int rightX = extendToLive ? bar_index : bornX + boxWidthBars
        if extendOnlyUnmitigated ? not array.get(obMit, i) : true
            box.set_right(bb, rightX)

    if ttlOBBars > 0
        int n2 = array.size(obBox)
        if n2 > 0
            for i = n2 - 1 to 0
                int born = array.get(obBirth, i)
                if bar_index - born > ttlOBBars
                    box.delete(array.get(obBox, i))
                    array.remove(obBox, i)
                    array.remove(obType, i)
                    array.remove(obMit, i)
                    array.remove(obBirth, i)

fMergeOBs()

//================ FVG Logic ================
if bar_index >= 2 and not na(atrVal)
    bool bullFVG = srcL > srcH[2]
    if bullFVG and (not fvgInTrendOnly or allowBull)
        float topFU = srcL
        float botFU = srcH[2]
        if (topFU - botFU) >= atrVal * minFVGatr
            box bxU = box.new(bar_index, topFU, bar_index, botFU, bgcolor=colFU)
            array.push(fvgBox, bxU)
            array.push(fvgType, "FU")
            array.push(fvgMit, false)
            array.push(fvgBirth, bar_index)
            while array.size(fvgBox) > maxFVGKeep
                box ofu = array.shift(fvgBox)
                box.delete(ofu)
                array.shift(fvgType)
                array.shift(fvgMit)
                array.shift(fvgBirth)

    bool bearFVG = srcH < srcL[2]
    if bearFVG and (not fvgInTrendOnly or allowBear)
        float topFD = srcH
        float botFD = srcL[2]
        if (botFD - topFD) >= atrVal * minFVGatr
            box bxD = box.new(bar_index, topFD, bar_index, botFD, bgcolor=colFD)
            array.push(fvgBox, bxD)
            array.push(fvgType, "FD")
            array.push(fvgMit, false)
            array.push(fvgBirth, bar_index)
            while array.size(fvgBox) > maxFVGKeep
                box ofd = array.shift(fvgBox)
                box.delete(ofd)
                array.shift(fvgType)
                array.shift(fvgMit)
                array.shift(fvgBirth)

// FVG maintain (floating right edge)
int nF = array.size(fvgBox)
if nF > 0
    for i = nF - 1 to 0
        box fb = array.get(fvgBox, i)
        float ftop = box.get_top(fb)
        float fbot = box.get_bottom(fb)
        bool fm = array.get(fvgMit, i)
        if not fm and not na(ftop) and not na(fbot) and high >= fbot and low <= ftop
            array.set(fvgMit, i, true)
            color dim = array.get(fvgType, i) == "FU" ? color.new(color.teal, 90) : color.new(color.orange, 90)
            box.set_bgcolor(fb, dim)
        // >>> HIER: rechte Kante abhängig von extendToLive / boxWidthBars <<<
        int bornXF  = array.get(fvgBirth, i)
        int rightXF = extendToLive ? bar_index : bornXF + boxWidthBars
        if extendOnlyUnmitigated ? not array.get(fvgMit, i) : true
            box.set_right(fb, rightXF)

    if ttlFVGBars > 0
        int nF2 = array.size(fvgBox)
        if nF2 > 0
            for i = nF2 - 1 to 0
                int bornF = array.get(fvgBirth, i)
                if bar_index - bornF > ttlFVGBars
                    box.delete(array.get(fvgBox, i))
                    array.remove(fvgBox, i)
                    array.remove(fvgType, i)
                    array.remove(fvgMit, i)
                    array.remove(fvgBirth, i)

//================ LPs ================
if showLP
    float phL = ta.pivothigh(high, pivotLen, pivotLen)
    float plL = ta.pivotlow(low,  pivotLen, pivotLen)
    if not na(phL) and not na(phL[1]) and math.abs(phL - phL[1]) <= tol
        line.new(bar_index, phL, bar_index, phL, extend=extend.right, color=colEQH, style=line.style_dotted)
    if not na(plL) and not na(plL[1]) and math.abs(plL - plL[1]) <= tol
        line.new(bar_index, plL, bar_index, plL, extend=extend.right, color=colEQL, style=line.style_dotted)

//================ BOS arrows ================
plotshape(bosUp,   "BOS Up",   location=location.abovebar, style=shape.triangleup,   color=color.lime, size=size.tiny)
plotshape(bosDown, "BOS Down", location=location.belowbar, style=shape.triangledown, color=color.red,  size=size.tiny)

//================ Helper: find recent OB ================
fFindRecentOB(isBull) =>
    bool found = false
    float top = na
    float bot = na
    int n = array.size(obBox)
    if n > 0
        string want = isBull ? "BU" : "B"
        for i = n - 1 to 0
            if array.get(obType, i) == want and not array.get(obMit, i)
                box b = array.get(obBox, i)
                top := box.get_top(b)
                bot := box.get_bottom(b)
                found := true
                break
    [found, top, bot]

//================ Setups (OB Retest + Trend) ================
var float longEntry = na
var float longSL = na
var float longTP = na
var float riskL = na
var float shortEntry = na
var float shortSL = na
var float shortTP = na
var float riskS = na
var bool  longSigSeries = false
var bool  shortSigSeries = false

bool okBar = true
bool fL = false
bool fS = false
float topL = na
float botL = na
float topS = na
float botS = na
bool longSigTmp = false
bool shortSigTmp = false

if showSetups
    okBar := onlyConfirmed ? barstate.isconfirmed : true

    [fL, topL, botL] = fFindRecentOB(true)
    longSigTmp := fL and not na(topL) and not na(botL) and high >= botL and low <= topL and close > open and msTrend == "up" and okBar
    if longSigTmp
        longEntry := (topL + botL) / 2.0
        longSL    := botL
        riskL     := longEntry - longSL
        longTP    := longEntry + rrTarget * riskL
        longSigSeries := true
        if showLines
            line.new(bar_index, longEntry, bar_index + 20, longEntry, extend=extend.none, color=color.lime)
            line.new(bar_index, longSL,    bar_index + 20, longSL,    extend=extend.none, color=color.red)
            line.new(bar_index, longTP,    bar_index + 20, longTP,    extend=extend.none, color=color.teal)
    else
        longSigSeries := false

    [fS, topS, botS] = fFindRecentOB(false)
    shortSigTmp := fS and not na(topS) and not na(botS) and high >= botS and low <= topS and close < open and msTrend == "down" and okBar
    if shortSigTmp
        shortEntry := (topS + botS) / 2.0
        shortSL    := topS
        riskS      := shortSL - shortEntry
        shortTP    := shortEntry - rrTarget * riskS
        shortSigSeries := true
        if showLines
            line.new(bar_index, shortEntry, bar_index + 20, shortEntry, extend=extend.none, color=color.red)
            line.new(bar_index, shortSL,    bar_index + 20, shortSL,    extend=extend.none, color=color.lime)
            line.new(bar_index, shortTP,    bar_index + 20, shortTP,    extend=extend.none, color=color.orange)
    else
        shortSigSeries := false

// Icons/Labels
plotshape(showSetups and showIcons and longSigSeries,  "Long Setup",  style=shape.diamond, size=size.tiny, color=color.lime, location=location.belowbar)
plotshape(showSetups and showIcons and shortSigSeries, "Short Setup", style=shape.diamond, size=size.tiny, color=color.red,  location=location.abovebar)
if showSetups and showLabels and longSigSeries
    label.new(bar_index, close, "Long: OB Retest + Trend\nE:"+str.tostring(longEntry)+"  SL:"+str.tostring(longSL)+"  TP:"+str.tostring(longTP),
              style=label.style_label_up, color=color.new(color.lime, 70), textcolor=color.black)
if showSetups and showLabels and shortSigSeries
    label.new(bar_index, close, "Short: OB Retest + Trend\nE:"+str.tostring(shortEntry)+"  SL:"+str.tostring(shortSL)+"  TP:"+str.tostring(shortTP),
              style=label.style_label_down, color=color.new(color.red, 70), textcolor=color.white)
Indicator Insider
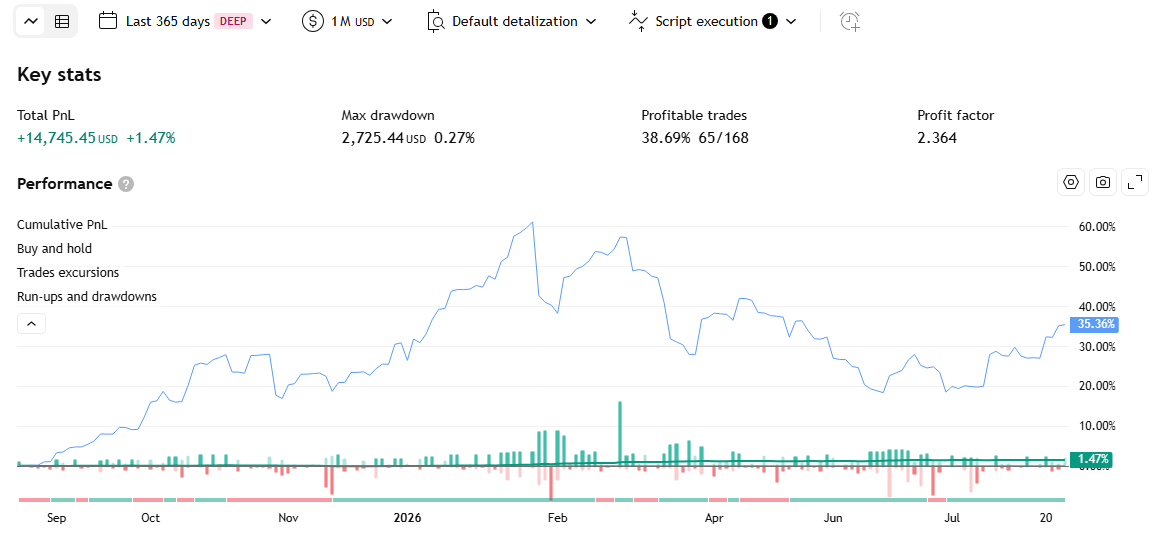
HTF Candle Profile Indicator – Strategy
An indicator that builds a Volume Profile chart for exactly one higher-timeframe (HTF) candle currently forming, based on the volume of the current-timeframe bars falling inside it, then projects the whole analysis as a visual diagram right next to the chart.
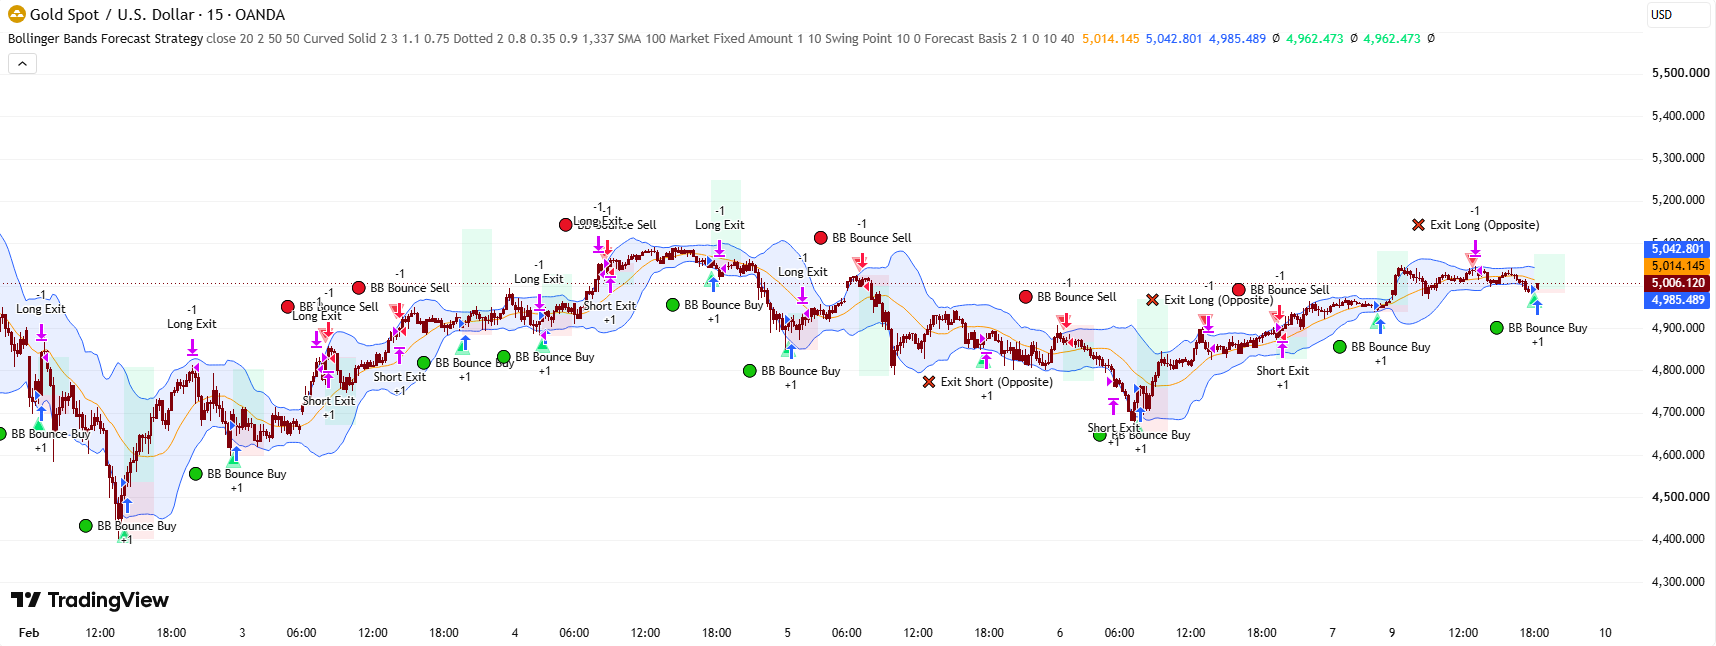
Bollinger Bands Regression Forecast Indicator– Strategy
Traditional Bollinger Bands combined with a projected “forecast cone” — linearly extrapolating the trend of the middle line and the band width, showing what the bands might look like in the future.
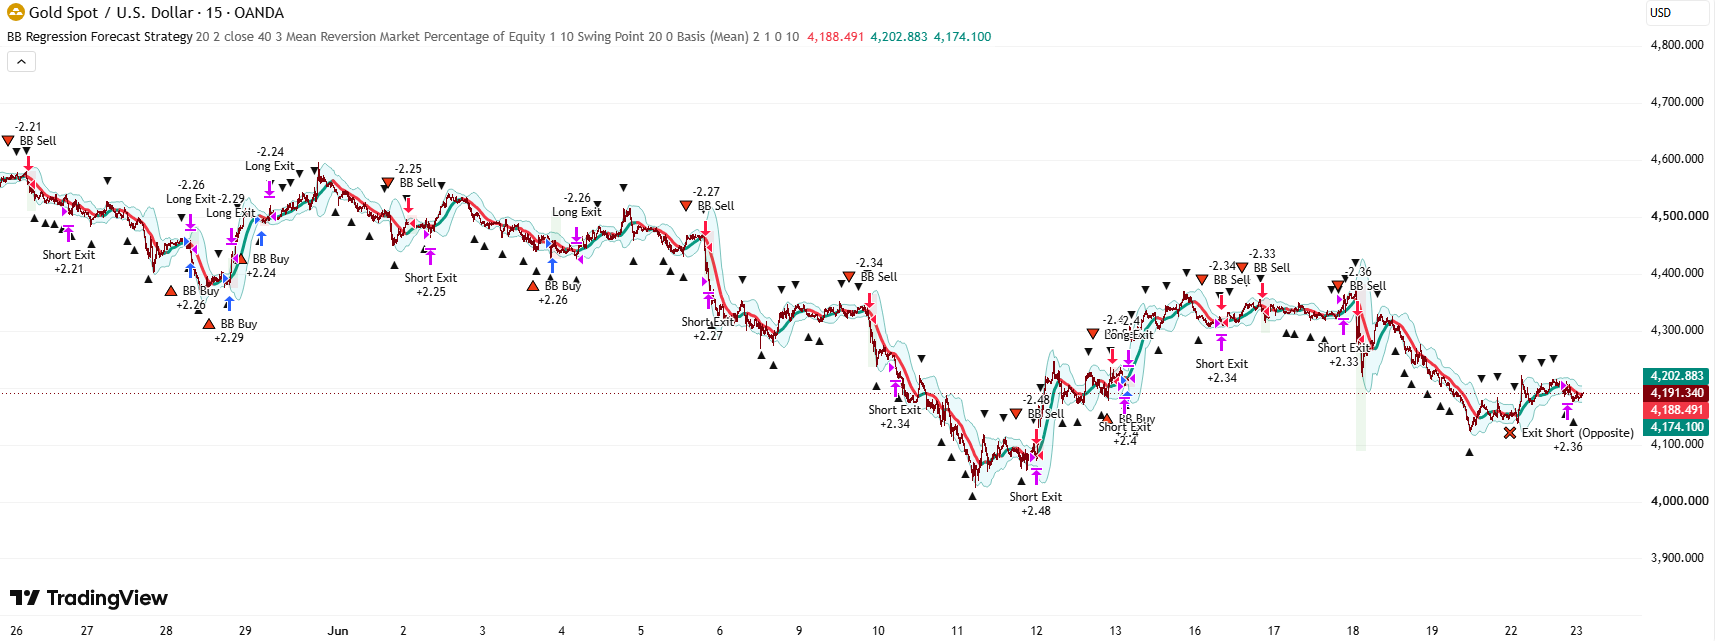
Bollinger Bands Forecast with Signals Indicator – Strategy
Standard Bollinger Bands plus a forward-extrapolated “forecast cone”, an illustrative zigzag+random-walk price path threading through that cone, and an independent mean-reversion signal engine that fires when price gets rejected at the upper/lower band.