1. Wolfe Waves Indicator Description [BigBeluga]
Automatic detection tool for the Wolfe Waves reversal pattern — built on market cycle and geometry theory
1.1 Indicator Concept
The Wolfe Waves indicator is based on the theory developed by Bill Wolfe in the 1980s–1990s. He was a trader who focused on market geometry and the natural rhythm cycles of price.
Core idea: Price doesn’t move randomly; it forms symmetrical wave structures that reflect the equilibrium between supply and demand. When price reaches an equilibrium point, a sharp trend reversal may occur.
The Wolfe Waves pattern consists of 5 key pivot points (high–low–high–low–high, or the inverse), creating a geometric structure with self-balancing properties. When these 5 points appear and satisfy the geometric rules, the indicator projects:
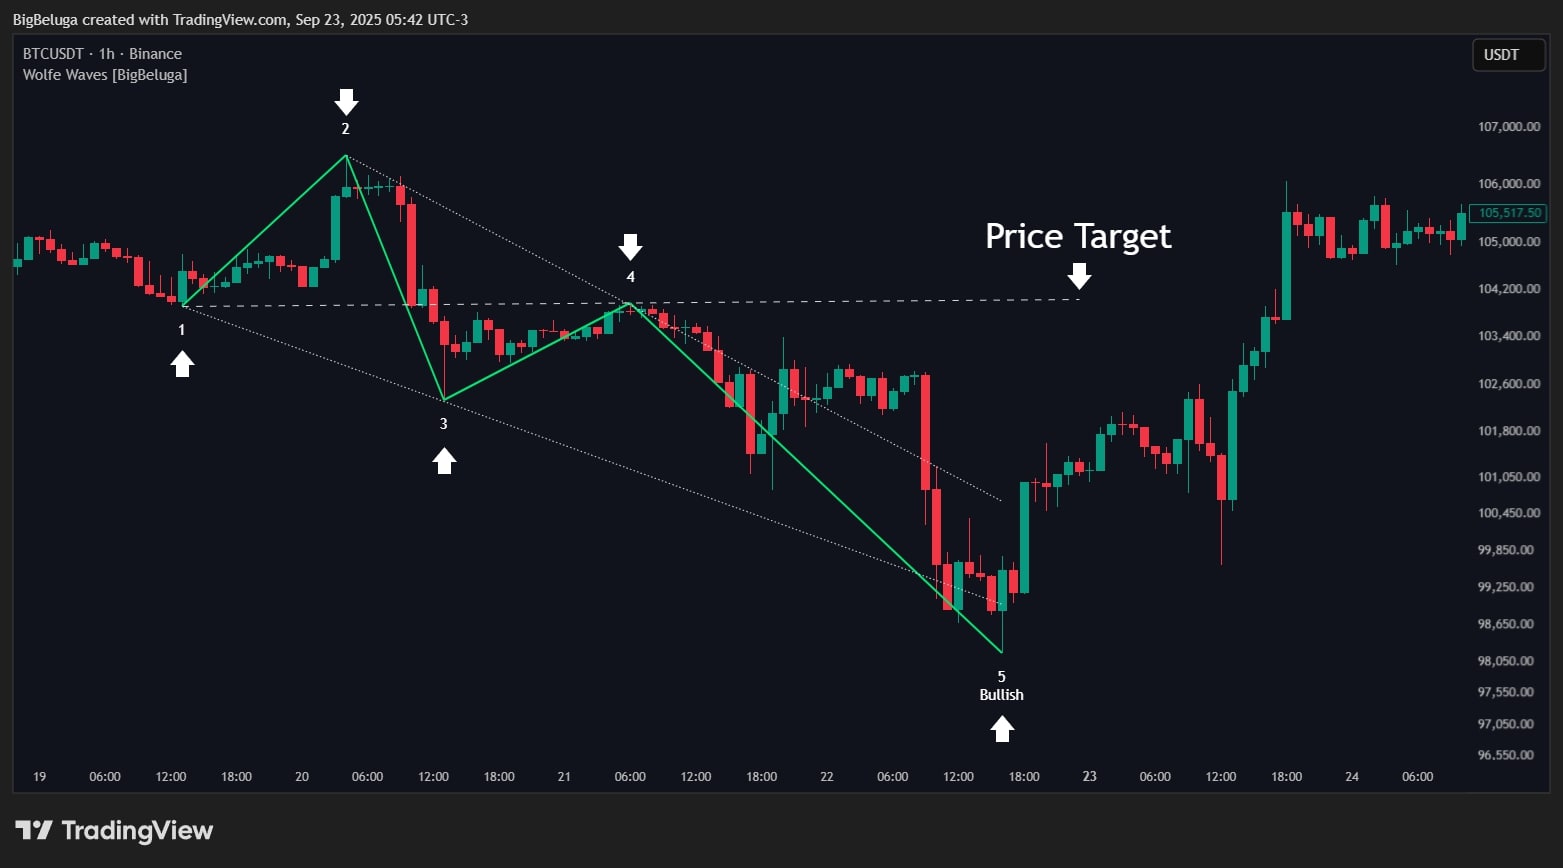
- Bullish Wolfe Wave: price is compressing downward and is likely to bounce strongly from point 5
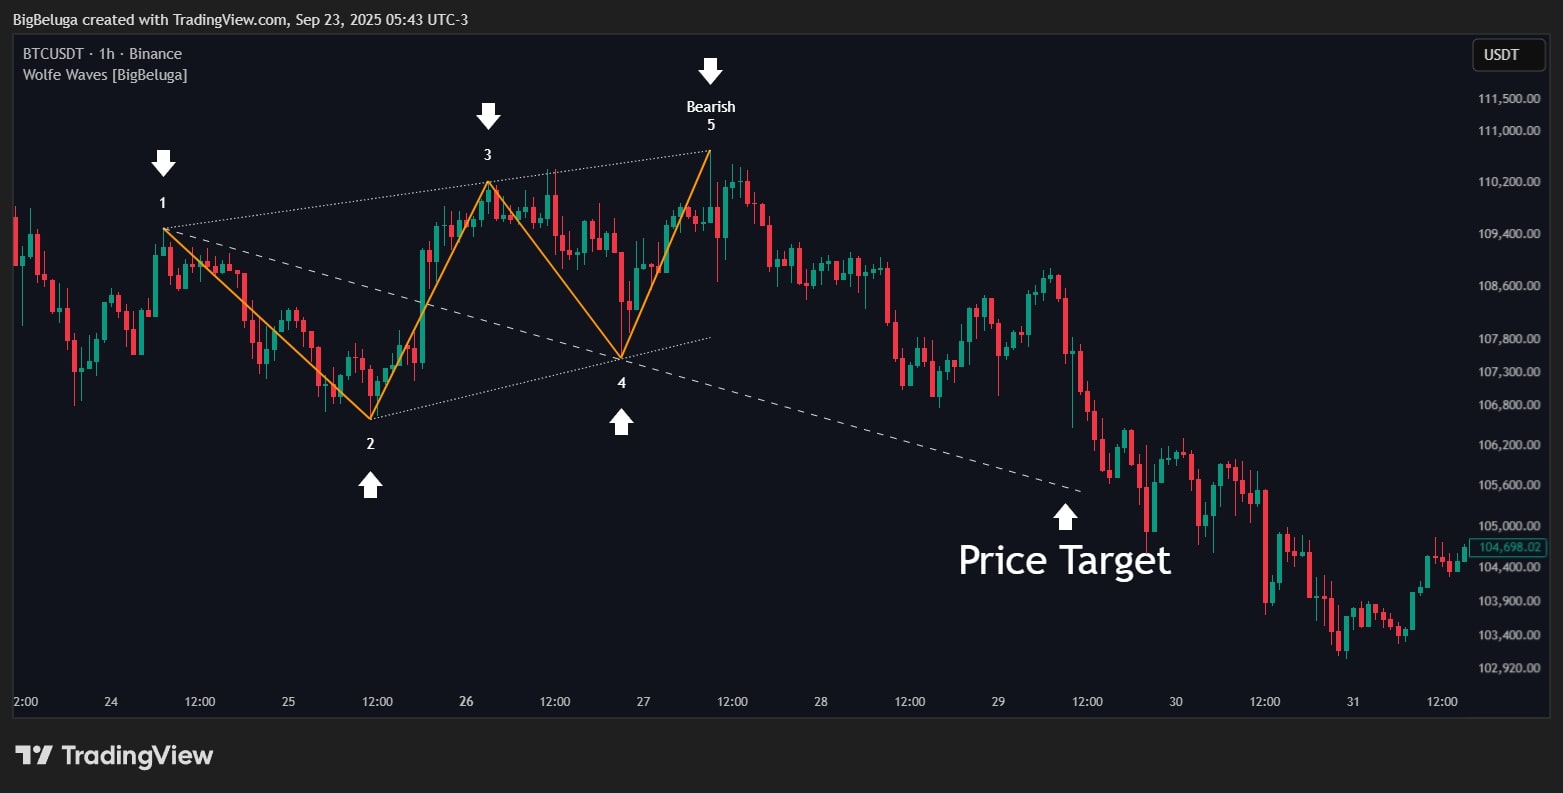
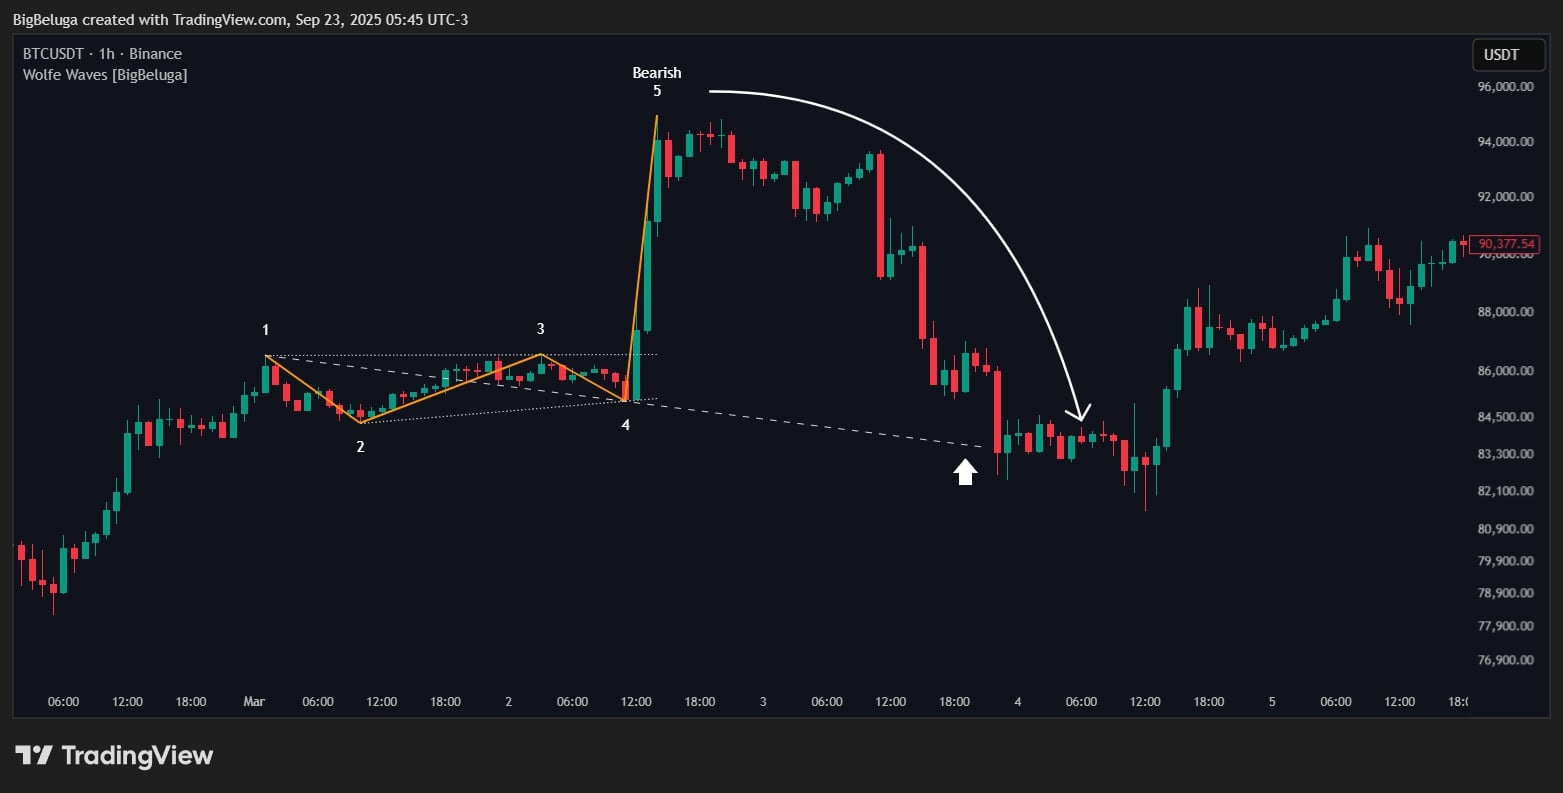
- Bearish Wolfe Wave: price is stretching upward and is likely to fall sharply from point 5
1.2 Indicator Features
On-chart components:
-
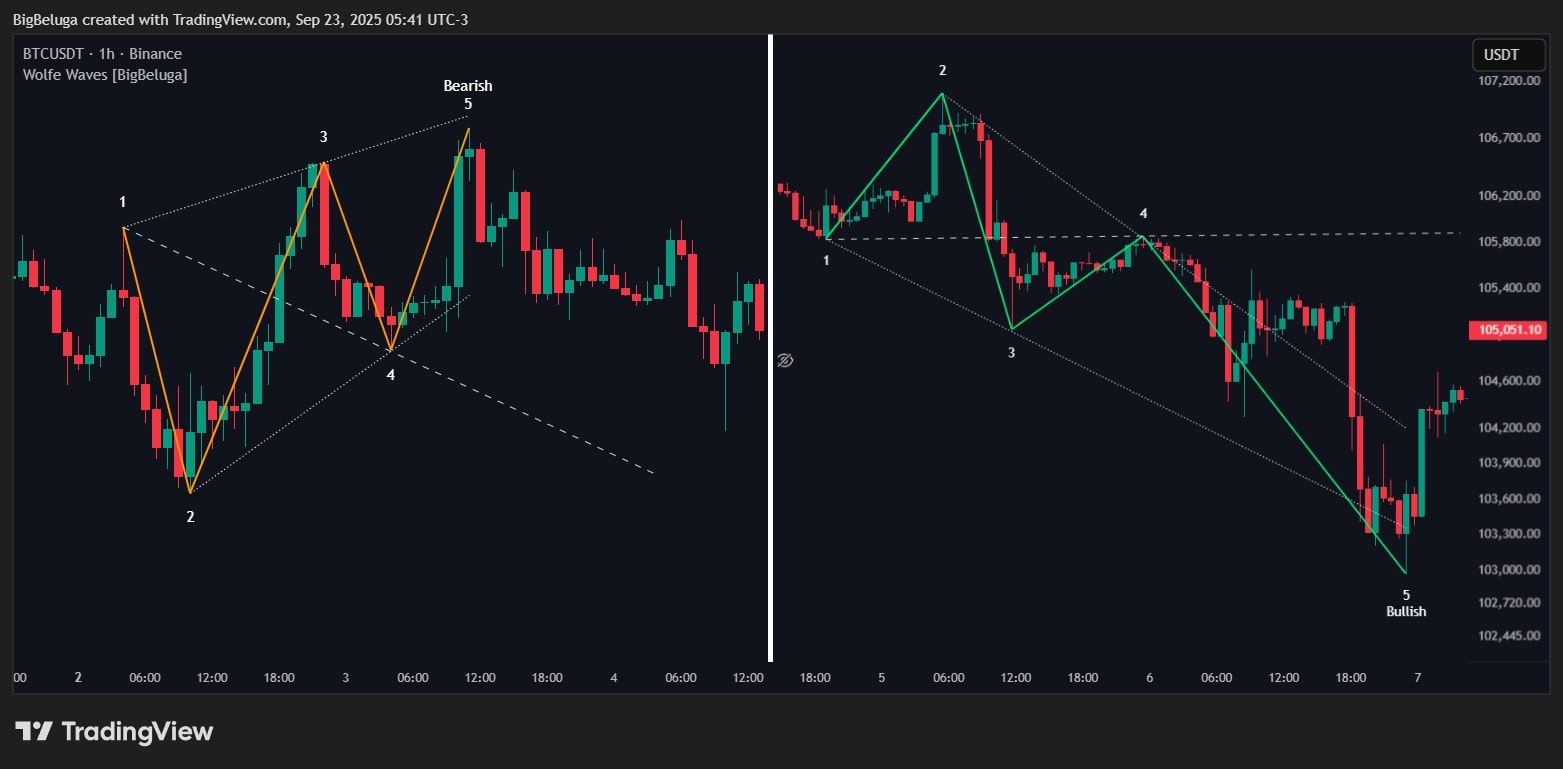
Numeric labels 1 to 5: mark the 5 pivots (highs/lows) forming the Wolfe Wave. Label 5 includes “Bullish” or “Bearish” to denote the wave type.
Role: helps traders recognize the structure and key locations. -
Four solid lines: connect points 1–2, 2–3, 3–4, 4–5 (green for Bullish, orange for Bearish).
Role: draws the Wolfe shape so the pattern is visually clear. -
Dashed line: extended from point 1 through point 4 to project the target zone (EPA – Expected Price Arrival).
Role: indicates take-profit (TP) when price reacts from point 5. -
Two dotted lines: extended from points 1–3 and 2–4 to aid geometric assessment.
Role: provide extra information about slope and symmetry. -
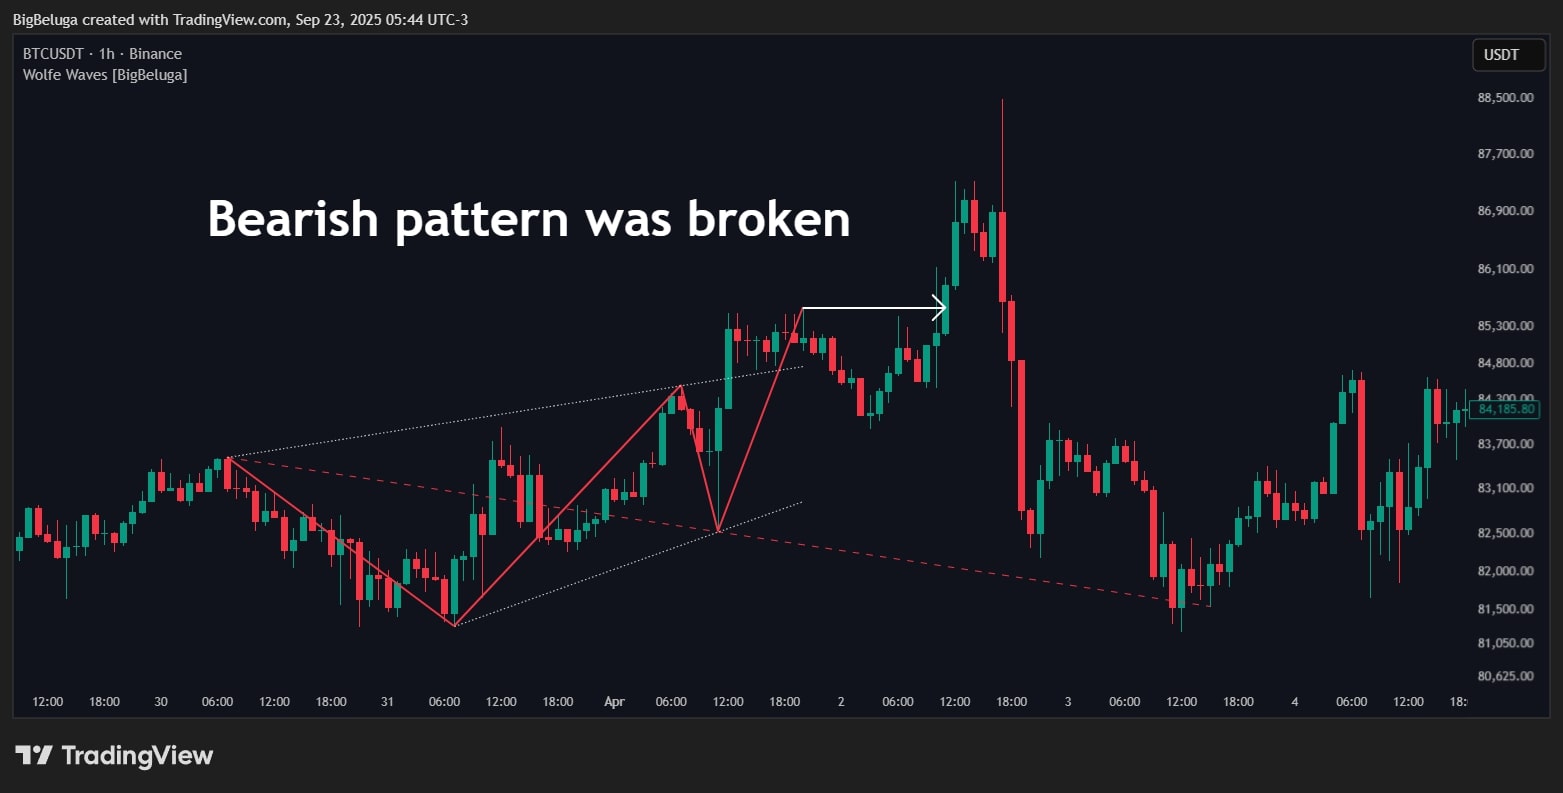
All lines turn red: when the pattern is “invalidated” (price moves against expectations).
Role: instant warning that the setup failed; exit or avoid entries.
Alerts:
- The indicator automatically detects when 5 pivots complete according to the geometry rules → a new pattern appears on the chart.
- When the pattern is invalidated (price breaks the opposite way) → lines turn red → visual alert.
- Note: The code does not include a built-in alert() function, but you can add alerts based on the appearance of label 5 or the red color state.
1.3 How to Use the Indicator
- Select Bullish or Bearish mode: depending on the direction you want to trade. Choose “Bullish” for long setups; choose “Bearish” for short setups.
- Wait for all 5 pivots: the indicator will automatically label 1 through 5 when a valid Wolfe structure is found.
-
Enter near point 5:
- For a Bullish Wave: wait for price to touch or approach point 5 (the 5th low) → place a BUY, targeting the EPA (dashed line).
- For a Bearish Wave: wait for price to touch or approach point 5 (the 5th high) → place a SELL, targeting the EPA.
- Set take-profit (TP): at the dashed EPA line — the projected equilibrium area.
- Set stop loss (SL): beyond point 5 by a safe margin. For Bullish, SL below point 5; for Bearish, SL above point 5.
- Monitor line colors: if lines turn red → pattern failed → cut loss or do not enter.
- Combine with other tools: add momentum indicators, volume, or higher-timeframe analysis to increase confidence.
→ Place a BUY at $100.5, SL at $98, TP at $110.
If price rallies as expected → take profit at $110.
If price drops below $98 and lines turn red → stop out.
1.4 How the Indicator Works
Inputs & roles:
-
sensetivity (default 10): pivot detection sensitivity. Lower values = more sensitive, more pivots (more noise). Higher values = slower, only major pivots.
Role: controls pattern frequency — crucial for signal filtering. -
isbull: choose “Bullish” or “Bearish” — determines which wave type is searched.
Role: aligns with your trading bias. -
bearCol and bullcol: display colors for each wave type (orange for Bearish, green for Bullish).
Role: quick visual identification on chart. -
Price data (OHLC): high, low, close of each candle.
Role: raw inputs for pivot calculations and invalidation checks.
Main logic blocks:
-
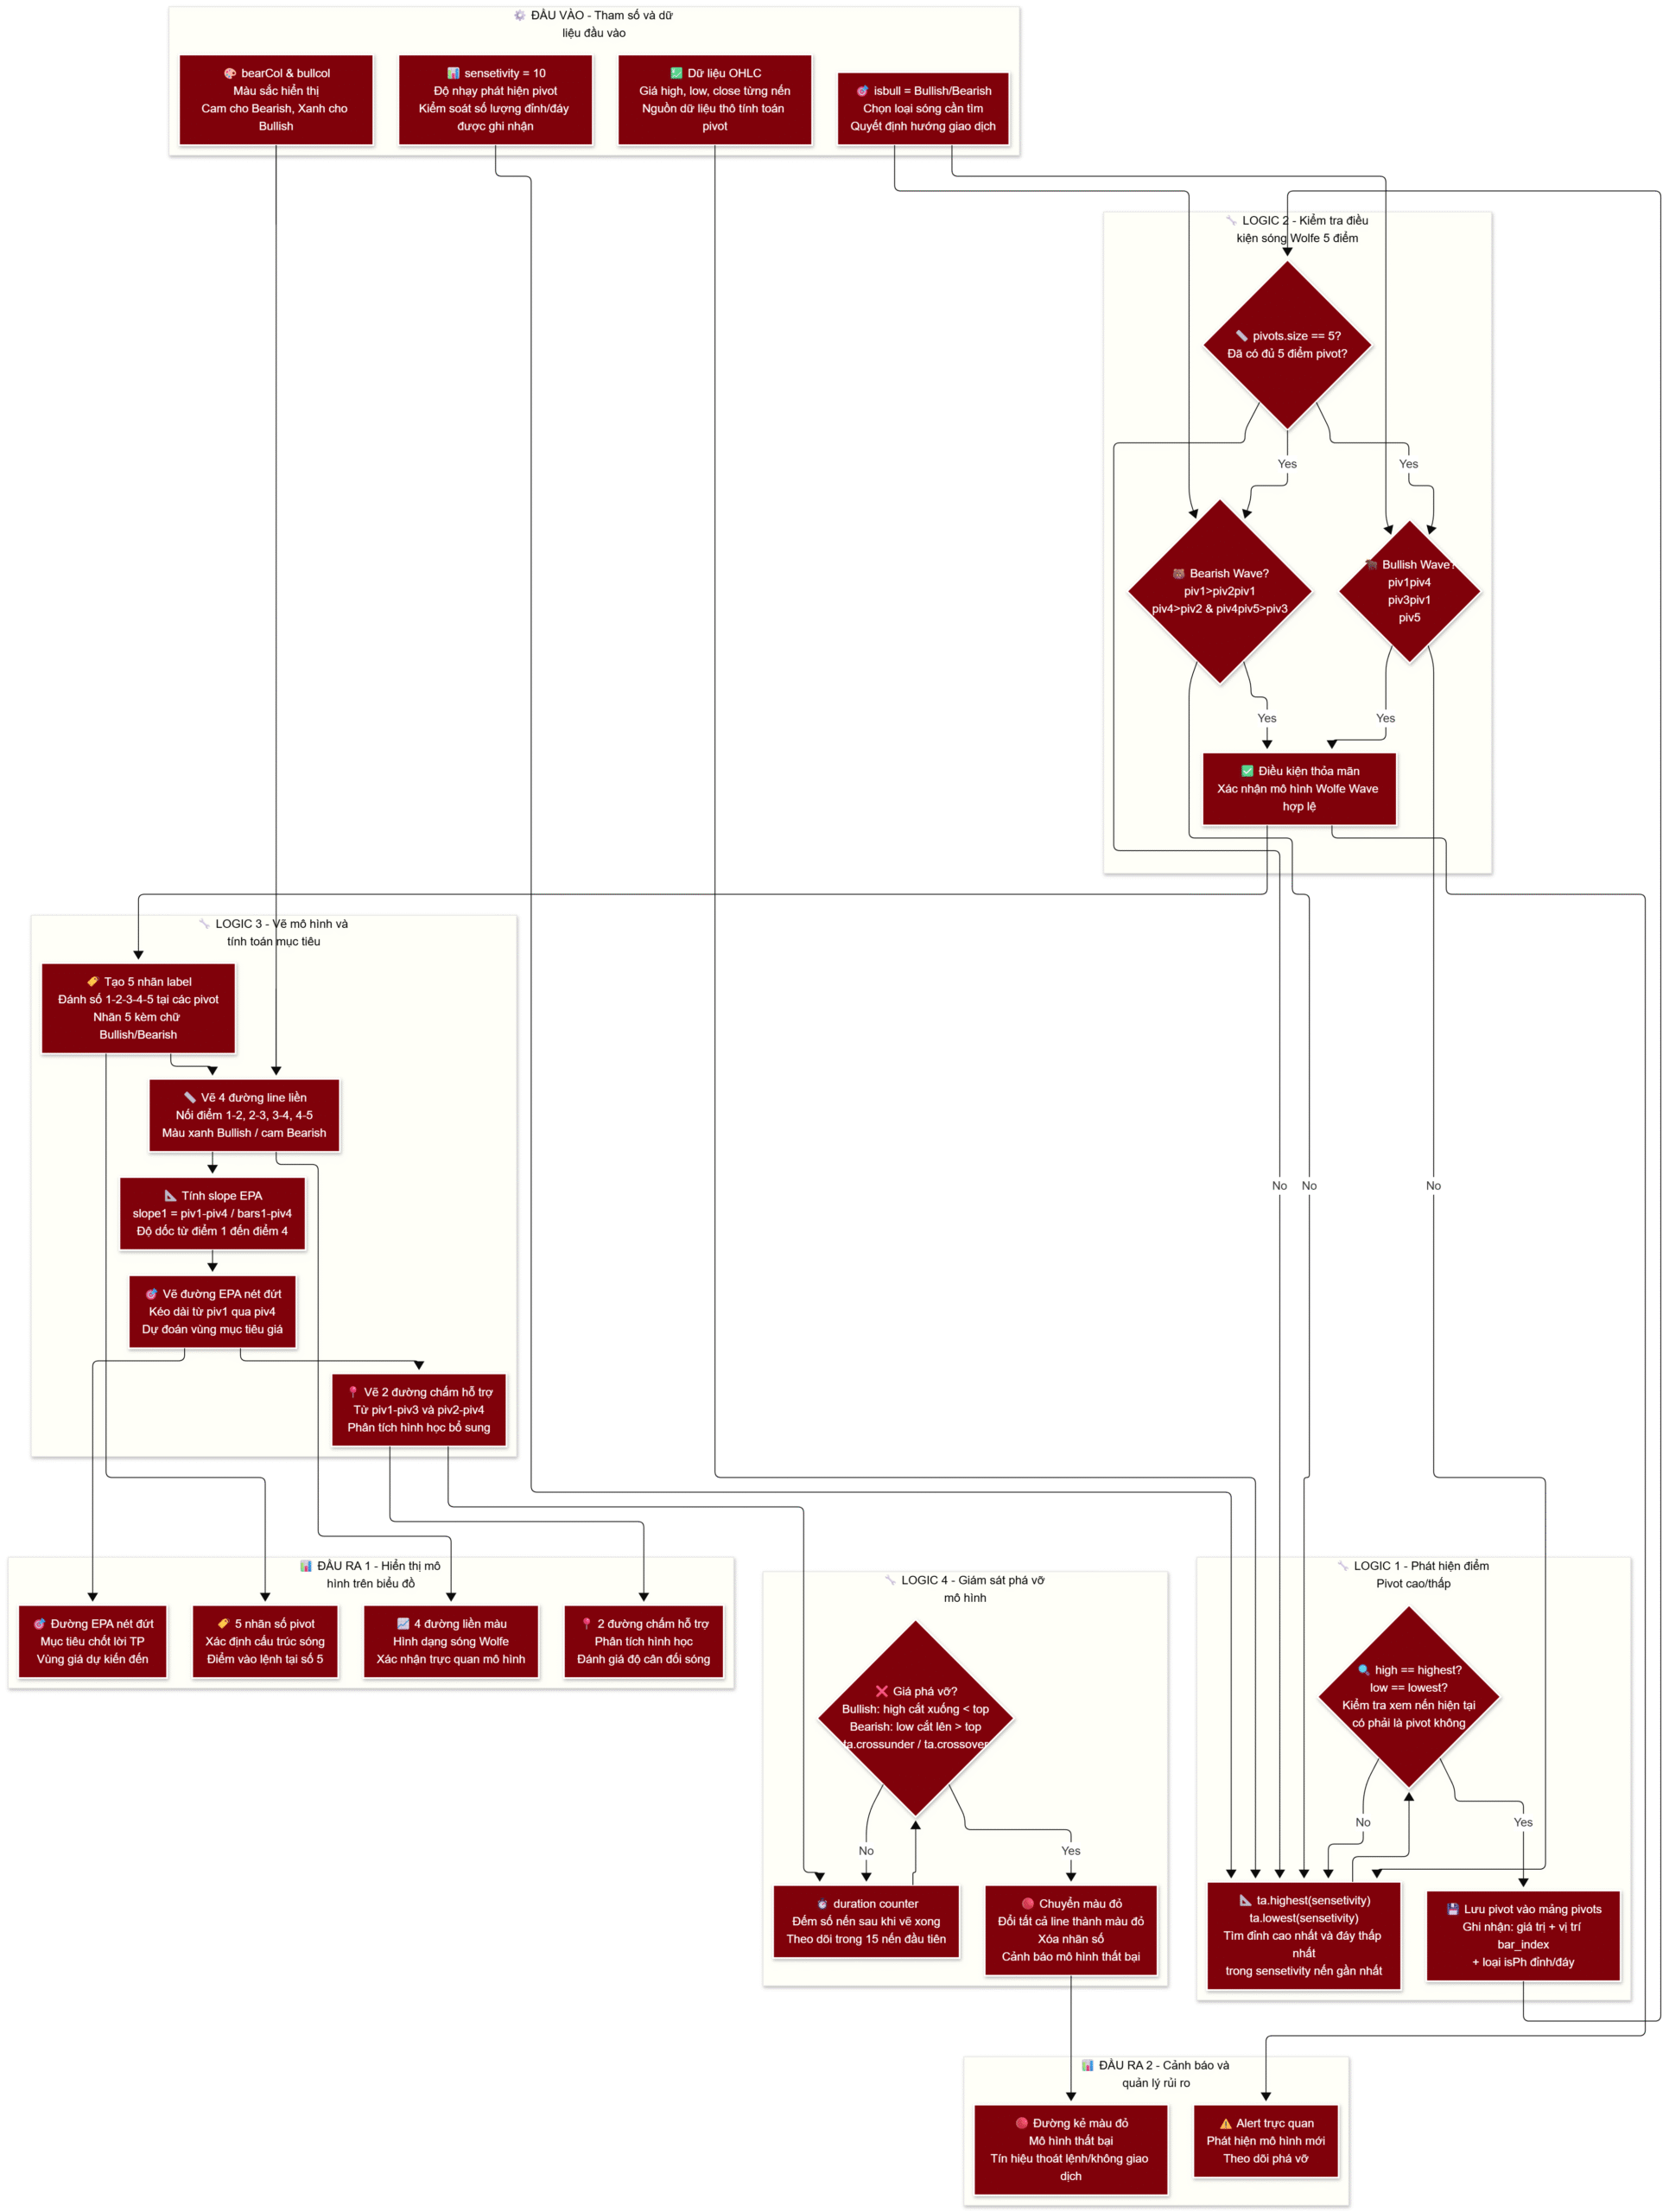
Block 1 – Pivot (high/low) detection:
Use ta.highest(len) and ta.lowest(len) to find the highest high and lowest low within the last len candles.
When a new high/low is detected, store its bar index and value in the pivots array.
Role: identifies turning points — the foundation of Wolfe waves. -
Block 2 – Wolfe wave validation:
When the pivots array holds 5 points, check if they satisfy the geometry rules:- Bearish Wave: piv1 > piv2 < piv3 > piv1 and piv4 > piv2 and piv4 < piv1 and piv5 > piv3
- Bullish Wave: piv1 < piv2 > piv4 and piv3 < piv1 and piv4 > piv1 and piv5 < piv3
Role: filters random pivot structures, retaining only true Wolfe patterns. -
Block 3 – Drawing & projection:
If conditions hold, the indicator:- Plots 5 numeric labels at pivot points
- Draws 4 solid lines connecting 1–2–3–4–5
- Computes the slope between points 1 and 4, extends it as the EPA (dashed) line
- Adds two auxiliary dotted lines (1–3 and 2–4)
Role: visualizes the pattern and provides clear price targets. -
Block 4 – Pattern invalidation:
After plotting, the indicator tracks price over the next 15 candles:- For a Bullish Wave: if the high crosses under point 5 (ta.crossunder(high, top)) → invalidation
- For a Bearish Wave: if the low crosses above point 5 (ta.crossover(low, top)) → invalidation
- On invalidation → all lines turn red, labels are removed
Role: warns of failure, aiding risk management.
Outputs mapped to display & usage:
- Five numeric labels: show the 5 pivot locations → help identify structure and the entry (point 5).
- Four solid lines: draw the Wolfe shape → visual confirmation of the forming pattern.
- EPA (dashed) line: target projection → place take-profit (TP).
- Two dotted lines: geometric aids → improve confidence when assessing symmetry.
- Red color state: failure warning → exit or avoid trading.
Inputs:
- Last 100 candles: high = [102, 105, 103, 108, 107, ..., 95], low = [98, 100, 99, 104, 103, ..., 90]
- sensetivity = 10
- isbull = true (search Bullish Wave)
Processing logic:
1. Scan every 10 candles, detect highs/lows: found piv1 = 98, piv2 = 105, piv3 = 96, piv4 = 103, piv5 = 90
2. Check Bullish conditions: 98 < 105 ✅, 105 > 103 ✅, 96 < 98 ✅, 103 > 98 ✅, 90 < 96 ✅ → Valid!
3. Compute slope from piv1 (98) to piv4 (103): slope = (103−98) / (bars between)
4. Extend as EPA line → project move toward 105–108
Displayed outputs:
- Plot labels “1” at 98, “2” at 105, “3” at 96, “4” at 103, “5 Bullish” at 90
- Draw four green lines connecting 1–2–3–4–5
- Draw a dashed line from piv1 through piv4, pointing to 105–108
- If price rises from 90 to 106 → take profit
- If price falls below 90 (high < 90) → lines turn red → stop out
- The indicator only plots after all 5 pivots complete, so there is lag. Avoid premature entries.
- Wolfe Waves are not 100% accurate. Always use a stop loss.
- Combine with volume, RSI, MACD, or multi-timeframe analysis to improve win rate.

Use the analysis above + the code below to instruct AI to modify the indicator and turn it into a trading bot—no coding required!
How to do it here -> 👉ZERO2HERO👈
					// This work is licensed under Creative Commons Attribution-NonCommercial-ShareAlike 4.0 International
// https://creativecommons.org/licenses/by-nc-sa/4.0/
// © BigBeluga


//@version=6
indicator("Wolfe Waves [BigBeluga]", overlay = true, max_labels_count = 500, max_lines_count = 500)
plot(na, editable = false)

// INPUTS ――――――――――――――――――――――――――――――――――――――――――――――――――――――――――――――――――――――――――――――――――――――――――――――――――――――――{
sensetivity = input.int(10)
isbull = input.string("Bearish", "Wave", ["Bullish", "Bearish"]) == "Bullish"
bearCol = input.color(color.orange)
bullcol = input.color(color.lime)

var int     index_low   = na
var float   loww        = na
var int     index_high  = na
var float   highh       = na
var bool    direction   = bool(na)
var isPh = false


type pivot
    float val
    int indx
    bool isPh
var pivots = array.new<pivot>()


var lastIndex = 0

type wave
    array<label> lbls
    array<line> lines

var draws = array.new<wave>()
var duration = 0
var isdetected = false
var top = 0.

atr = ta.atr(200)

// }


// CALCULATIONS――――――――――――――――――――――――――――――――――――――――――――――――――――――――――――――――――――――――――――――――――――――――――――――{
len = sensetivity
float highest = ta.highest(len)
float lowest  = ta.lowest(len)

if pivots.size() > 5
    pivots.shift()


stl1   = line.style_solid

if high == highest
    direction := true
if low  == lowest
    direction := false

if low[1] == lowest[1] and low > lowest
    index_low := bar_index[1]
    loww      := low[1]

if high[1] == highest[1] and high < highest
    index_high := bar_index[1]
    highh      := high[1]

if direction != direction[1] and direction
    pivots.push(pivot.new(loww, index_low, false))

if direction != direction[1] and not direction
    pivots.push(pivot.new(highh, index_high, true))


if pivots.size() == 5

    piv1 = pivots.get(0)
    piv2 = pivots.get(1)
    piv3 = pivots.get(2)
    piv4 = pivots.get(3)
    piv5 = pivots.get(4)

    isBearWWave = piv1.val > piv2.val and piv2.val < piv3.val and piv3.val > piv1.val and piv4.val > piv2.val and piv4.val < piv1.val and piv5.val > piv3.val
    isBullWWave = piv1.val < piv2.val and piv2.val > piv4.val and piv3.val < piv1.val and piv4.val > piv1.val and piv5.val < piv3.val

    cond = isbull ? isBullWWave : isBearWWave
// }

// PLOT ――――――――――――――――――――――――――――――――――――――――――――――――――――――――――――――――――――――――――――――――――――――――――――――――――――――――――――{
    if cond and not isdetected and (lastIndex != piv1.indx) and piv1.indx > lastIndex and barstate.isconfirmed

        labels = array.new<label>()
        lines = array.new<line>()

        lastIndex := piv5.indx
        for p in pivots
            index = str.tostring(pivots.indexof(p)+1)
            labels.push(label.new(p.indx, p.val, style = p.isPh ? "ldn" : "lup", color = color(na), text = index == "5" ? (isbull ? "5\nBullish" : "Bearish\n5") : index))

        color = isbull ? bullcol : bearCol

        l1 = line.new(piv1.indx, piv1.val, piv2.indx, piv2.val, color = color, width = 2)
        l2 = line.new(piv2.indx, piv2.val, piv3.indx, piv3.val, color = color, width = 2)
        l3 = line.new(piv3.indx, piv3.val, piv4.indx, piv4.val, color = color, width = 2)
        l4 = line.new(piv4.indx, piv4.val, piv5.indx, piv5.val, color = color, width = 2)

        bars1 = piv4.indx - piv1.indx
        slope1 = (piv1.val-piv4.val)/bars1

        bars2 = piv3.indx - piv1.indx
        slope2 = (piv3.val-piv1.val)/bars2
        b2 = piv5.indx - piv3.indx

        bars3 = piv4.indx - piv2.indx
        slope3 = (piv4.val-piv2.val)/bars3
        b3 = piv5.indx - piv4.indx


        l5 = line.new(piv1.indx, piv1.val, piv4.indx+bars1, piv4.val-slope1*bars1, width = 1, style = line.style_dashed, color = chart.fg_color)


        l6 = line.new(piv1.indx, piv1.val, piv3.indx+b2, piv3.val+slope2*b2, width = 1, style = line.style_dotted, color = chart.fg_color)
        l7 = line.new(piv2.indx, piv2.val, piv4.indx+b3, piv4.val+slope3*b3, width = 1, style = line.style_dotted, color = chart.fg_color)


        lines.push(l1)
        lines.push(l2)
        lines.push(l3)
        lines.push(l4)
        lines.push(l5)

        isdetected := true
        duration := 0
        top := piv5.val

        draws.push(wave.new(labels, lines))

if isdetected
    duration += 1

if duration == 50
    isdetected := false


crossUp = ta.crossunder(high, top)
crossDn = ta.crossover(low, top)

if duration < 15

    cond = isbull ? crossUp : crossDn

    if cond and top == top[1] and barstate.isconfirmed

        d = draws.last()
        for l in d.lines
            l.set_color(color.red)

        for l in d.lbls
            l.delete()
// }
Other Indicators
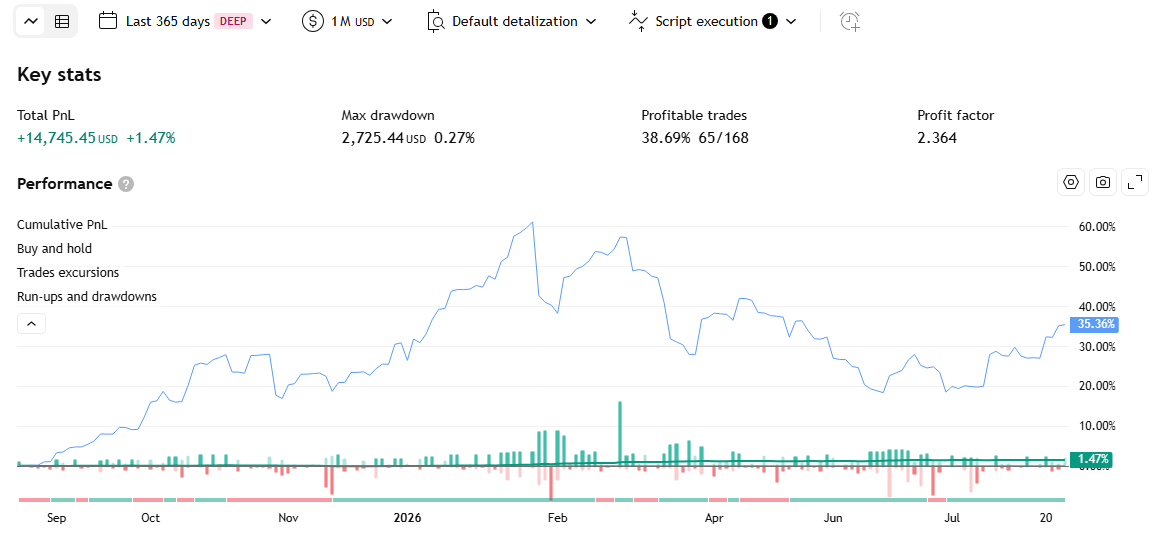
HTF Candle Profile Indicator – Strategy
An indicator that builds a Volume Profile chart for exactly one higher-timeframe (HTF) candle currently forming, based on the volume of the current-timeframe bars falling inside it, then projects the whole analysis as a visual diagram right next to the chart.
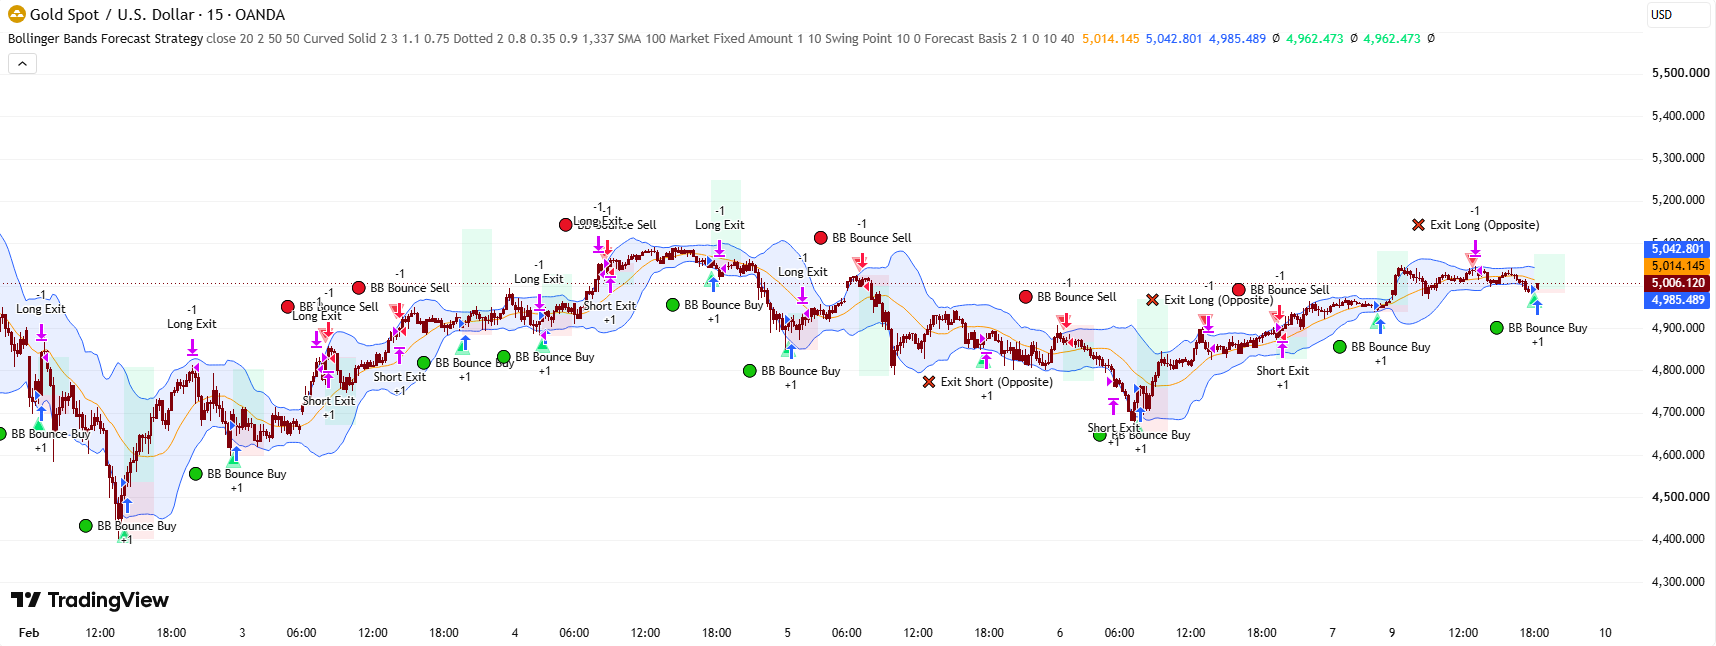
Bollinger Bands Regression Forecast Indicator– Strategy
Traditional Bollinger Bands combined with a projected “forecast cone” — linearly extrapolating the trend of the middle line and the band width, showing what the bands might look like in the future.
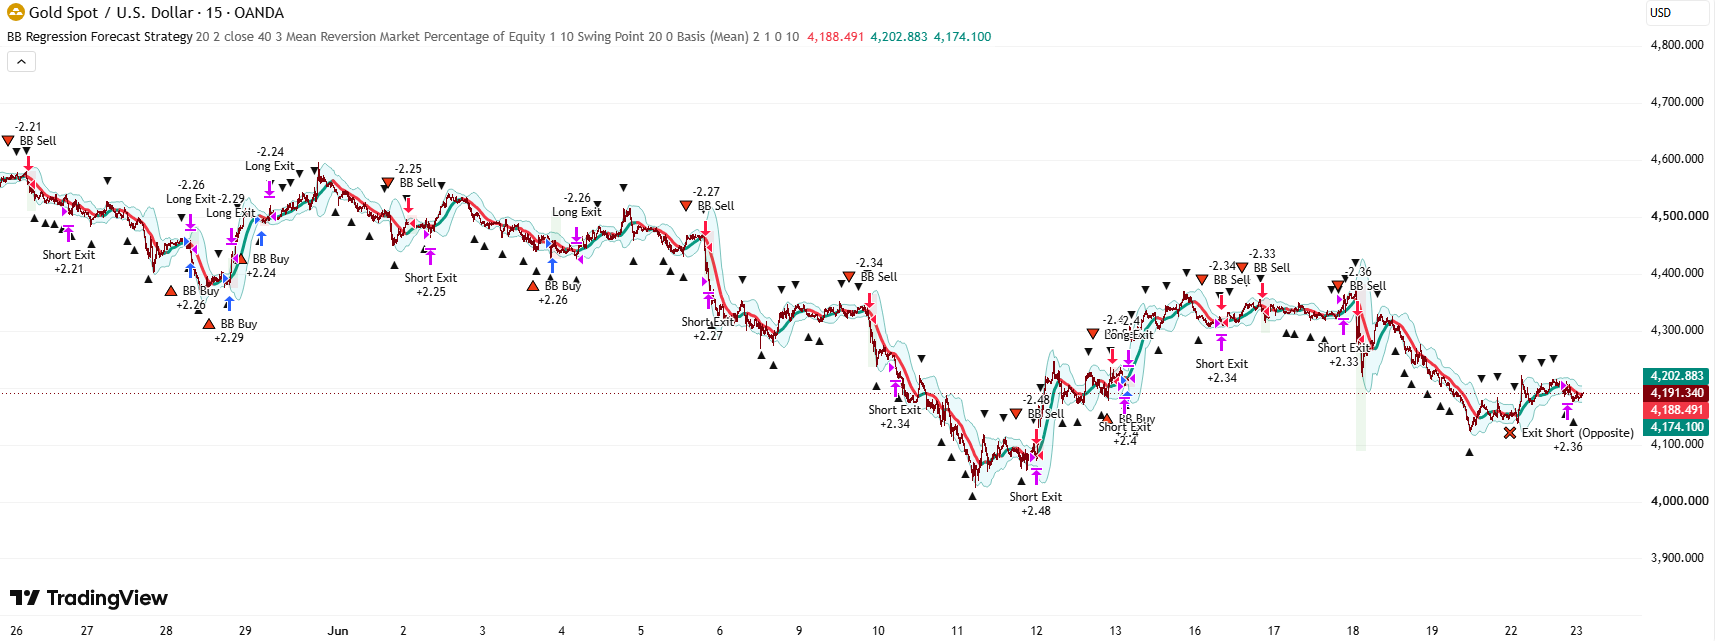
Bollinger Bands Forecast with Signals Indicator – Strategy
Standard Bollinger Bands plus a forward-extrapolated “forecast cone”, an illustrative zigzag+random-walk price path threading through that cone, and an independent mean-reversion signal engine that fires when price gets rejected at the upper/lower band.