1. Retest Machine RSI Strategy Description
An RSI-based oscillator that learns from its own history: it fingerprints every bar with 8 RSI-derived features, finds the most similar past bars via k-nearest-neighbors, and turns their outcomes into a Rank/Confidence-gated bias, an adaptive trailing stop, and Long/Short signals
1.1 Indicator Concept
A classic RSI only tells you "momentum is at 72 right now." This indicator asks a different question: "the last few times momentum looked like this, what actually happened next?" It is built on the same idea behind k-nearest-neighbor (k-NN) machine learning: describe every bar with a small set of numeric traits ("features"), keep a running memory of thousands of past bars' traits together with what price actually did afterward, and when a new bar arrives, find the historical bars that looked most alike and let their real outcomes vote on what's likely to happen this time.
- 8 features per bar, all derived from RSI: instead of comparing bars by raw price, the engine describes each bar using 8 numbers computed from RSI - its level, its momentum, its acceleration, its distance from neutral, its percentile rank, its own volatility, a fast/slow spread, and a smoothed regime reading. Together these form each bar's "fingerprint."
- A self-updating memory bank: every time a bar closes, its fingerprint from horizonBars bars ago gets permanently labeled with what price actually did in the meantime (a real, observed outcome - not a guess) and stored. Over time this bank becomes a personalized history of "setup → outcome" pairs for whatever instrument and timeframe you're on.
- Optional self-tuning: the engine can automatically figure out which of the 8 features has historically separated winning setups from losing ones best (using a standard statistics technique called a Fisher discriminant), and lean on those features more heavily - instead of you guessing fixed weights by hand.
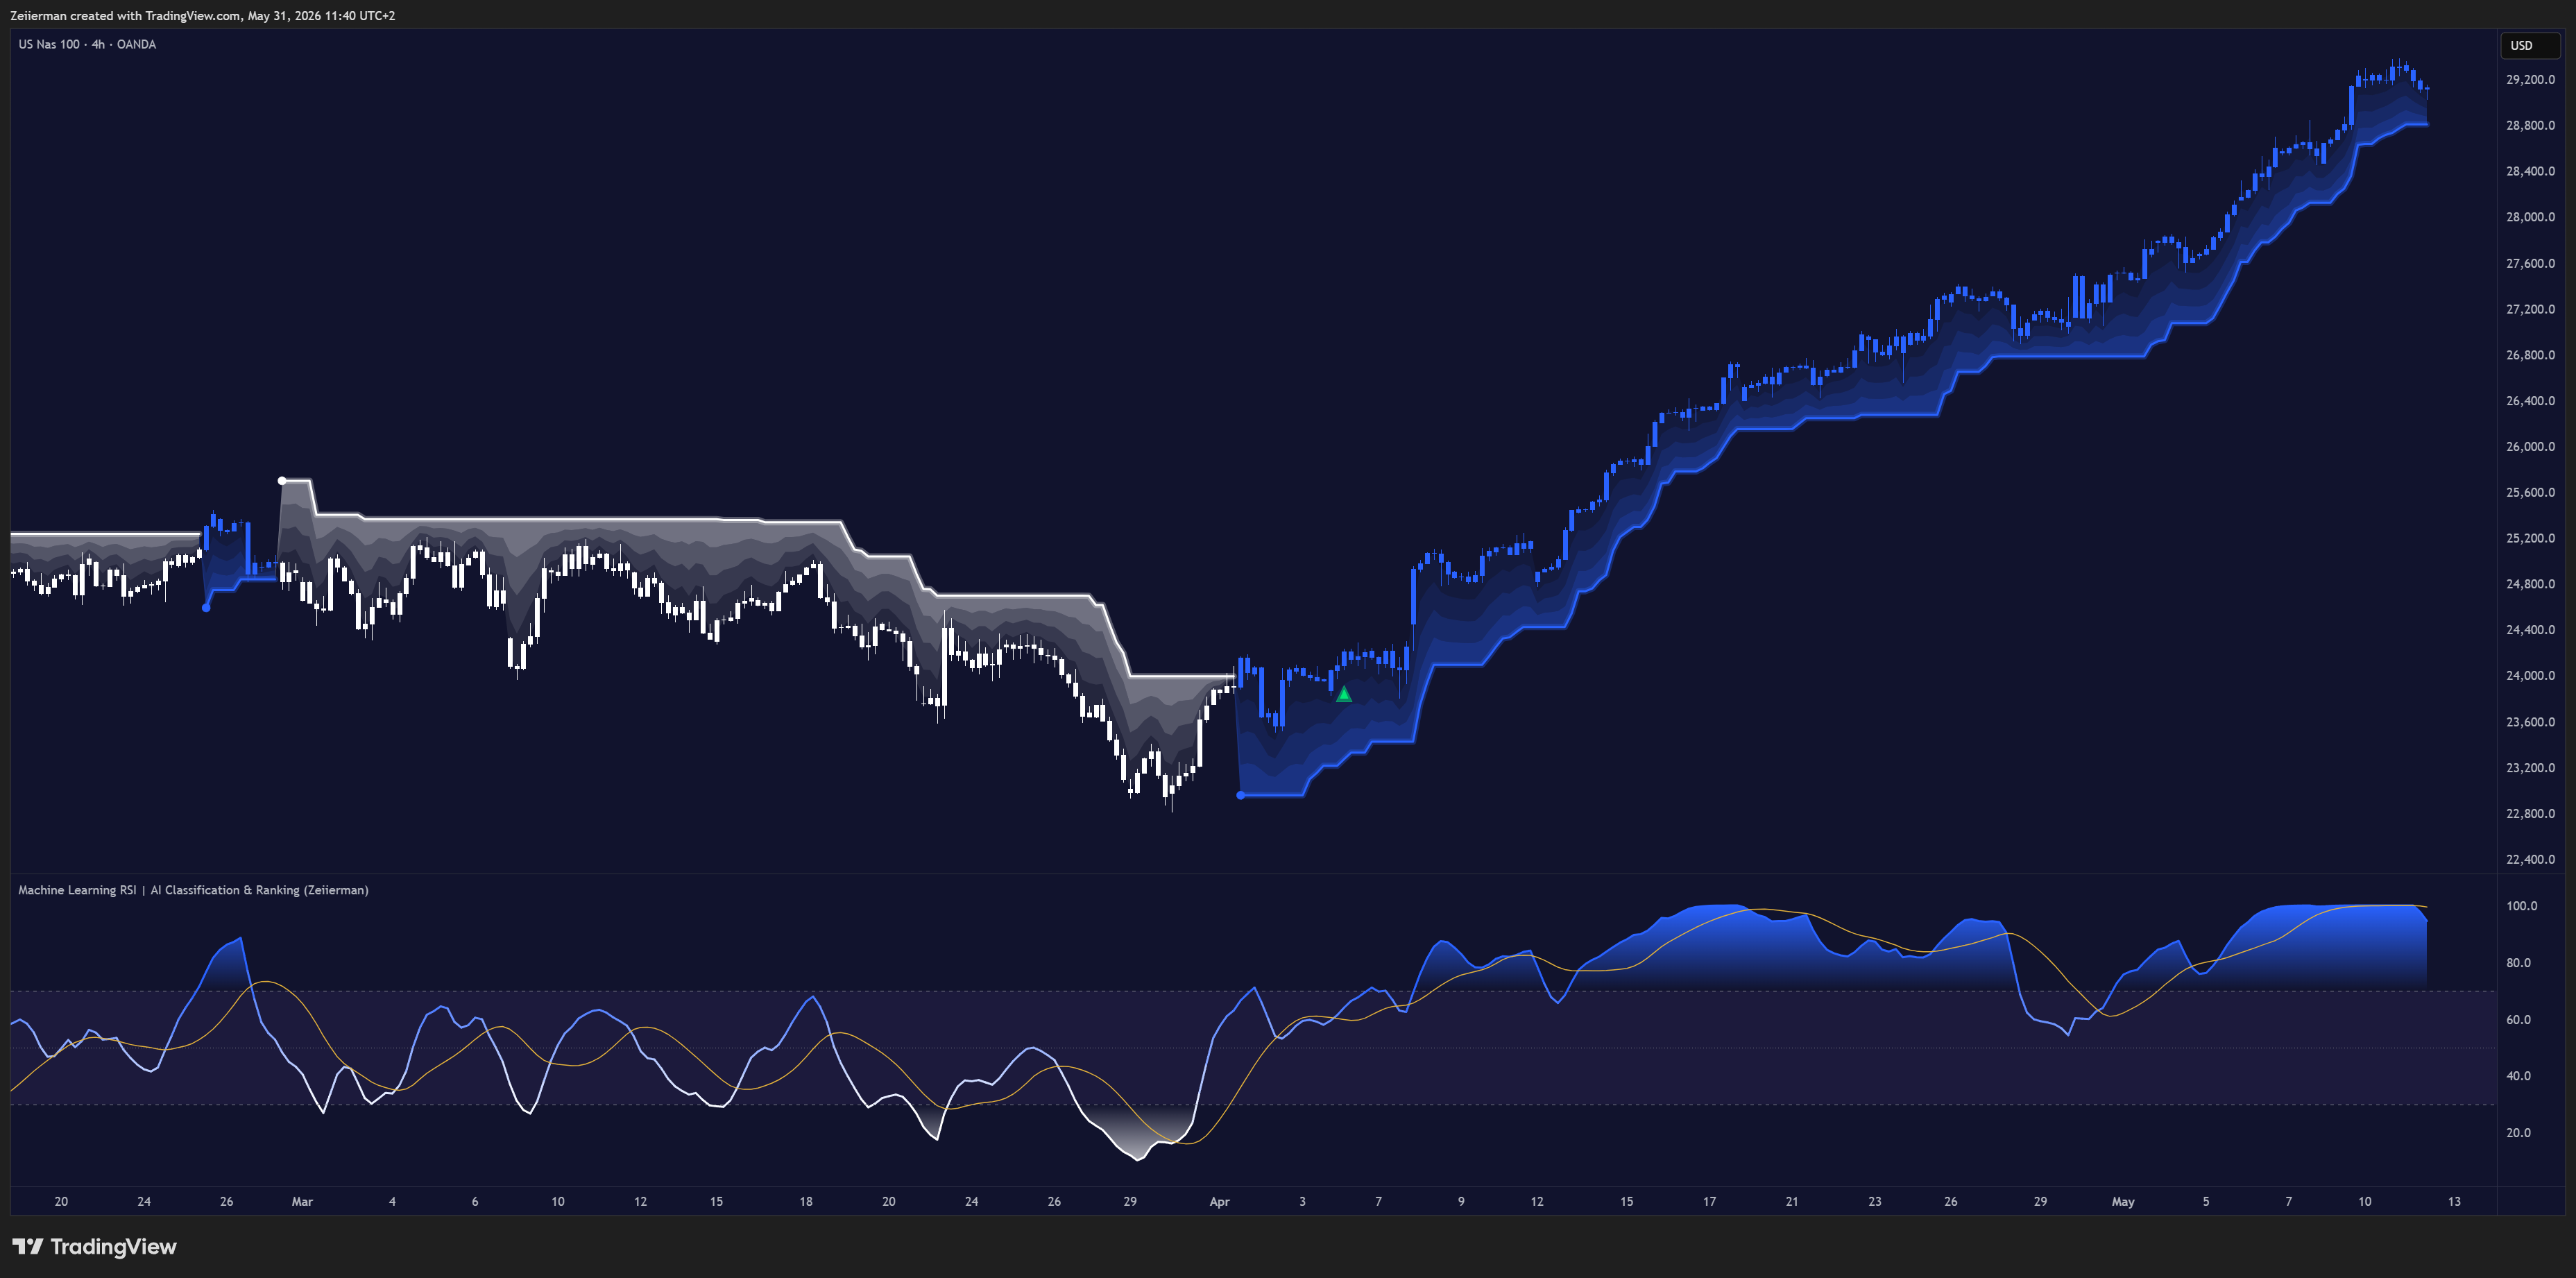
- Two outputs built on one engine: the same k-NN "read" of the market drives both an oscillator-style "ML RSI" line (in this indicator's own pane) and an adaptive trailing stop plus candle coloring/cloud drawn on the price chart - with Long/Short entry signals only firing once the setup clears quality (Rank) and certainty (Confidence) thresholds.
1.2 Indicator Features
- ML RSI Line (in the indicator's own pane): a lightly-smoothed version of the base RSI, gently tilted toward whatever direction the analog engine currently favors. Its color blends between the bear and bull colors based on level, and shaded gradient fills highlight overbought (>70) / oversold (<30) territory.
- RSI Signal Line (optional): a configurable moving average (SMA/EMA/SMMA/WMA/VWMA, or SMA with Bollinger Bands) plotted on top of the ML RSI, usable as a classic crossover trigger.
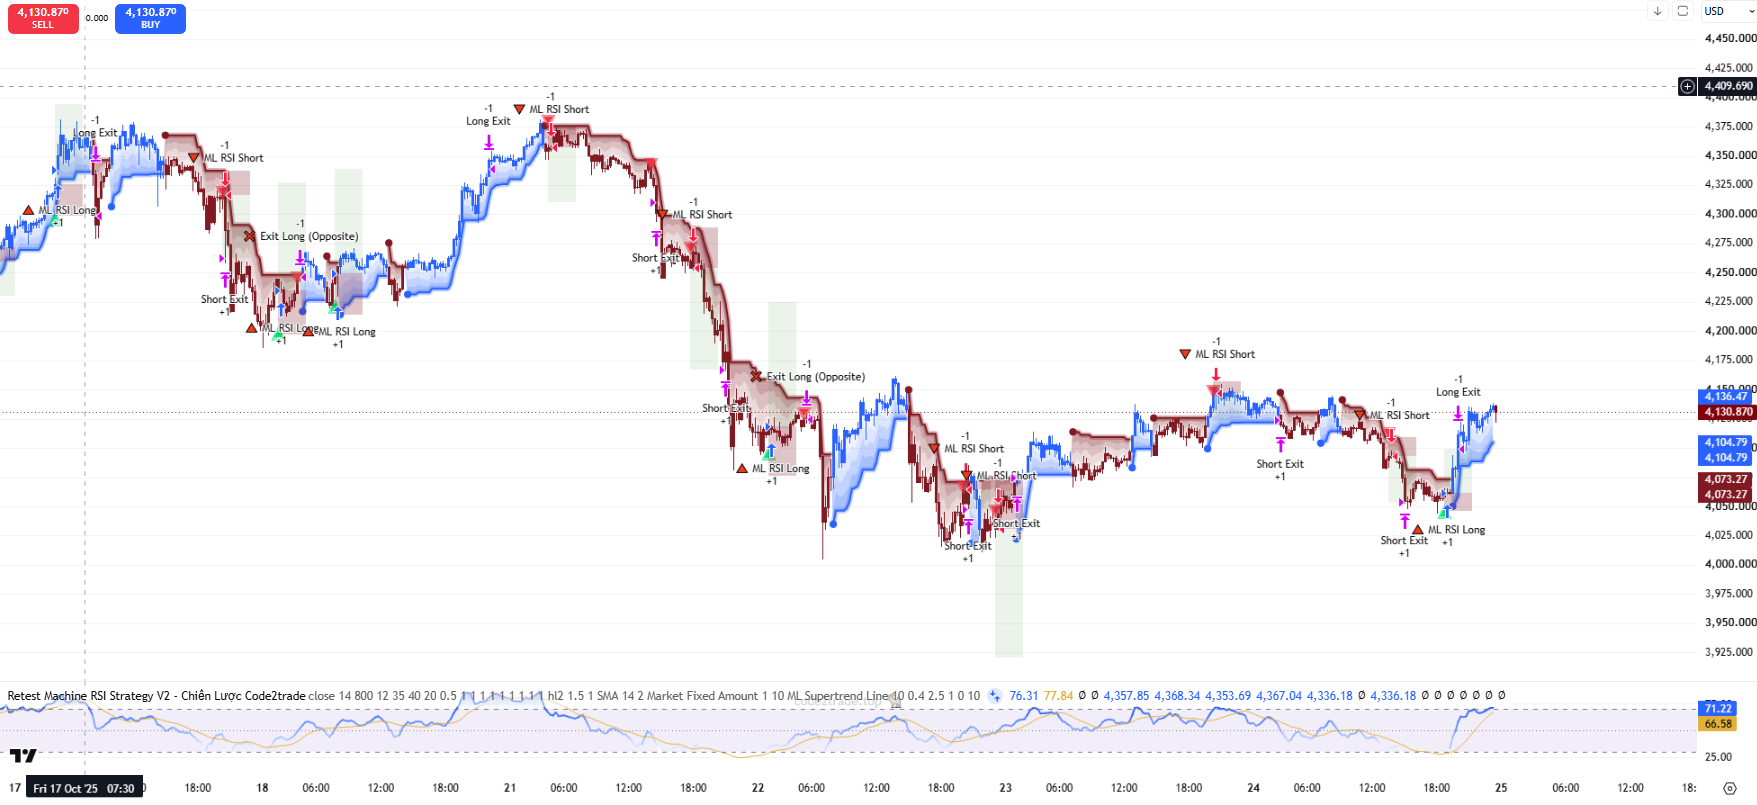
- ML Adaptive Supertrend (on the price chart): a trailing-stop line whose distance from price isn't fixed - it tightens when the engine is highly convinced and widens when it's unsure or when the market is choppy. Includes an optional glow effect, small flip-direction dots, and a soft multi-layer "trend cloud" between the stop and price (glow and cloud are always on whenever the Supertrend itself is shown - there's no separate switch for them).
- Candle Coloring (optional): paints the real chart's candles by the Supertrend's current direction, for an at-a-glance read without watching the oscillator pane.
- Long/Short Signal Markers (optional): triangles that only appear once a directional flip clears both the Rank and Confidence gates, all active filters, and a cooldown - so far fewer markers than raw flips.
- Alerts: 6 selectable static alert conditions (Long/Short/Any Signal, Flip Up/Down/Any Flip) plus 4 richer dynamic alerts that embed the live Rank and Confidence numbers directly in the message text.
1.3 How to Use the Indicator
- Treat Long/Short markers as the headline output: they've already been filtered through the whole engine - analog agreement, trend alignment, volatility health, chop avoidance, and a cooldown - so they're deliberately rarer and higher-conviction than a raw RSI cross would be.
- Watch the ML Supertrend for the broader trend context, independently of whether a signal has fired - it can be in an uptrend (green candles) even while the engine hasn't found a qualifying long setup yet (see 1.4 for why these two reads are separate).
- Use the dynamic alert messages to triage signals without opening the chart: the embedded Rank/Confidence numbers let you judge conviction directly from the notification.
- Raise Min Rank / Min Confidence for fewer, higher-quality signals; lower them if the engine feels too quiet for your style.
- Leave Auto-Optimize Weights on for hands-off adaptation to the instrument/regime you're trading; only switch to manual Feature Weights if you have a specific reason to emphasize one RSI trait over another.
- Give the engine time to warm up: the memory bank and the auto-weight optimizer both need a minimum number of labeled bars before they're fully active (see 1.4) - early in a fresh chart, Rank/Confidence and signal frequency should be expected to behave differently than once the bank has matured.
1.4 How the Indicator Works
Inputs & Roles
- priceSrc ("Price Source", default: close): the price series every RSI feature is built from. Switching to hl2/ohlc4 smooths out wick noise across the whole engine.
- rsiBase ("Base RSI Length", default: 14, min 2): the core RSI period. A fast RSI (half this length) and a slow RSI (double this length) are derived from it purely to build the "fast/slow spread" feature. Lower (7-10) → twitchier, more signals. Higher (20-30) → smoother, fewer, more deliberate signals.
- memoryDepth ("Memory Depth (bars)", default: 500, range 80-5000): how many past labeled bars the bank keeps for analog searching. Example: at 500, once the 501st labeled bar is added, the single oldest one is dropped. Raise toward 1000+ on higher timeframes; lower (150-300) on fast intraday charts so stale market regimes are forgotten quickly.
- kNeighbors ("Analog Count (k)", default: 8, range 1-64): how many of the closest historical matches vote on the current bar. Small k (5-8) → sharp but jumpy. Large k (12-20) → smoother consensus, better for noisy markets.
- showMarks ("Show Signal Markers", default: true): shows/hides the ▲/▼ entry triangles.
- paintBars ("Candle coloring", default: true): paints candles by the Supertrend's regime color. Purely visual.
- gateRank ("Min Rank to Signal", default: 60, range 0-100): the minimum Setup Rank (see Flow 7) a flip must reach to become a visible/alertable signal. Higher → rarer, higher-conviction signals.
- gateConf ("Min Confidence to Signal", default: 50, range 0-100): the minimum Confidence score a flip must also reach (both gates are required, not either/or).
- useTrendGate ("Trend Gate", default: true): while on, the engine's stance can only move to Long while the ML Supertrend is in an uptrend, or to Short while it's in a downtrend. Turn off to allow counter-trend/mean-reversion stances.
- useVolBand ("Volatility Band", default: true) / volBandLo ("Min Vol Rank", default: 20, range 0-100): only allows the stance to update while ATR's 100-bar percentile rank sits between volBandLo and a fixed upper bound of 85 - i.e. neither too dead-quiet nor too explosively volatile.
- useChop ("Chop Filter", default: true): while on, a choppy/range-bound reading (trend strength below an internal cutoff) both blocks the stance from updating and widens the adaptive Supertrend's bands. Note: even with this OFF, Rank scoring still penalizes raw choppiness (see Flow 7) - the toggle only controls whether chop actively blocks signals and widens bands, not whether it affects Rank at all.
- atrFactor ("Learning Sensitivity (×ATR)", default: 0.5, min 0, step 0.1): the ATR-multiple threshold used to decide whether a historical bar's forward move counts as a meaningful win/loss while building the memory bank. Low (0.2-0.4) → learns from many, smaller/noisier moves. High (0.8-1.5) → learns only from large, cleaner moves.
- autoWeightsOn ("Auto-Optimize Weights", default: true): lets the engine learn each feature's importance from the labeled bank instead of using the manual weights below. When on, the 8 manual weight inputs are grayed out and have no effect on calculation at all.
- autoSpeed ("Adaptation Speed", default: 1, range 0.005-1.0): how fast the learned weights drift toward freshly computed values each bar (an EMA blend factor). Low → slow, stable weights. High → weights snap to the latest data quickly but can jitter. Only active when Auto-Optimize is on.
- wVal / wSlp / wAcc / wMid / wPct / wChn / wSpr / wReg ("RSI Value / Slope / Acceleration / Midpoint Dist / Percentile / Volatility / Fast-Slow Spread / Regime", all default: 1.0): manual importance weights for each of the 8 features, used only when Auto-Optimize is off. Raising one makes the distance metric care more about matching that specific trait when searching for analogs.
- showSt ("Show ML Supertrend", default: true): shows/hides the Supertrend line, its glow, flip dots, and the trend cloud. Important: this is a display-only toggle - the underlying trend direction is still computed and still drives the Trend Gate and candle coloring even when this is turned off.
- stSrc ("Supertrend Source", default: hl2): price series the bands are built around.
- stMultBase ("ATR Multiplier", default: 1.5, min 0.5, step 0.1): the base band distance in ATR units, before ML adaptivity adjusts it. Lower → tighter stop, more flips. Higher → wider stop, rides trends longer.
- stMlResp ("ML Band Adaptivity", default: 1, range 0-1): how strongly engine conviction reshapes the band width. 0 = a plain fixed-multiplier Supertrend (no ML influence at all). 1 = maximum ML influence (bands can nearly double in width when conviction is low).
- maTypeInput ("Type", default: SMA): the RSI Signal Line's moving-average type, or "None" to hide it.
- maLengthInput ("Length", default: 14): the signal line's lookback. bbMultInput ("BB StdDev", default: 2.0): Bollinger Band width, only used when Type is "SMA + Bollinger Bands".
- sigBull/sigBear, trailBull/trailBear, rsiBull/rsiBear, smoothLineCol/bbAreaCol: color controls for signal markers, Supertrend/cloud, ML RSI, and the signal line/BB fill respectively. Purely cosmetic.
Main Logic Blocks
🎯 Flow 1: What You See — Two Independent "Regime" Reads
- This indicator actually tracks two separate directional reads that can disagree with each other: (1) stDir, the raw ML Supertrend's own trailing-stop direction - this alone drives candle coloring, the trend cloud, and the Supertrend line itself; and (2) stanceState, the analog engine's own gated directional stance - this alone drives Long/Short signal triggering.
- Example: the Supertrend can already be green (uptrend, stDir=1) while stanceState is still 0 or even -1, simply because the k-NN engine hasn't yet found a bullish analog setup that clears the Trend/Volatility/Chop gates. In that situation you'd see bullish candle coloring with no long signal - this is expected behavior, not a bug.
- The ML RSI line (in the separate oscillator pane) is a third, purely visual output: raw RSI nudged by a small amount toward the engine's current conviction, then lightly smoothed - see Flow 8.
🧬 Flow 2: Turning Price Into 8 RSI Features (every bar)
- Three RSIs are computed from priceSrc: the base RSI (length rsiBase), a fast one (half length), and a slow one (double length). Only the base RSI feeds most features directly; fast/slow feed just one feature (spread).
- Each of the 8 features is a number, mostly normalized into a comparable 0-1-ish range using a helper that min-max scales a value against its own rolling highest/lowest over a 100-bar window (so a feature always means roughly "how extreme is this, relative to its own recent behavior" rather than an arbitrary raw number): value (RSI level ÷ 100), slope (3-bar RSI change, normalized), accel (change in that slope - i.e. is momentum speeding up or fading), mid (distance from RSI 50, 0=neutral, 1=extreme), pct (RSI's own percentile rank over the last 100 bars), churn (RSI's own volatility, normalized), spread (fast RSI minus slow RSI, normalized), and regime (a 20-bar EMA of RSI relative to 50, normalized).
- Together these 8 numbers are this bar's "fingerprint" - the thing every historical comparison is based on.
🏦 Flow 3: Building & Labeling the Memory Bank
- You can't know whether a setup "worked" until some time has passed - so the engine waits horizonBars (4) bars after every confirmed bar, then measures how far price actually moved from that bar to now, compared against an ATR-scaled threshold (atrFactor × that bar's ATR).
- Example: atrFactor=0.5, ATR=$10 at the time → threshold band = $5. A forward move of +$12 (more than 2×$5) labels that bar "strong bull" (+3); +$7 (more than 1×$5 but under 2×) labels it "bull" (+2); +$2 (positive but under the band) labels it "weak bull" (+1); and mirrored negative thresholds label bear outcomes -1/-2/-3, with exactly $0 movement labeled neutral (0).
- Once labeled, that bar's features from 4 bars ago (not today's features) are paired with this outcome and appended as one row to the memory bank - so the bank only ever contains fully-confirmed, non-repainting history. The bank is capped at memoryDepth rows, oldest dropped first once full.
⚖️ Flow 4: Learning Which Features Matter (Auto-Optimize Weights)
- When enabled and once the bank holds at least 60 labeled rows, the engine splits all bank rows with a clear bull (label > 0) or bear (label < 0) outcome into two groups (neutral-outcome rows are excluded from this calculation), then for each of the 8 features computes a Fisher discriminant score - a standard statistics measure of how well a single number separates two groups: it compares how far apart the two groups' averages are against how spread-out each group is internally. A feature whose bull-setup values and bear-setup values cluster tightly around two very different averages scores high; a feature whose values overlap heavily between bull and bear setups scores low.
- The 8 scores are then rescaled so the single most discriminating feature gets a weight of 10, the others scaled down proportionally, with every feature guaranteed at least a floor weight of 0.5 (no feature is ever fully zeroed out).
- These freshly computed weights don't replace the running weights outright - they're blended in gradually via autoSpeed (an EMA-style step: new weight = old weight + speed × (fresh weight − old weight)), so the weighting evolves smoothly rather than jumping around bar to bar.
🔍 Flow 5: Finding & Voting With the k Nearest Analogs
- Every bar, the engine compares today's 8-feature fingerprint against bank rows (only every 4th stored row is even considered, to avoid neighboring, highly-similar bars crowding out variety), computing a weighted distance ("gap") for each: every one of the 8 raw feature differences is first run through a log-based softening function (so a huge mismatch on one feature doesn't completely dominate the score), then multiplied by that feature's weight and summed.
- The kNeighbors rows with the smallest gap are kept as the "analogs" for this bar (fewer than that if the bank doesn't have enough rows yet).
- Each analog then casts a distance-weighted vote (closer analogs count more, using a 1÷(1+gap) weighting): its outcome class (from -3 to +3) contributes to a running total, and separately to a bull-weight or bear-weight bucket depending on its sign.
- From these votes the engine computes: analogScore (the weighted-average outcome class across all analogs - a continuous bull/bear tilt), biasDir (+1/-1/0, requiring analogScore to clear a ±0.15 deadzone before committing to a direction), agreeFrac (what share of the total voting weight agrees with the chosen direction - the core consensus measure), and gapTight (how close, on average, the chosen analogs actually were - 1.0 means an almost perfect historical match, 0 means only loosely similar).
🌦️ Flow 6: Market Context & the ML Adaptive Supertrend
- Separately from the analog engine, a simple trend-strength check compares a 5-bar EMA against a 50-bar EMA relative to ATR; below an internal cutoff, the bar is flagged "choppy" - this raw chop reading always exists, but only actively blocks signals/widens bands when the Chop Filter toggle is on.
- The engine's conviction (from analogScore, smoothed) combines with gapTight and agreeFrac into a single 0-1 "drive" score - this is cut to 35% of its value whenever chop is detected (and the toggle is on).
- This drive score directly sets how wide the Supertrend's ATR bands are: at maximum drive, bands sit at exactly stMultBase × ATR (tightest); at zero drive, they widen up to stMultBase × (1 + stMlResp) × ATR. The bands then ratchet in the classic Supertrend way (a long-side stop only ever moves up while price holds above it, a short-side stop only ever moves down), and stDir flips when price closes through the opposite band.
🏅 Flow 7: Turning the Read Into Rank & Confidence
- Rank (0-100, "how good is this setup"): built from up to ~95 raw points across analog agreement (25), analog tightness (15), RSI-slope/extreme structure (up to 15), trend alignment (10), volatility health (10), regime fit (10), short-term RSI direction agreement (5), and stance maturity/age (up to 5) - minus a capped 20-point penalty for raw choppiness, an already-extreme (stretched) reading, an early/whippy flip, or too few analogs found. Note: the chop penalty here always uses the raw chop reading, regardless of whether the Chop Filter toggle is on.
- Confidence (0-100, "how sure is the engine"): a separate blend weighted mostly toward analog agreement (40) and tightness (25), plus stance maturity (up to 15) and slope fit (10), minus a 15-point penalty specifically for an early/whippy flip and a penalty for too few analogs.
- Both scores are 0 whenever the engine has no directional bias at all (biasDir=0).
🚦 Flow 8: From Stance to Signal
- stanceState (the engine's own persistent directional stance, separate from the Supertrend) only moves to a new direction on a bar where biasDir agrees and all active gates (Trend/Volatility/ Chop) pass; if a gate fails, the stance simply holds its last value rather than resetting to neutral.
- A "flip" is detected the bar the stance actually changes value. That flip only becomes a visible/alertable signal if, additionally, Rank ≥ gateRank AND Confidence ≥ gateConf, the bar is fully confirmed/closed, and at least 5 bars have passed since the last signal (the cooldown).
- This is a two-layer filter: the stance itself already requires gate-passing conditions to change direction, and then the resulting flip is filtered a second time by Rank and Confidence before it's allowed to actually mark/alert.
🎨 Flow 9: Visualization Details
- The plotted "ML RSI" line is not the raw RSI used for feature-matching internally - it's the raw RSI shifted by a small "tilt" (up to about ±18 points) that scales with both engine conviction and a smoothed version of Rank, then lightly smoothed again for display.
- The trend cloud is drawn as 4 progressively more transparent fill layers between the Supertrend line and price, all colored by the Supertrend's own direction (matching candle coloring).
- Signal triangles are placed at the 5-bar lowest-low (Long) or highest-high (Short) rather than right on the signal bar itself, keeping them visually clear of nearby wicks; each is drawn twice (a small solid shape plus a larger semi-transparent one) to create a soft halo effect.
🔔 Flow 10: Alerts
- Static conditions (selectable in TradingView's alert dialog): Long Signal, Short Signal, Any Signal, Trend Flip Up, Trend Flip Down, Any Trend Flip.
- Dynamic alerts (fire automatically on confirmed bars, no dialog selection needed): richer one-off messages for Long/Short signals that embed the live Rank and Confidence numbers plus ticker and timeframe directly in the text, and simpler ticker+timeframe messages for trend flips.
Outputs & Usage Roles
- ML RSI + Signal Line: a momentum oscillator view, gently informed by the engine's learned bias, usable with classic overbought/oversold and crossover reading.
- ML Adaptive Supertrend + candle coloring + cloud: the broad trend/regime context, independent of whether an entry signal has actually fired.
- Long/Short markers + Rank/Confidence: the filtered, quality-scored entry output - the headline actionable signal of the indicator.
- Alerts: both quick native alerts and rich contextual notifications for monitoring without watching the chart live.