1. Delta-Void Precision Strategy Description
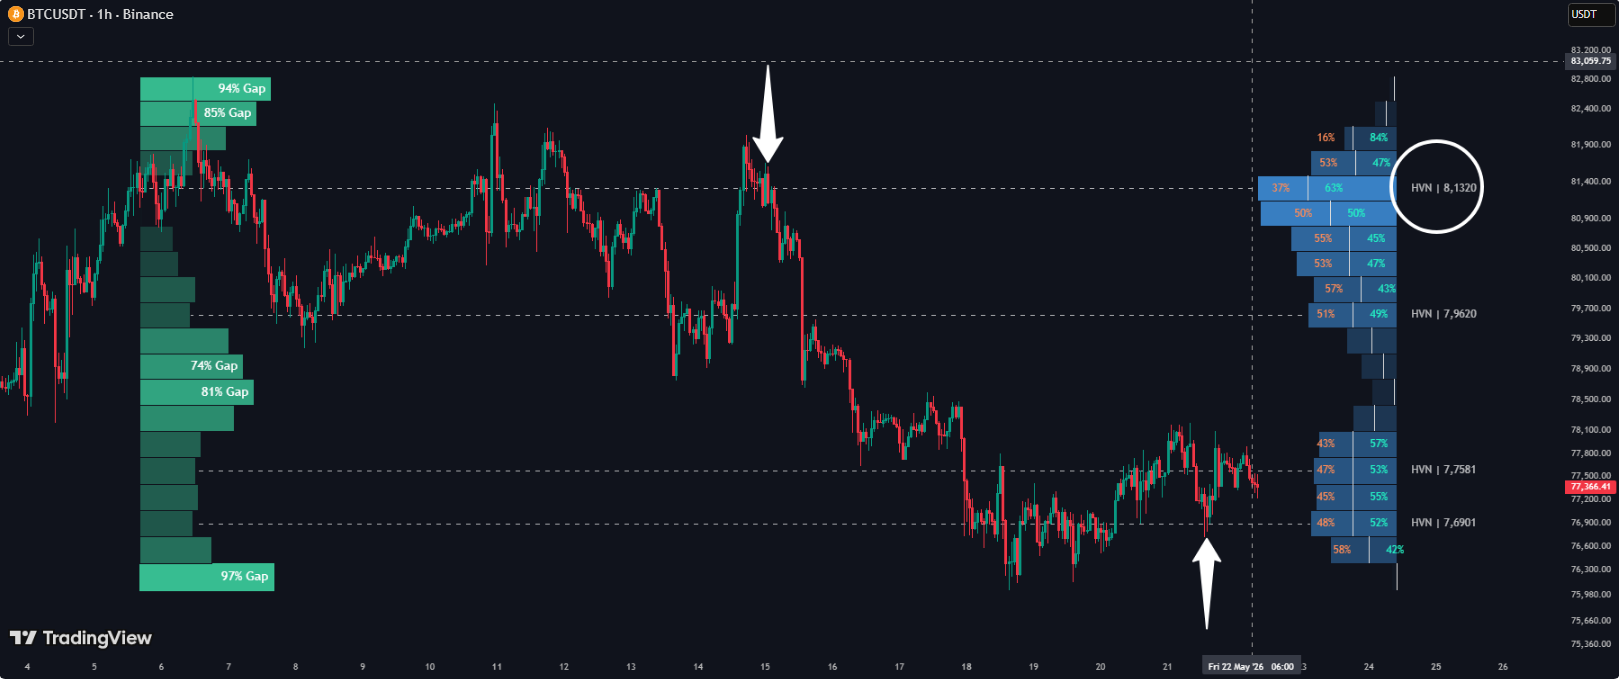
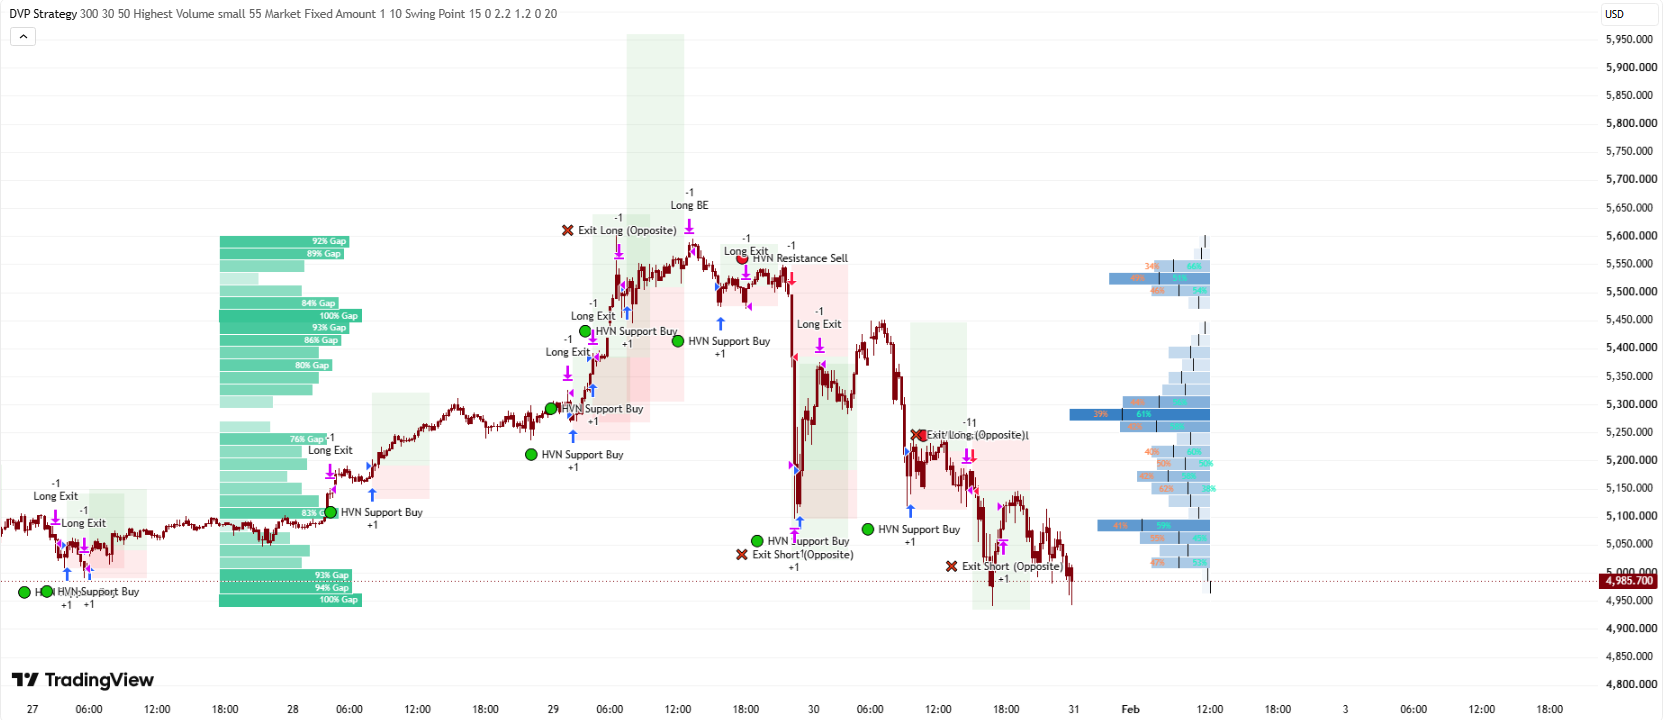
A two-sided volume profile: a "void" profile on the left highlighting low-liquidity price gaps, and a normal profile on the right with an integrated buy/sell delta split, plus optional structural level lines for either high-volume nodes or liquidity gaps
1.1 Indicator Concept
A standard volume profile shows you where trading happened the most. This indicator adds the mirror image: where trading barely happened at all. Every price band over the lookback window is measured for both its total volume and how that volume split between estimated buying and selling pressure, then drawn as two profiles on opposite sides of the chart - one growing with volume, one growing with the absence of it.
- Two profiles, opposite logic: the right-side "normal" profile bar grows the more volume a price band had (a classic high-volume node read); the left-side "inverse/void" profile bar grows the less volume a price band had - a band with almost no trading produces a bold void bar, while a heavily-traded band shrinks toward invisible on that side.
- Buy/sell split without extra bars: rather than drawing two separate colored bars for buying vs. selling volume, each normal-profile bar is divided by a single vertical line positioned exactly at the estimated buy/sell boundary, with percentages labeled on each side.
- One toggle, two different structural reads: the same pivot-style detection logic can either surface High Volume Nodes (classic support/resistance from heavy trading) or Volume Gaps (liquidity vacuums where price is likely to move through quickly), depending on a single "Level Display" choice.
- A snapshot, not a running history: the entire profile is rebuilt from scratch on the current bar only - it does not accumulate or persist across bars the way some other profile indicators do.
1.2 Indicator Features
- Inverse (Void) Profile - left side: boxes extending further left the emptier a price band was, colored by a gradient that fades from the chart background (no void) to the void color (maximum void). The single deepest void band gets a bold outline, and any sufficiently large void band is labeled with its gap percentage.
- Normal Profile - right side: classic volume-profile boxes anchored to a fixed point ahead of price, growing toward price as a band's volume increases, colored by a gradient from background (low volume) to the normal color (high volume, at the peak bin).
- Buy/Sell Delta Split: a single vertical divider inside each sufficiently wide normal-profile bar, splitting it at the estimated buy percentage, with green buy% and orange sell% labels on either side.
- Structural Level Lines (optional): full-width dashed lines at local peaks in either raw volume (High Volume Nodes) or void strength (Volume Gaps), each labeled with its price.
1.3 How to Use the Indicator
- Read the left side as "where price might move through quickly": a bold void bar marks a price band the market has largely skipped over during the lookback window - if price re-enters that zone, there's comparatively little established trading interest to slow it down.
- Read the right side as classic support/resistance: the widest, most saturated normal-profile bars mark where the most trading has concentrated - candidate reaction zones.
- Use the buy/sell split to judge which side dominated a price band: a divider sitting far to one side of a bar means that band's volume was overwhelmingly buy-skewed or sell-skewed (by the close-position estimate, not measured order flow - see 1.4).
- Switch "Level Display" to match what you're hunting for: "Highest Volume" for classic S/R levels, "Volume Gaps" to specifically flag the emptiest, most liquidity-starved bands as reference lines.
- Raise "Lookback Period" for a broader structural view at the cost of heavier computation every bar (see 1.4); raise "Number of Bins" for finer price resolution at the cost of thinner, noisier individual bars.
1.4 How the Indicator Works
Inputs & Roles
- lookback ("Lookback Period", Integer, default: 400, min 50): how many recent bars are scanned to build the profile. Example: at 400, the price range and every bin's volume are derived purely from the last 400 bars, ignoring anything older. Higher → a more macro, "whole recent history" view. Lower → a tighter, more recent-focused view. Because this window is fully rescanned every bar (see the note below), very high values increase computation load.
- binCount ("Number of Bins", Integer, default: 30, min 10): how many equal price bands the high-low range is divided into. Higher → finer price resolution, thinner individual bars. Lower → coarser, chunkier bands.
- profileWidth ("Max Profile Width (Bars)", Integer, default: 50, min 5): the maximum horizontal length, in bars, that either the void or normal profile bars can reach (the peak bin on the normal side, or the emptiest bin on the void side, reaches exactly this width).
- levelMode ("Level Display", Options: None / Highest Volume / Volume Gaps, default: "Highest Volume"): which structural levels get drawn as dashed reference lines - local peaks in raw bin volume (High Volume Nodes) or local peaks in void strength (Volume Gaps). "None" disables the structural lines entirely.
- invColor ("Inverse Peak (Left)", default: teal): the void profile's color at maximum void strength.
- normColor ("Normal Bin Base", default: blue): the normal profile's color at maximum (peak-bin) volume.
- levelColor ("Level Color", default: 30%-transparent white): color of the dashed structural level lines and their price labels.
- labelSize ("Global Text Size", Options: tiny/small/normal/ large, default: small): font size for every text label the indicator draws (gap %, buy/sell %, and structural level price labels all share this one setting).
- The profile is a full snapshot rebuilt every bar, not an accumulating history - the bin arrays are cleared and re-scanned across the entire lookback window from scratch each time, and every drawn box/line/label is deleted and redrawn from zero as well. Nothing here persists or accumulates bar-to-bar in the way some other profile-style indicators do.
- The buy/sell split is an estimate, not measured order-flow/tick data - it's derived purely from where each historical bar's close sat within that bar's own high-low range (close near the high ≈ mostly buying pressure that bar, close near the low ≈ mostly selling pressure), a common approximation technique since true buy/sell tick data isn't available to Pine Script.
- Bins are assigned using only each bar's close price (not its full high-low range) - a simpler bucketing method than volume-profile approaches that spread a single bar's volume across every price level its range touches.
Main Logic Blocks
🎯 Flow 1: What You See
- A void profile growing leftward from the start of the lookback window, a normal profile with an integrated buy/sell split growing leftward from a fixed point ahead of price, and (optionally) full-width dashed structural level lines - all rebuilt fresh on the current bar only.
🧮 Flow 2: Binning Price Into Buckets
- The highest high and lowest low over the last lookback bars set the overall price range, divided into binCount equal bands.
- Looping back through every one of those lookback bars: each bar's volume is added entirely to whichever single band contains that bar's close price, and an estimated buy-volume share (based on where that bar's close sat within its own high-low range) is added to a separate running buy-volume total for the same band.
- The single band with the most accumulated volume becomes maxVol - the reference "100%" both profiles scale against.
🕳️ Flow 3: The Inverse (Void) Profile
- For each band, "void strength" = maxVol minus that band's own volume - a band at the peak has zero void strength (no bar drawn), a completely empty band has void strength equal to maxVol itself (the widest possible void bar).
- That void bar is drawn extending leftward from the start of the lookback window, colored by a gradient that only becomes visibly saturated as the void grows - a heavily-traded band fades toward invisible on this side, while a barely-traded one stands out boldly. The single deepest void band across all bins gets a bold outline; sufficiently wide void bars (over 70% of the max width) are labeled with their gap percentage.
📊 Flow 4: The Normal Profile & Buy/Sell Delta Split
- Each band's normal-profile bar width is proportional to its share of maxVol, anchored to a fixed x-position (profileWidth bars ahead of the current bar) and extending leftward toward price as volume increases - the opposite anchoring direction from the void profile.
- Within a band that has any volume at all, a single vertical line splits the bar at the estimated buy-volume fraction: the portion of the bar between that line and the fixed right anchor represents buy volume, the portion between the line and the bar's left edge represents sell volume. If the bar is wide enough, green buy% and orange sell% labels are placed on either side of that dividing line.
📍 Flow 5: Structural Level Detection
- Walking through the interior bins (skipping the very first and last, which have no neighbor on one side), each bin's chosen metric - raw volume for "Highest Volume" mode, or void strength for "Volume Gaps" mode - is compared against its immediate neighbors on both sides.
- A bin that's strictly higher than both neighbors on the chosen metric is a local peak: a dashed line is drawn at that bin's midpoint price, spanning the entire width from the start of the lookback window to the far edge of the normal profile, labeled "HVN" or "GAP" plus the price.
🔄 Flow 6: Redraw Cadence
- Every bar, all previously drawn boxes/lines/labels are deleted and their tracking arrays cleared. The actual profile/level drawing only happens when barstate.islast is true (the current/most recent bar) - so the visible profile always reflects a full, fresh snapshot as of right now, not a historically-plotted series.
Outputs & Usage Roles
- Void profile: highlights low-liquidity price bands where price has historically moved through quickly.
- Normal profile + delta split: classic high-volume S/R read, with an at-a-glance sense of which side (buyers/sellers) dominated each band.
- Structural level lines: a single reference-level layer that can be pointed at either "where trading concentrated" or "where liquidity is thin," depending on what you're looking for.