1. SESSION VOLUME PROFILE STRATEGY DESCRIPTION
An indicator that builds a per-session volume profile (POC, Value Area High/Low) from lower-timeframe intrabar data, boxed to the session's high-low range, on a user-selected session type (Tokyo, London, New York, Daily, Weekly, Monthly, Quarterly, Yearly)
1.1 Indicator Concept
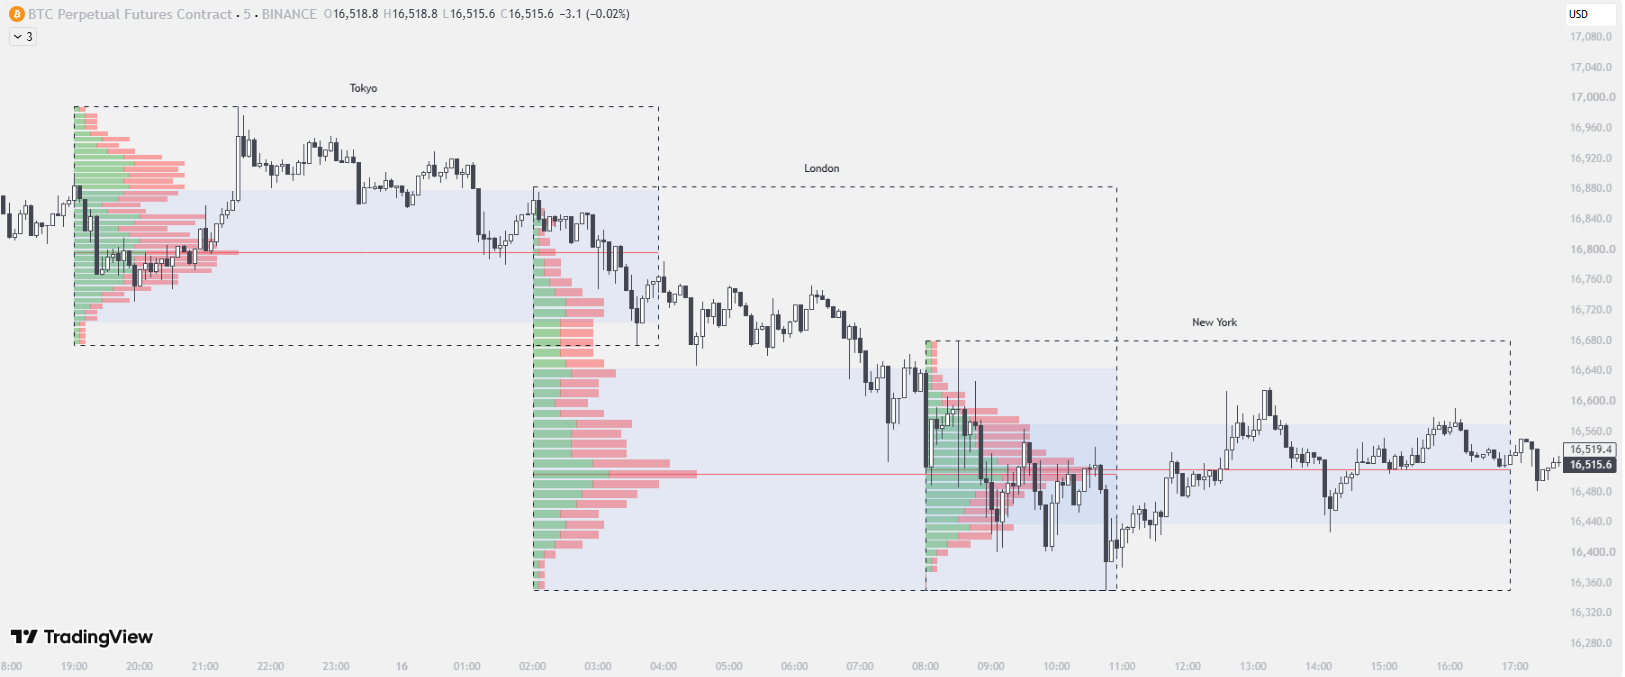
Volume profile tools normally show where volume traded across an entire chart's history or a fixed rolling window. This indicator instead segments the chart into discrete "sessions" - the user picks what a session means (a Tokyo/London/New York forex session, or a calendar Day/Week/Month/Quarter/Year) - and builds a separate, self-contained volume profile for every single session, each with its own box, Point of Control (POC), and Value Area High/Low (VAH/VAL). Scrolling back through history shows one profile per past session; the most recent, still-open session gets a live profile that keeps redrawing itself as new bars come in.
- Not real volume-at-price, but a wick-aware approximation: to build a session's profile, the script pulls the chart's own lower-timeframe intrabar candles (via request.security_lower_tf) that occurred during that session, and distributes each candle's volume across the price zones its body and wicks actually overlap - body volume goes fully to green (bull) or red (bear) depending on the candle's direction, while each wick's volume is split 50/50 between green and red (since a wick, by definition, was traded through in both directions).
- Everything resets every session: the price-zone boundaries, the accumulated green/red volume arrays, and the raw intrabar buffers are all wiped clean the instant a new session begins, so each session's profile is calculated purely from that session's own trading activity - no bleed-over from the previous session.
- Optional Open Interest mode: instead of trading volume, the profile can instead be built from the bar-to-bar change in Open Interest (for a futures symbol's synthesized "_OI" ticker), with positive changes accumulating into the green array and negative changes into the red array.
- A separate, unrelated "Forex Sessions" overlay: independently of whichever session type drives the volume profile, the indicator can also draw plain boxes (no profile) around the real Tokyo/London/New York session ranges, purely as a visual reference for session overlaps.
1.2 Indicator Features
- Session Type selector: one dropdown (sessionType) decides what a "session" is for the whole indicator - Tokyo, London, New York (UTC-hour based), or Daily/Weekly/Monthly/Quarterly/Yearly (calendar based). Only one type drives the volume profile at a time.
- Session Box: a dashed rectangle spanning each session's real high-low range, drawn once the session ends (or live, for the current one).
- Volume Profile Histogram: a horizontal, per-price-zone histogram of accumulated green (bullish) and red (bearish) volume, drawn to the right of the session box, in one of 3 display modes (stacked bull-then-bear, bull-then-bear reversed layout, or mirrored bull-right/bear-left around the box).
- POC (Point of Control) line: a horizontal line at the single price zone with the highest combined (green+red) volume for that session.
- VAH / VAL lines and Value Area Box: Value Area High and Low lines mark the price band, expanded outward from the POC, that contains a user-chosen percentage (VAwid, default 70%) of the session's total volume; an optional shaded box fills the space between VAH and VAL.
- Live Zone: the currently-forming (not yet ended) session gets its own profile that is continuously erased and redrawn on every new bar, so it always reflects the latest trading activity up to now.
- Session Label: a text label (the session type name) centered above each session's box.
- Forex Sessions overlay (no profile): optional plain boxes around the real Tokyo/London/New York high-low ranges, independent of the main sessionType setting - useful for seeing session overlaps regardless of which session drives the profile.
- Open Interest data mode: profile can be built from Open Interest delta instead of traded volume, for symbols that expose OI data.
1.3 How to Use the Indicator
- Read the POC as a magnet / fair-value price: the POC line marks where the most volume traded during that session - price often gravitates back toward it, and it can act as intrasession support/resistance.
- Read VAH/VAL as the "accepted" trading range: price closing outside the Value Area (above VAH or below VAL) suggests the session traded away from where most of the volume agreed on fair value - often interpreted as the start of an extension or imbalance move, while a return back inside VAH/VAL suggests rejection of that extension.
- Pick a sessionType that matches your trading horizon: Daily for intraday/swing reference levels, Weekly/Monthly for higher-timeframe context, or Tokyo/London/New York specifically to profile one forex trading session at a time.
- Watch the color balance of the histogram: a zone dominated by green suggests buyers were in control at that price, red suggests sellers; a POC surrounded by mixed colors suggests a battleground/rotation area.
- Tune resolution for your chart: raise it for a finer, more granular profile (at the cost of fewer full session profiles fitting on screen at once), lower it for a coarser, chunkier read that is easier to scan across many sessions.
- Enable Forex Sessions independently when you want to see Tokyo/London/New York range overlaps on the chart regardless of which session type is currently driving the volume profile.
1.4 How the Indicator Works
Inputs & Roles
- sessionType ("Session Type", options: Tokyo/London/New York/Daily/Weekly/Monthly/Quarterly/Yearly, default: "Daily"): defines what counts as one "session" - drives both the box boundaries and which volume gets grouped into each profile.
- showProf / showSbox / showPoc / showVA / showVAb / showCur / showLabels / showFx: independent display toggles for the volume histogram, session box, POC line, VAH/VAL lines, shaded Value Area box, the live/current-forming session, session text labels, and the unrelated Forex Sessions overlay, respectively.
- resolution ("Resolution", Integer, default: 30, min 5): number of equal price zones each session's high-low range is divided into. Increase → finer, more detailed profile per session, but fewer sessions' worth of profile fit on the visible chart at once. Decrease → coarser profile, more sessions visible.
- VAwid ("Value Area Volume %", Integer, default: 70, range 1-100): the percentage of a session's total volume that must be captured between VAH and VAL. Example: 70% (the industry-standard convention) means VAH/VAL expand outward from the POC, zone by zone, until 70% of that session's total volume is enclosed.
- dispMode ("Bar Mode", options: Mode 1/2/3, default: "Mode 2"): controls how the green/red histogram bars for each price zone are laid out relative to each other and the session box (side-by-side, one continuing from the other, or mirrored on opposite sides).
- volType ("Profile Data Type", options: Volume/Open Interest, default: "Volume"): switches the entire profile calculation from traded volume to Open Interest delta.
- smoothVol ("Smooth Volume Data", Boolean, default: false): replaces raw volume with a 5-period EMA of volume before profiling - helps when an asset has occasional extreme volume spikes that would otherwise dominate a single price zone.
- bullCol / bearCol / VAbCol / pocCol / vahCol / valCol / boxBg: colors for up-volume bars, down-volume bars, the shaded Value Area box, the POC line, the VAH line, the VAL line, and the session box background, respectively. Purely cosmetic, alongside matching line-thickness inputs for POC/VAH/VAL/box.
Main Logic Blocks
🎯 Flow 1: Detecting Session Start/End
- For calendar session types (Daily/Weekly/Monthly/Quarterly/Yearly), a new session begins the instant the relevant calendar field changes (e.g. dayofweek for Daily) - for these types, the session's "end" is defined as the same event as the next session's "start" (no gap).
- For Tokyo/London/New York, start and end are separate UTC-hour thresholds (e.g. London starts at hour ≥ 7 UTC, ends at hour ≥ 16 UTC) - there can be a gap between one session's end and the next one's start.
📥 Flow 2: Collecting Intrabar Data
- Every bar, request.security_lower_tf fetches that bar's underlying lower-timeframe open/high/low/close/volume candles, and updateIntra() appends them to five running arrays ( ltfOpen/ltfHigh/ltfLow/ltfClose/ltfVolume) that accumulate for as long as the current session is open.
🧮 Flow 3: Building the Volume Profile (profileAdd / get_vol)
- When a session needs (re)calculating, calcSession() first splits that session's high-low range (profHigh/profLow) into resolution equal price zones, then replays every buffered intrabar candle through profileAdd().
- For each candle, get_vol() computes how much of a price segment (body, top wick, or bottom wick) geometrically overlaps a given zone, as a fraction of that segment's total range, and allocates that same fraction of volume to the zone. The candle's body volume goes entirely to vpGreen (if bullish) or vpRed (if bearish); each wick's volume is split 50/50 into both arrays, since price traversed that wick in both directions.
- In Open Interest mode, this geometric wick-splitting is skipped - a positive OI delta bar adds its full value to vpGreen at the zone(s) its body overlaps, a negative delta bar adds its magnitude to vpRed.
🎯 Flow 4: POC and Value Area
- pocLevel() scans every zone's combined vpGreen + vpRed volume and returns the midpoint price of whichever zone has the largest total - this is the POC.
- valueLevels(poc) then walks outward from the POC's zone one step at a time in both directions (up toward VAH, down toward VAL), accumulating volume from each newly included zone, until the running total reaches VAwid% of the session's total volume - the last zone boundaries included become VAH and VAL.
🖌️ Flow 5: Drawing - Finished vs Live Sessions
- drawNewZone() runs the instant a session ends (zoneEnd = true) and draws that session's box, histogram, POC, VAH/VAL, and Value Area box permanently at its historical position - these drawings are never touched again.
- drawCurZone() handles the currently open session (only when showCur is on): on every new live bar it deletes the previous "live" drawings (lines, boxes, label) it created and redraws them fresh from the latest accumulated volume, so the in-progress profile always reflects the most recent bar. The moment that session ends, its temporary live drawings are deleted for good (handed off to drawNewZone()'s permanent version instead).
🔄 Flow 6: Resetting Between Sessions
- resetProfile() fires whenever a new session starts - it zeroes out vpGreen/vpRed and clears all five intrabar buffer arrays, so the next session's profile is built purely from its own trading activity.
🌍 Flow 7: Forex Session Boxes (independent overlay)
- Regardless of sessionType, the script separately tracks the real running high/low of the current Tokyo/London/New York window at all times; the moment each one's UTC-hour end threshold is crossed (and showFx is on), drawForexBox() draws a plain dashed box (no profile) spanning that session's actual high-low.
Outputs & Usage Roles
- Session box: at-a-glance high/low range for every session of the chosen type.
- POC line: the single most-traded price within each session - a candidate support/resistance/magnet level.
- VAH/VAL lines + Value Area box: the "fair value" band each session traded in; closes outside it flag potential imbalance/extension.
- Volume histogram: visualizes exactly how buy/sell volume distributed across price within each session.
- Live Zone: a continuously-updating read on the still-open session, without waiting for it to close.
- Forex Sessions overlay: a session-overlap reference independent of the main profile setting.