1. Trend Pulse Strategy Description
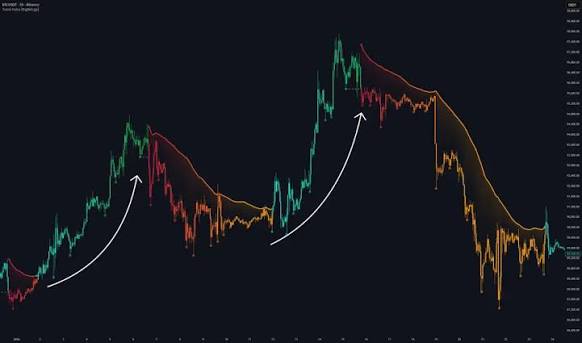
An indicator that determines trend direction with an intentionally ASYMMETRIC breakout logic: bearish when price breaks below the nearest confirmed pivot low, bullish when price breaks above an adaptive band that widens as the trend ages; candles are colored by trend direction and how "old" the trend is.
1.1 Indicator concept
The indicator uses a trend-confirmation logic that is deliberately asymmetric between the two directions. Bearish confirmation follows classic price-structure logic — as soon as the close price breaks below the most recently confirmed pivot low, the trend is immediately flipped bearish; fast and sensitive. Bullish confirmation, on the other hand, is much stricter: price must break above an "Adaptive Band" = a moving average of highs (SMA of High) plus a volatility buffer (ATR) — and this band keeps WIDENING the longer the bearish trend has been running, making a flip back to bullish harder and harder to trigger over time.
The underlying philosophy: downmoves tend to happen fast and decisively (so breaking one simple structural level is enough of a signal), while a bounce inside a downtrend is more often a false technical rally than a genuine reversal — so bullish confirmation needs an increasingly tighter bar as the trend ages, to avoid being fooled by short-lived bounces. Beyond just determining direction, the indicator also measures the "age" of the current trend (bars since the last flip) to gradually shade candles from a "fresh" state to a "mature/exhausted" state over time.
1.2 Indicator features
- Trend-colored candles: every candle on the chart is recolored (body, wick, and border) based on the current trend direction — teal (Bullish - just flipped) gradually shifting to deeper green (Bullish - aged), or red (Bearish - just flipped) gradually shifting to orange (Bearish - aged). The still-forming (unclosed) candle is left uncolored.
- Adaptive Band: a thick moving-average line, shown ONLY during the bearish phase, sitting above the recent high zone — acting as a dynamic resistance level; paired with a shaded fill between this band and price.
- Live pivot-tracking line: during the bullish phase, a faint dashed horizontal line automatically connects from the most recent pivot low and keeps extending to the right on every new bar — this is the support level the indicator is actively "guarding".
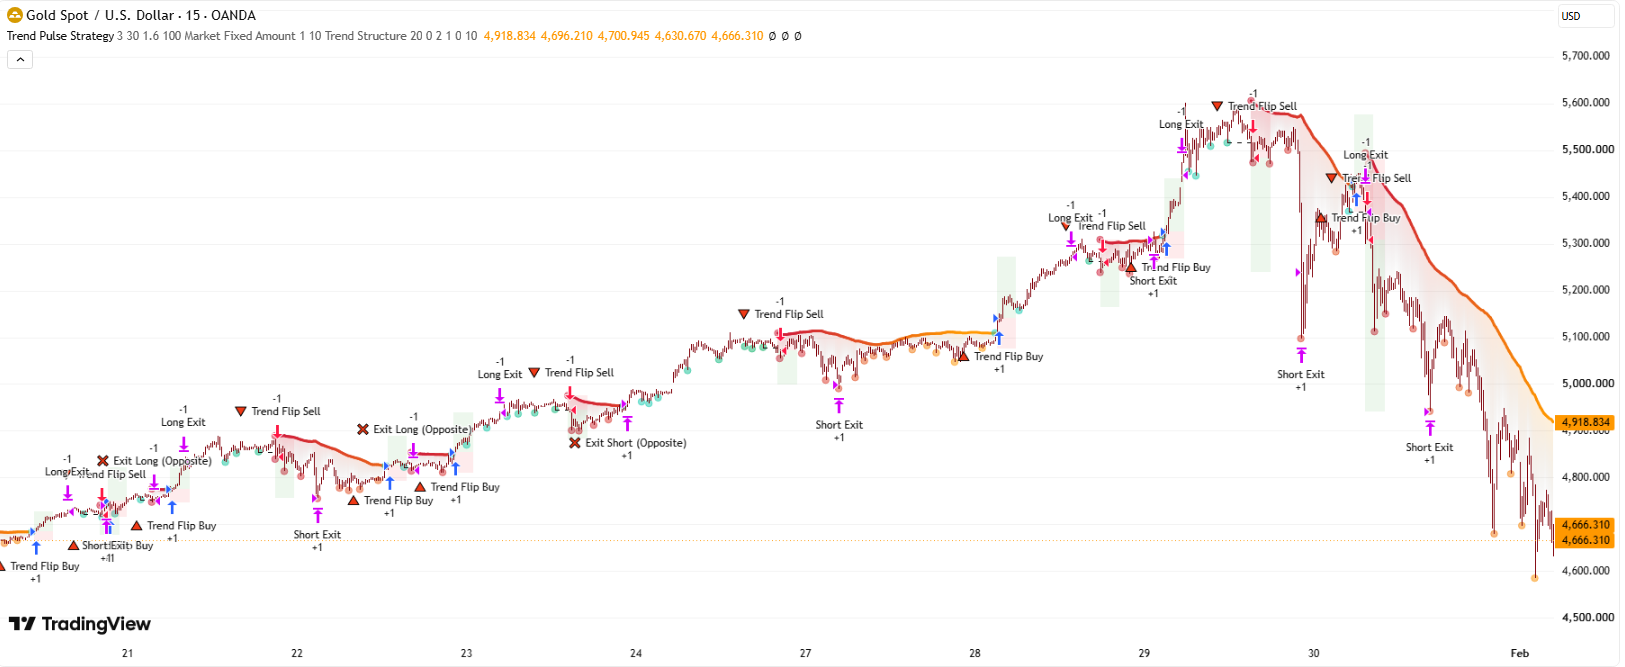
- 3 small circle markers: flagging (a) every newly confirmed pivot low, (b) the exact bar where a breakdown just occurred (flip to bearish), (c) the exact bar where a breakup just occurred (flip to bullish).
- Alert: the indicator has NO alert feature (no alertcondition() or alert() call) — it's purely visual; automating it requires adding your own alert logic based on the breakdown/breakup plotshapes.
1.3 How to use it in trading
- Read candle color to instantly know whether you're in a bullish or bearish phase, with no need for a secondary indicator; watch how "deep/aged" the color has become to gauge how long the trend has run — the closer the color gets to its Mature state, the more caution is warranted before adding new trend-following positions, or the more worth considering scaling out.
- During the bearish phase: treat the Adaptive Band (the thick line above the candles) as a live resistance level — only consider new Long entries once price closes decisively above this band (right when the "Break Up" marker appears); the wider the band has grown (the older the downtrend), the more decisive the breakout needs to be to be trusted.
- During the bullish phase: treat the dashed line tracking the most recent pivot low as a live support level, usable as a Stop Loss reference for a Long position — if price closes below this line (the "Break Down" marker appears), the trend has officially flipped bearish.
- The circle marker at each pivot low gives a visual confirmation of exactly which low the indicator is currently tracking, without needing to eyeball it yourself.
- Raise pivLen if you want more reliable pivots (less prone to false lows) — at the cost of later confirmation; raise smaMax/smaMult if you want the bearish trend to need to run longer/stronger before being considered reversed (fewer false-bounce whipsaws, but also a later entry when a genuine reversal does happen).
1.4 How the indicator works
Inputs & their role
- pivLen (integer, default 5): bars required on each side to confirm a swing low (pivot low) — this level is then used as the breakdown threshold for flipping bearish. E.g. pivLen=5: a low at bar X is only confirmed after 5 more bars pass with none of them making a lower low than X — meaning the pivot signal always lags exactly 5 bars behind the moment the actual low formed. Raising it to 10 gives more reliable pivots (fewer false lows) but noticeably more lag; lowering it to 3 detects faster but is more prone to false lows, causing the support line to jump around erratically.
- smaMax (integer, default 50, min 5): the ceiling that the Adaptive Band's moving-average length (len) is allowed to grow toward while a bearish trend is ongoing. E.g. by bar 45 since the downtrend started, len has gradually grown and hit the cap of 50 (if smaMax=50), then stops growing no matter how much longer the downtrend continues.
- smaMult (decimal, default 1.0, min 0, step 0.1): the multiplier applied to ATR(50) that creates the buffer above the SMA-of-High band. E.g. ATR(50)=15, smaMult=1 → band = SMA(high,len) + 15 points; raising it to 2 → band = SMA(high,len) + 30 points, pushing the breakout threshold further away and requiring a stronger rally to trigger a reversal; lowering it to 0 → the band becomes exactly SMA(high,len) with no buffer at all, much easier to break above.
- trendLen (integer, default 100): number of bars for candle color to fully transition from "Fresh" (just flipped) to "Mature" (aged). E.g. at bar 5 after a flip, color is 100% Fresh; from bar 100 onward, color is 100% Mature; bars in between are interpolated proportionally to how far along trendLen they are. Raising it to 200 slows the color transition way down, requiring a very long trend before it's considered old; lowering it to 30 speeds it up, so roughly a month of H1 data is enough to call the trend mature.
- upColor / upColor1 (color, default ■ #18d0bd / ■ RGB(13,169,75)): candle & marker color during a BULLISH trend, corresponding to the just-flipped (Fresh) and long-running (Mature) states respectively.
- dnColor / dnColor1 (color, default ■ #cf1d3a / ■ orange): same idea but for a BEARISH trend.
Main logic blocks
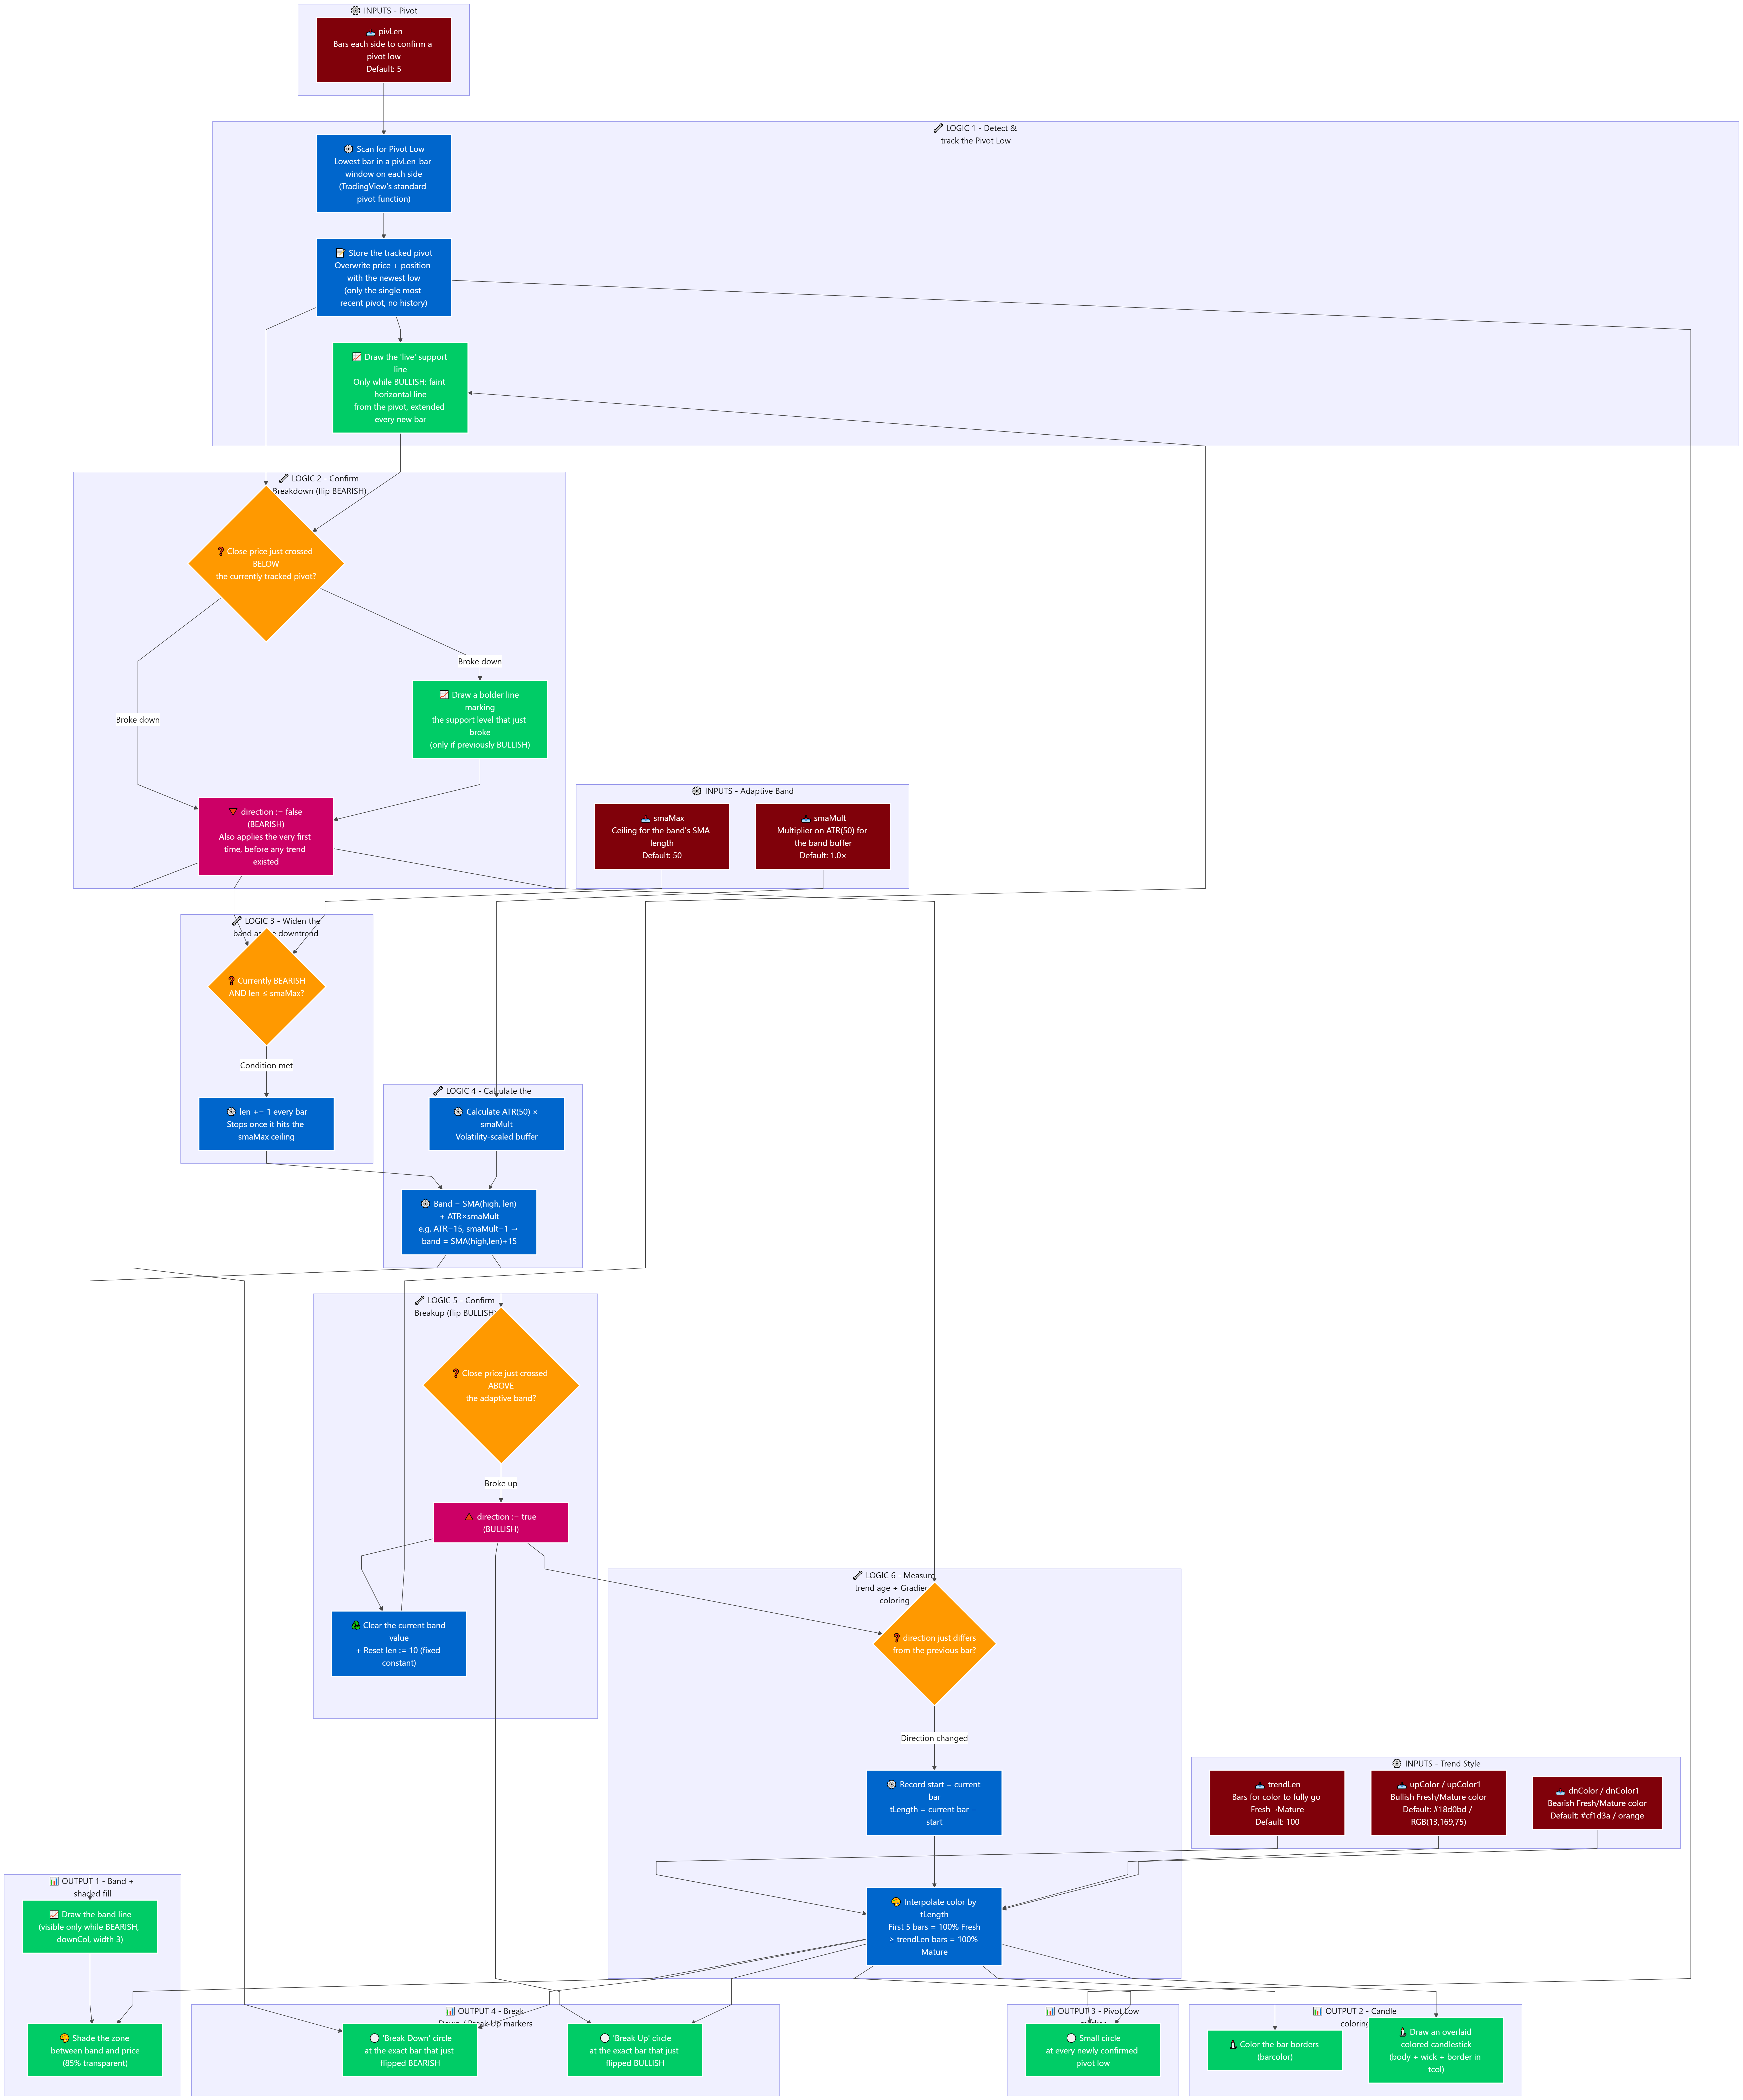
- Working backward from what's displayed: everything a trader sees — candle color, the band, the shaded fill, the pivot-tracking line, the 3 markers — all originate from exactly ONE variable, direction (true=bullish / false=bearish), which is only ever updated by 2 breakout events: a break DOWN below the tracked pivot, or a break UP above the adaptive band.
- Pivot-low detection layer: on every bar, the indicator uses TradingView's standard pivot function to check whether the bar exactly pivLen bars back is the lowest bar within a pivLen-bar window on each side. If so, that low's price and position are stored as the "currently tracked pivot" — OVERWRITING the previous one (only the single most recent pivot is remembered at any time; there's no history array of multiple pivots).
- Pivot-tracking line layer: while in a bullish trend, every time a new pivot is confirmed, the indicator draws a faint horizontal line starting at that pivot's position; the line keeps extending to the right on every new bar, acting as the "live support level".
- Breakdown-confirmation layer (bearish): on every closed bar, the indicator checks whether the close price just crossed BELOW the currently tracked pivot. If so: (a) if the trend was previously bullish, it also draws a bolder horizontal line marking exactly which support level just broke (spanning from the pivot's position to the current bar), (b) direction is set to false (bearish) — even the very first time, before any trend had been established, this first pivot break locks in the initial state as "bearish".
- Band-widening-with-trend-age layer: on every bar still in the bearish phase, the "len" used to compute the High moving average automatically grows by 1 each bar, until it hits the smaMax ceiling and stops — meaning the band becomes progressively "smoother" and tracks a wider high zone (a longer average reacts more slowly to short-term moves), making a breakout progressively harder as the downtrend ages.
- Adaptive-band calculation layer: on every bar, band = the SMA(high, len) moving average PLUS ATR(50)×smaMult — producing a resistance threshold sitting above the recent high zone, offset by a buffer scaled to the market's current volatility.
- Breakup-confirmation layer (bullish): on every closed bar, the indicator checks whether the close price just crossed ABOVE the band. If so: direction is set to true (bullish), the current band value is CLEARED (the band is only meaningful during the bearish phase, so it's hidden while bullish), and len is RESET to exactly 10 bars (a fixed constant, not the original starting value) to get ready for the next bearish phase to start fresh.
- Trend-age + gradient-color layer: whenever direction differs from the previous bar, the indicator records that bar's position as the new trend's starting mark. Bars elapsed since that mark are used to interpolate color proportionally: from the first 5 bars (100% Fresh color) up to a full trendLen bars (100% Mature color), using whichever color pair matches the current trend direction.
- Rendering layer: the color computed above is used to paint every candle (both via barcolor and a separately drawn candlestick overlay in that color), to draw the adaptive band with its shaded fill (visible only during the bearish phase), and to place the 3 small circle markers at: (1) every newly confirmed pivot low, (2) the exact bar that just flipped to bearish, (3) the exact bar that just flipped to bullish.
Outputs & how they're used
- Candle color (trend-age gradient): lets the trader instantly recognize whether the market is bullish or bearish, and how "old" that trend has become, with a single glance — no extra indicator or calculation needed.
- Adaptive band + shaded fill: a dynamic resistance level during the bearish phase — a reference point for both waiting on a bullish breakout and placing a Stop Loss on a Short position.
- Live pivot-tracking line: a dynamic support level during the bullish phase — a Stop Loss reference for a Long position, and an early warning of a possible reversal.
- 3 circle markers: pinpointing exactly when a low was confirmed, when a breakdown occurred, and when a breakup occurred — visual anchors so the trader doesn't have to re-derive the signal by hand on the chart.