1. HTF Candle Architecture Strategy description
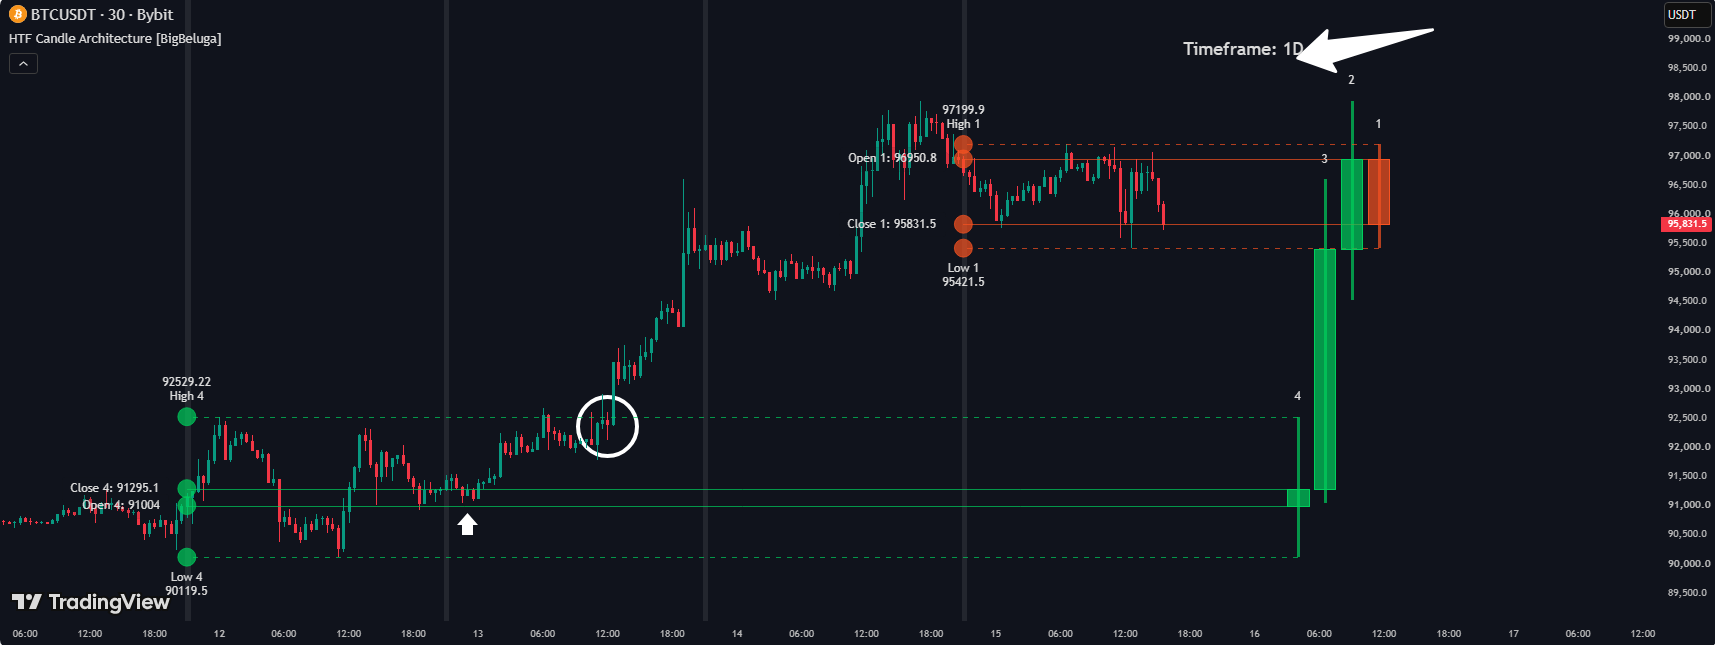
An indicator that rebuilds up to 4 recent higher-timeframe (HTF) candles as mini-candles drawn at the right edge of the chart, and draws projection lines connecting each Open/High/Low/Close level back to the exact real historical position where it occurred on the current lower-timeframe chart.
1.1 Indicator concept
In Multi-Timeframe Analysis, the Open/High/Low/Close levels of a HIGHER-timeframe candle (e.g. Daily, Weekly) often act as important support/resistance zones for price action on the SMALLER timeframe being actively traded. But switching the whole chart to that higher timeframe to see them means losing all the fine candle detail on the timeframe you're actually watching. This indicator solves that by rebuilding up to 4 recent HTF candles as mini-candles drawn on top of the right edge of your own lower-timeframe chart, while also drawing horizontal lines that project each O/H/L/C level backward to the exact real historical position where it actually occurred — turning abstract higher-timeframe OHLC numbers into concrete price lines you can trade off of directly on the chart you're already looking at.
1.2 Indicator features
- 4 higher-timeframe mini-candles: draws up to 4 synthetic candles side by side at the right edge of the chart — Candle 1 = the HTF candle currently forming (real-time), Candle 2/3/4 = progressively older closed candles. Each candle has a body (Open-Close, a box) plus upper/lower wicks (High-Low, a line), colored green (bullish) or orange (bearish), labeled with its number (1/2/3/4) below the wick for identification.
- Backward price-level projection lines: for each independently-toggled O/H/L/C level, draws a horizontal line connecting the exact real historical position (where that price level actually occurred on the lower-timeframe chart) over to its corresponding mini-candle — turning an HTF price value into a concrete reference line directly on the chart you're viewing.
- Value labels: (optional, via "Labels") prints the exact numeric value of each High/Low/Open/Close level right at its historical anchor point; a small circle marker is always shown at that spot regardless of the text-label setting.
- HTF boundary shading: lightly shades the background of the exact bar where a new higher-timeframe period begins, for a quick visual read of HTF boundaries directly on the lower-timeframe chart.
- Timeframe name label: displays "Timeframe: [XH/XD/XM]" above the whole cluster of 4 candles.
- Alert: the indicator has NO alert feature — it's purely visual.
1.3 How to use it in trading
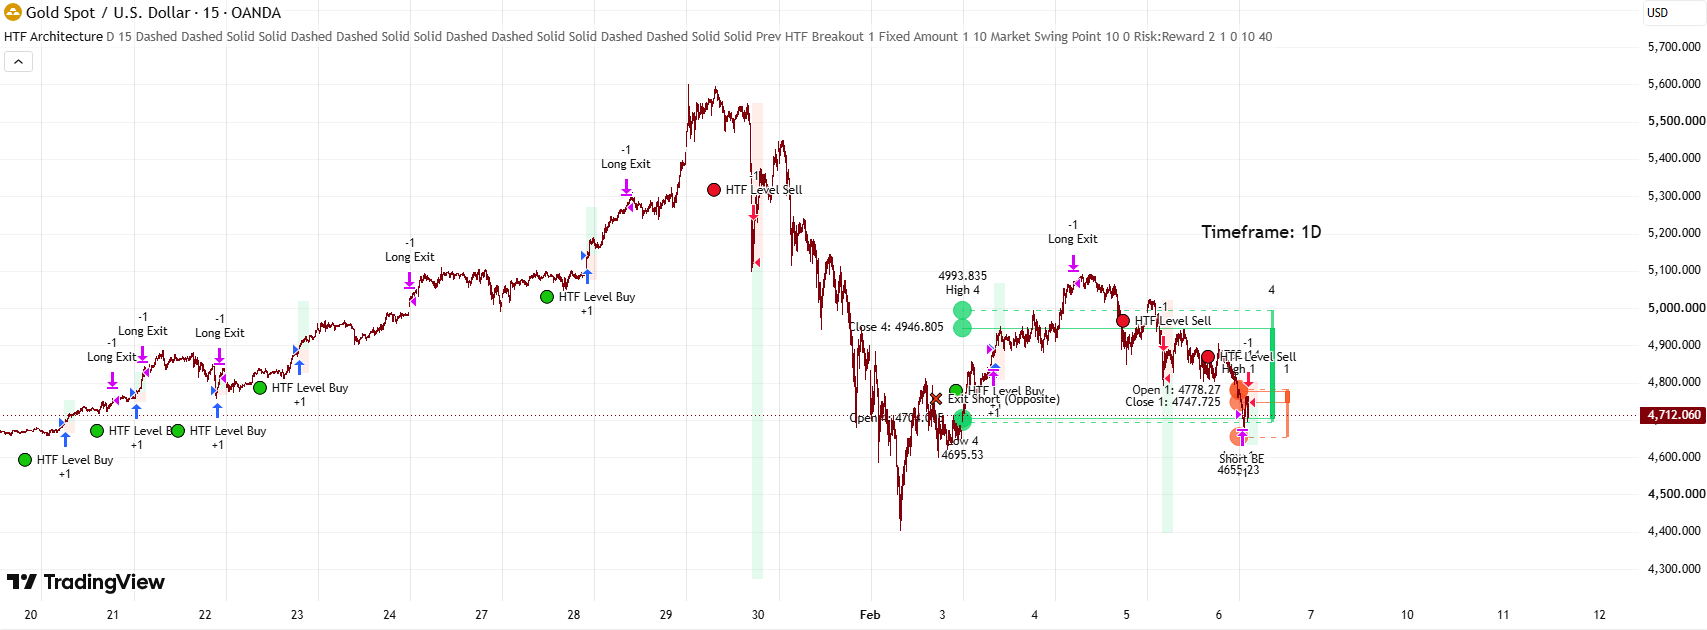
- Use the O/H/L/C projection lines directly on your lower-timeframe chart as support/resistance reference zones from the higher timeframe (e.g. trading M15 but taking the Daily candle's exact High/Low as your Target/Stop Loss) without ever switching to view the Daily chart.
- Only enable the specific price levels you actually need (e.g. just H and L, off O and C) to avoid cluttering the chart with too many lines at once.
- By default only Candle 1 (currently forming) and Candle 4 (3 periods back) are on — useful for quickly comparing the current price position against a further-back reference point without cluttering the chart with all 4 candles at once; enable Candle 2/3 as well if you want the full sequence of the last 4 periods.
- Change the Timeframe input to whatever suits your style (e.g. Weekly if trading Daily, H4 if trading M15) to always have the right higher-timeframe reference levels on hand.
- Raise "offset" if you want the mini-candle cluster pushed further from the chart's right edge, to avoid it overlapping the most recent real candles.
- Enable "Labels" when you need to read the exact O/H/L/C numbers; turn it off if you only need the reference lines themselves without the numeric text (less visual clutter).
1.4 How the indicator works
Inputs & their role
- tf (Timeframe, default "D" - Daily): the LARGER timeframe used to build the mini-candles. E.g. viewing an M15 chart but setting tf="D" → the indicator reconstructs a Daily candle by aggregating all M15 bars that occurred within the same day.
- offset (integer, default 15): horizontal distance (in bars) ADDED to every mini-candle's position, pushing the whole 4-candle cluster further away from the chart's real right edge. Raising it pushes the cluster further out; lowering it toward 0 places the cluster right next to the last real candle.
- candle1_lvl / candle2_lvl / candle3_lvl / candle4_lvl (checkbox, default true/false/false/true respectively): the master switch for EACH individual mini-candle. Candle 1 = the HTF candle currently forming (real-time); Candle 2 = the most recently closed HTF candle; Candle 3 = the one before that; Candle 4 = the oldest of the 4 (3 periods back). Turning off a candle removes it ENTIRELY (body, wicks, every projection line, every label).
- H/L/O/C (individual checkbox per candle, default H/L/C/O all true) + matching line style (Dashed/Solid/Dotted, default H/L=Dashed, O/C=Solid): toggles and styles the corresponding High/Low/Open/Close projection line for that candle. E.g. turning off O1 and C1 on Candle 1 leaves only the High/Low projection lines for the forming candle, cutting clutter when you only care about the top/bottom range.
- bullCol1-4 / bearCol1-4 (color, default ■ RGB(0,207,93) / ■ RGB(248,83,33)): body+wick+projection-line color for each candle by direction; each candle can be given a different color (e.g. progressively fading for older candles) for easy visual distinction.
- lbls ("Labels" checkbox, default true): the MASTER switch for every text label showing O/H/L/C numeric values (does NOT affect the projection lines or the circle markers — those still show as long as the matching H/L/O/C toggle is on). Turning lbls off leaves only lines + circle markers, no numeric text.
Main logic blocks
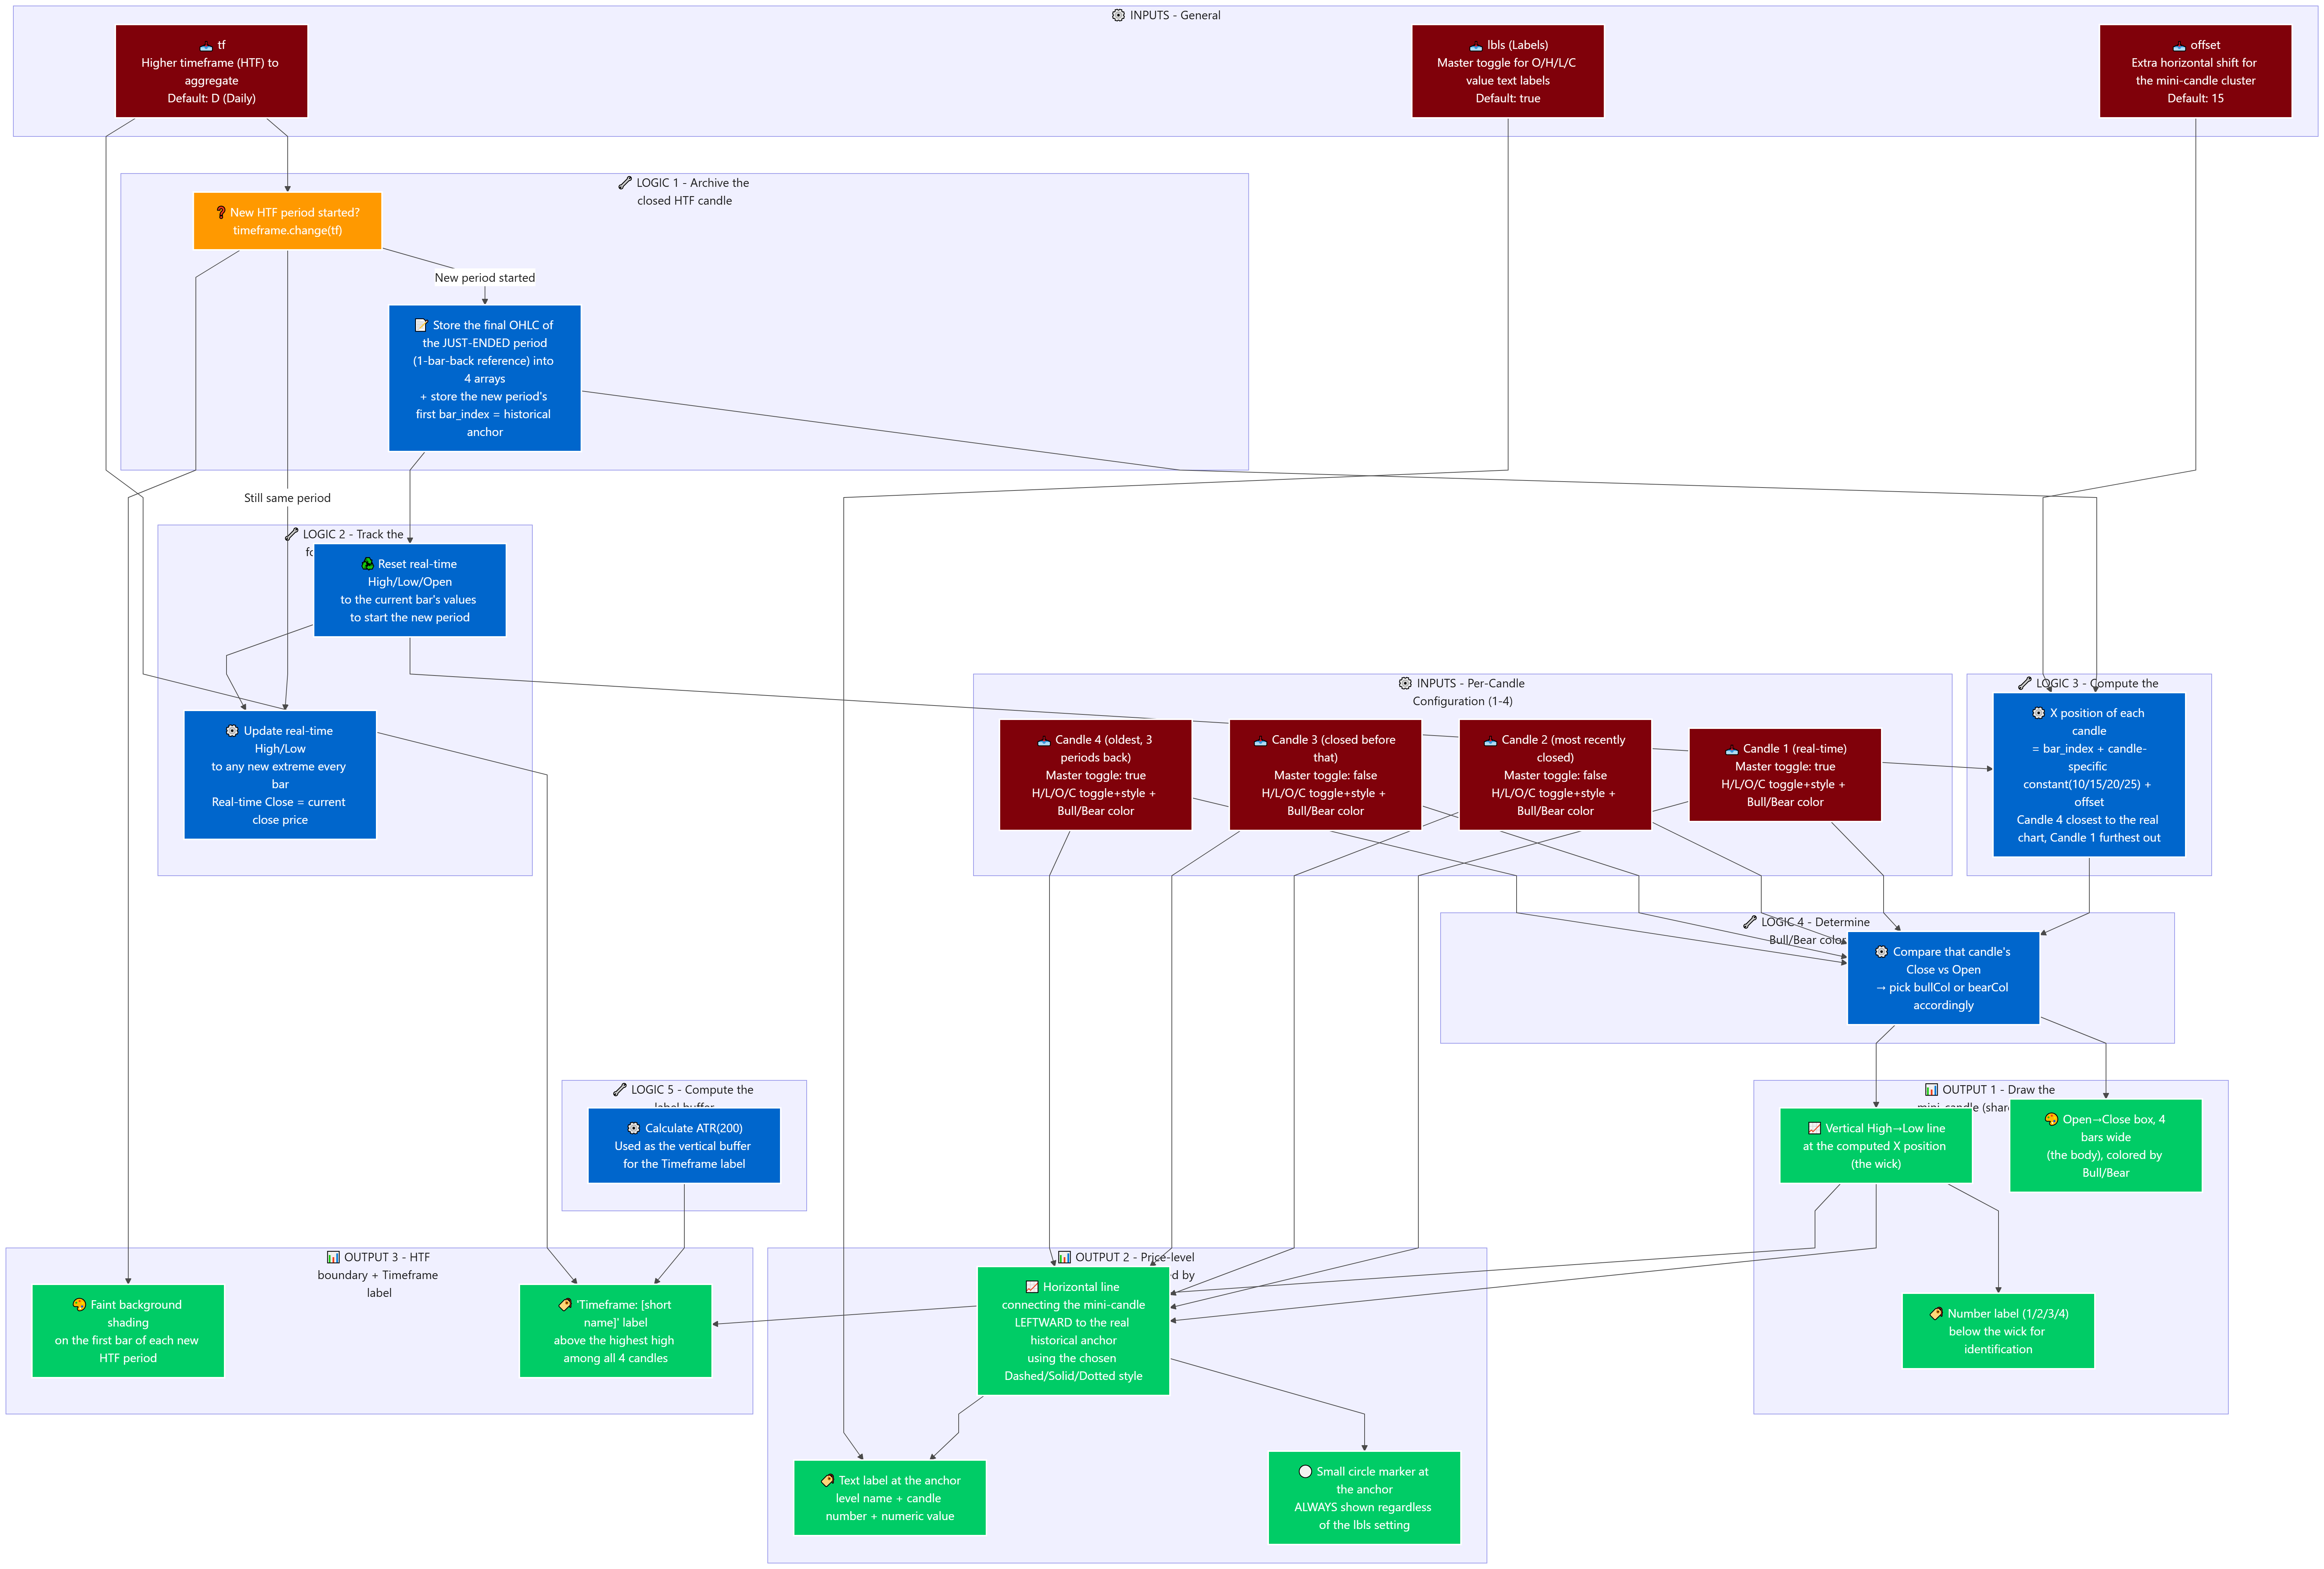
- Working backward from what's displayed: all 4 mini-candles + projection lines + labels are REDRAWN FROM SCRATCH every time the chart's last bar gets a new tick (the code only runs inside the barstate.islast branch) — every new drawing automatically deletes the previous tick's version of itself (a continuous delete-and-redraw technique), so nothing accumulates and everything stays in sync with the latest data.
- Closed-HTF-candle archiving layer: every time a new higher-timeframe period is detected, the indicator grabs the FINAL High/Low/Open/Close of the period that JUST ended (using a 1-bar-back reference to capture the completed value before it gets overwritten) and pushes it into 4 separate storage arrays (Open/Close/High/Low), together with the bar_index of the FIRST bar of the new period — this position is later used as the "real historical anchor" that the projection line is drawn back to.
- Forming-candle tracking layer: right after archiving the old period, the real-time High/Low/Open variables are reset to the current bar's own values to start tracking the new period; from then on, every bar (whether it's a period boundary or not) updates real-time High/Low to any new extreme — real-time Close is always just the current bar's close price.
- Mini-candle positioning layer: the 4 draw calls run in order from OLDEST (Candle 4, whose data comes from 4 elements back in the array) to NEWEST (Candle 1, whose data comes directly from the real-time variables, bypassing the array) — each candle's horizontal position = the current bar_index + a fixed offset specific to that candle (10/15/20/25) PLUS the user's offset input — placing Candle 4 closest to the real chart edge (left) and Candle 1 furthest out (right).
- Single mini-candle drawing layer (shared by all 4): if the candleN_lvl toggle is off, nothing is drawn for that candle at all. If on: determine color from Close vs Open; draw a vertical line as the wick (High→Low) at the computed X position; draw a 4-bar-wide box as the body (Open→Close); attach a small number label (1/2/3/4) below the wick for identification.
- Per-level projection-line drawing layer (shared by H/L/O/C, repeated independently up to 4 times if all are on): if that price-level toggle is on, draws a horizontal line connecting the mini-candle's X position LEFTWARD to the real historical bar_index (the anchor stored in the layer above) — using whichever line style (Dashed/Solid/Dotted) was chosen; if lbls is on, adds a text label at the historical anchor showing the level name + candle number + numeric value; a small circle marker is ALWAYS added at the anchor regardless of the lbls setting.
- Boundary marking + timeframe label layer: shades the background of the exact first bar of each new HTF period (a quick visual boundary marker on the main chart); computes ATR(200) as a vertical buffer, and places a "Timeframe: [short name]" label above the highest high among all 4 candles, right at the cluster's right edge.
Outputs & how they're used
- 4 synthetic mini-candles: lets you observe the shape of the last 4 higher-timeframe candles (currently forming + up to 3 previously closed) without ever leaving the timeframe you're actually trading.
- O/H/L/C projection lines back to real history: turns abstract higher-timeframe price levels into concrete reference lines directly on the lower-timeframe chart — usable directly as support/resistance zones or as SL/TP levels from the higher timeframe.
- Value labels + circle markers: a quick lookup of the exact value and historical position of each level, without switching timeframes or hovering over the real candle.
- HTF boundary shading: a fast visual read of where one higher-timeframe period ends and the next begins, right on the main chart — helping you match lower-timeframe price action to the correct HTF period.