1. HTF VOLUME SPIKE [HVS] — STRATEGY description
An indicator that "looks inside" a higher-timeframe (HTF) candle using much lower-timeframe (LTF) data, then projects the whole analysis (mini-candle + volume-spike bubbles + Imbalance zones + Volume Profile) as a visual diagram right next to the chart, without switching timeframes.
1.1 Indicator concept
When a trader zooms up to a higher timeframe (e.g. Daily) to see the bigger picture, they lose all detail about HOW price moved inside that one large candle — specifically, where unusual volume (a spike) clustered, and how many times large orders piled into the SAME price level in the SAME direction (a phenomenon called an Imbalance in order-flow analysis). This indicator solves exactly that: it quietly pulls data from a MUCH LOWER timeframe (LTF) to examine every micro-move inside the HTF candle that's currently forming, flags LTF bars whose volume clearly exceeds average, and then projects all of that analysis as a visual diagram displayed right to the right of the current chart — no need to leave the timeframe you're actually trading to see what's "inside" the big candle.
1.2 Indicator features
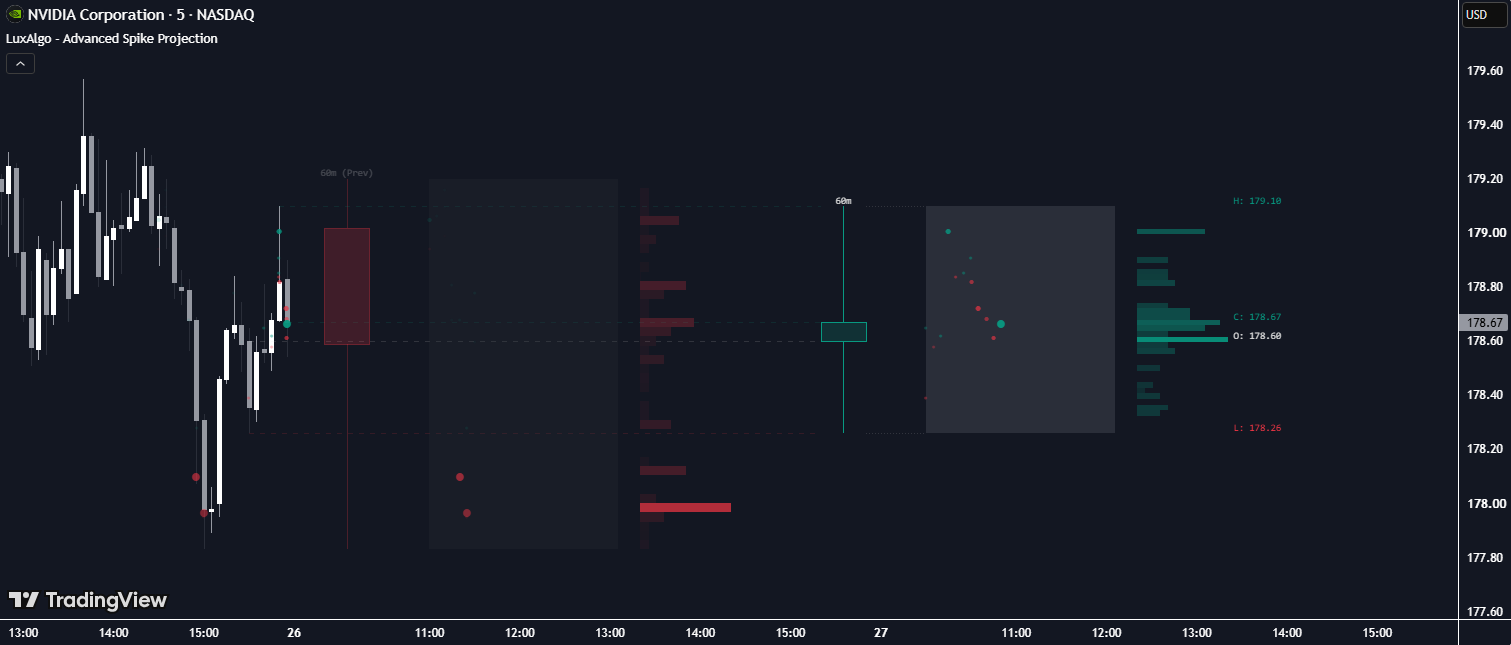
- Projection Block: a diagram drawn at the right edge of the chart consisting of: a mini-candle (body + wicks) representing the HTF candle currently forming, a dotted-outline frame containing round "bubbles" — each bubble is one LTF volume spike, sized by relative volume, colored teal (bullish) or red (bearish) with intensity scaled by volume; shaded "Imbalance" cells where ≥3 same-direction spikes stacked into the same price zone; and a Volume Profile strip (horizontal bars) showing which price zone traded the most volume.
- "Ghost" projection block (previous candle): optionally shows an additional, more transparent projection block for the HTF candle right BEFORE the current one, placed next to the current block for comparison.
- Direct overlay on the historical chart: optionally draws the same spike bubbles AND Imbalance cells directly on top of the real historical candles of the chart's own timeframe (not just inside the projection block).
- Anchor connector lines: 4 dashed horizontal lines connecting the real Open/High/Low/Close positions on the chart to the start of the projection block, so you can visually confirm which real HTF candle the abstract projection corresponds to.
- O/H/L/C value labels: print the exact numeric Open/High/Low/Close of the still-forming HTF candle right next to the projection block.
- Alert: the indicator has NO alert feature (no alertcondition() or alert()) — it's purely visual.
1.3 How to use it in trading
- Look at the projection block on the right of the chart to see what's happening "inside" the currently-forming higher-timeframe candle (e.g. Daily) WITHOUT switching to the Daily chart and losing the fine detail of the timeframe you're actually trading.
- Pay attention to the Imbalance cells (shaded) in the projection block or directly on the chart — these mark a price zone with 3 or more abnormal-volume prints stacked in the same direction, typically a sign of large/institutional order flow accumulating aggressively at that exact level — usable as a candidate support/resistance zone or as a reference point for entering in the direction of that flow.
- Watch the Volume Profile strip (the brightest single bar) to find the price zone with the highest traded volume (Point of Control) within the current HTF candle — this zone tends to act as a "magnet" that price gravitates back toward.
- Enable "Show Ghost" to compare the volume structure of the HTF candle that JUST closed against the one currently forming, to judge whether order flow is continuing in the same direction or has reversed.
- Enable "Show Bubbles/Imbalances on Chart Candles" if you'd rather see everything directly on the main chart without glancing over at the projection block — useful for a quick read without taking your eyes off price.
- Manually pick an HTF Anchor Timeframe (instead of Auto) if you always want to examine one specific timeframe (e.g. always anchor to Daily even while viewing a 15-minute chart).
- Raise the Volume Spike Multiplier if the chart gets too cluttered with bubbles (keeping only the truly abnormal spikes); pick a smaller Spike Granularity if you want an even finer look at order flow.
1.4 How the indicator works
Inputs & their role
- htfInput (HTF Anchor Timeframe, default "Auto", options Auto/15/30/60/240/D/W/M): the LARGER timeframe used as the "anchor" for aggregating candles. If left on Auto, the indicator picks it based on the chart's own timeframe — e.g. viewing an M5 chart (multiplier=5, not <5) → auto-anchors to H1; viewing an M15 chart → auto-anchors to H4; viewing a Daily chart → auto-anchors to Weekly. Manually picking a specific timeframe forces the indicator to always anchor to that one regardless of the chart you're viewing.
- ltfInput (Spike Granularity, default "Auto", Auto/1/3/5/15/60/240): the SMALLER timeframe used to examine every micro-move inside the HTF candle to detect volume spikes. Auto picks based on the chart timeframe: e.g. viewing ≥H1 → uses M5; viewing anything smaller than H1 → uses M1. The smaller the LTF, the finer the look at order flow, but it also hits the 450-sample-per-HTF-period cap sooner when the HTF candle runs long.
- spikeMultInput (Volume Spike Multiplier, default 1.2, min 1.0, step 0.1): the multiplier applied to average volume (SMA) for an LTF bar to count as a "spike". E.g. volume SMA=1000, spikeMultInput=1.2 → an LTF bar needs volume ≥1200 to register as a spike; raising it to 2.0 → only very strong volume outliers (double the average) get counted, sharply reducing the number of bubbles shown.
- maLenInput (Volume MA Length, default 20, min 5): number of LTF bars used to compute the volume moving average that spikes are compared against. Raising it smooths the average, making it less sensitive to 1-2 recent volume outliers; lowering it makes the average react faster to recent volume changes, so the spike threshold shifts more dynamically.
- showGhostInput (default true): toggles drawing the projection block for the HTF candle right BEFORE the one currently forming.
- showImbInput (default true): toggles drawing the Imbalance cells inside the projection block.
- showHtfConnLinesInput (default true): toggles the 4 dashed connector lines from the real O/H/L/C positions on the chart to the projection block.
- showChartSpikesInput (default true): toggles drawing spike bubbles directly on top of the real historical candles on the chart.
- showChartImbInput (default true): toggles drawing Imbalance cells directly on top of the real price range of the HTF candle on the chart.
- projOffsetInput (Projection X-Offset, default 5, min 1): number of empty bars from the chart's last bar to where the projection block starts. Raising it pushes the projection block further away from the main chart.
- scatterWidthInput (Scatter Plot Width, default 25, min 10): width (in bars) of the scatter area holding the spike bubbles. Raising it spreads the bubbles out more, making individual points easier to see when there are many spikes.
- vpRowsInput (VP Row Density, default 40, min 10): number of price bins used for both the Volume Profile and Imbalance detection. Raising it makes each bin thinner (higher price resolution), but requires more spikes to reach 3 in a single bin for it to count as an Imbalance; lowering it makes bins thicker, easier to qualify as an Imbalance but with less precise price location.
- vpWidthInput (VP Max Width, default 12, min 5): maximum length (in bars) of the longest Volume Profile bar (the bin with the highest volume — Point of Control); all other bars scale proportionally against this one.
- bullColorInput / bearColorInput (color, default ■ #089981 / ■ #f23645): the base color used for EVERY bullish/bearish element throughout the indicator (mini-candle, bubbles, imbalance, volume profile).
- projBgColorInput (color, default dark gray, 60% transparent): the background color of the rectangle framing the bubble scatter area.
Main logic blocks
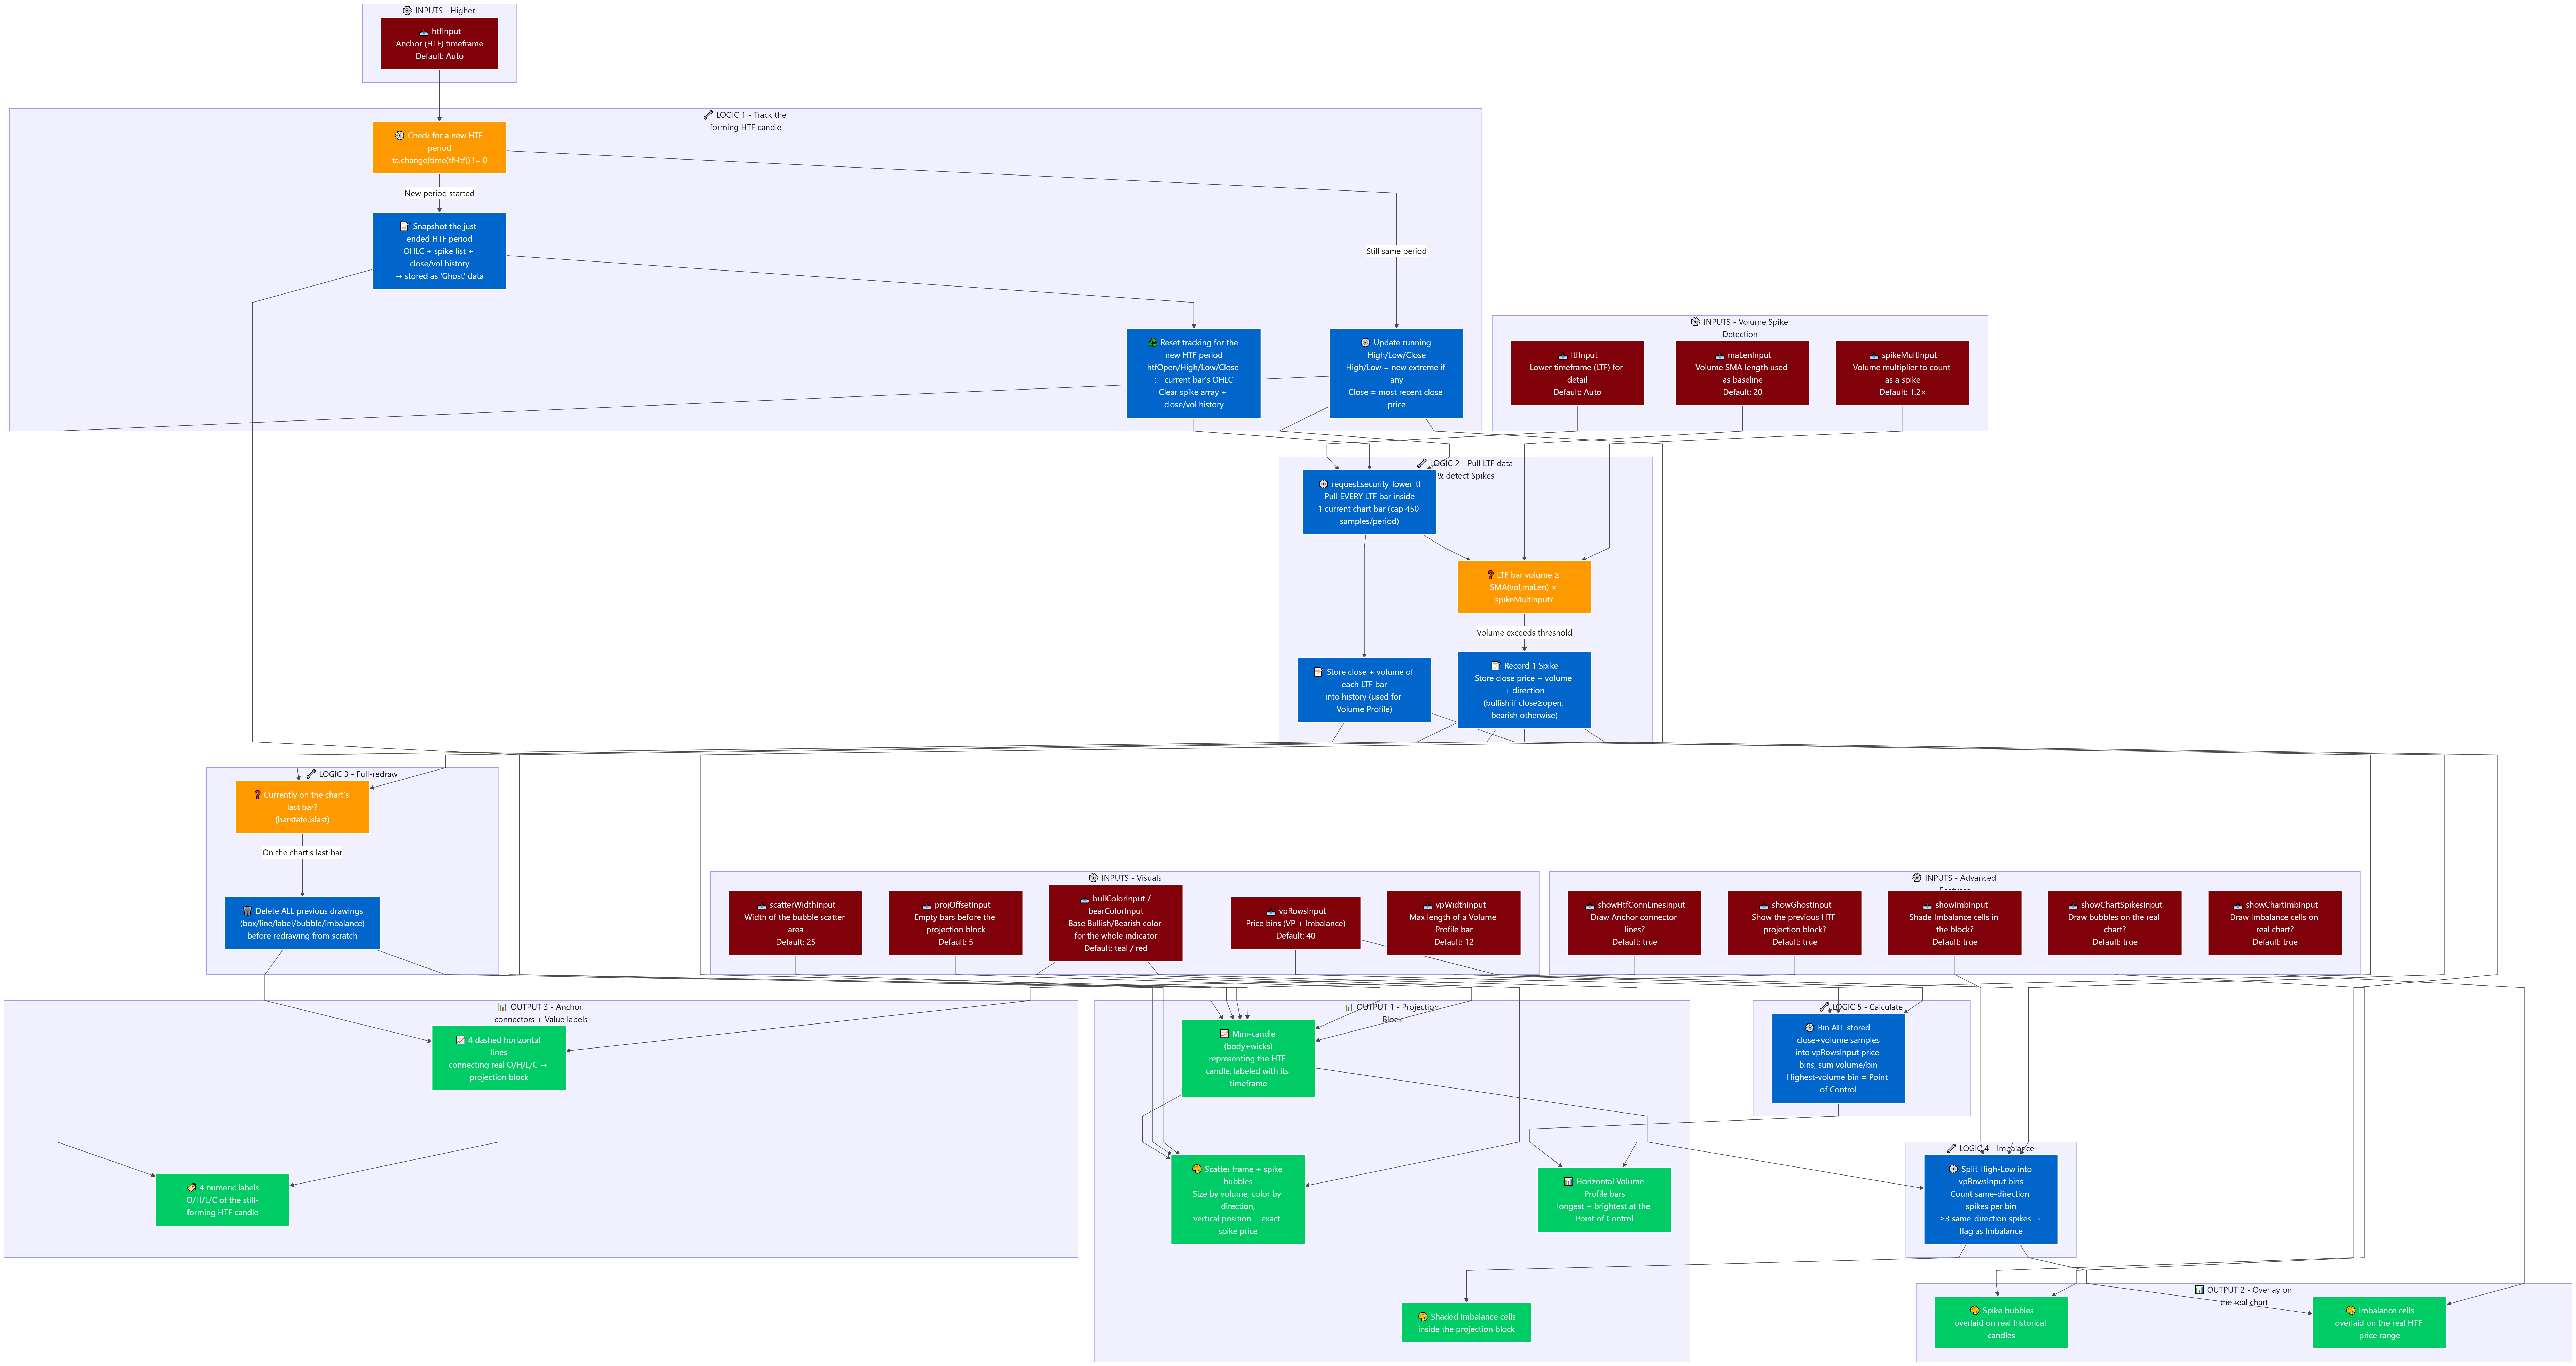
- Working backward from what's displayed: the entire projection block — bubbles, imbalance cells, volume profile — is REDRAWN FROM SCRATCH every time the chart's last bar receives a new tick (the drawing code only runs inside the barstate.islast branch) — the indicator doesn't "accumulate" drawings over history, it wipes and redraws everything on every update, keeping the projection always in sync with the freshest data.
- Forming-HTF-candle tracking layer: every time a new HTF period is detected (a new hour/day/week depending on the anchor timeframe), all the data from the JUST-ENDED HTF period (OHLC + the list of recorded spikes + the close/volume history) is snapshotted as the "Ghost" data; the tracking state is then reset to start following the new HTF period from scratch. While the current HTF period is still running, High/Low keep updating to any new extreme, and Close always tracks the chart's most recent close price.
- Lower-timeframe (LTF) data-pull layer: uses request.security_lower_tf to pull EVERY LTF bar (on a timeframe smaller than even the chart's own) that falls inside a single chart bar — meaning one chart bar can yield dozens of underlying LTF sub-bars. For each LTF sub-bar (up to a cap of 450 per HTF period): its close price + volume are stored into history (used later for the Volume Profile), and its volume is checked against spikeMultInput × the moving average — if it exceeds that, it's recorded as a "spike": close price, volume, and direction (bullish if close ≥ open, bearish otherwise) are stored.
- Mini-candle + internal connector drawing layer: for each block (current and/or Ghost), draws a rectangle representing the candle body (Open→Close) plus 2 short lines representing the upper/lower wicks (High/Low) — a visual miniature of exactly one HTF candle, labeled with its timeframe name above it.
- Scatter area + bubble drawing layer: extends a faded background rectangle right next to the mini-candle, connected by 2 dotted lines from the mini-candle's top/bottom to the scatter frame's top/bottom; then scatters round bubbles representing each recorded spike into this area — horizontal position follows the ORDER spikes occurred (not real elapsed time), vertical position matches the EXACT price at which the spike happened, bubble size scales with relative volume (versus the smallest/largest spike in that same period), and color intensity likewise scales with relative volume.
- Imbalance-detection layer: divides the HTF period's High-Low price range into vpRowsInput equal bins; for each bin, counts how many recorded spikes fall into that exact price range, separately by direction (bullish/bearish); if the count of SAME-DIRECTION spikes in a bin reaches 3 or more, the entire bin is shaded (green if bullish-majority, red if bearish-majority) — both inside the projection block (if showImbInput is on) and directly on the real chart (if showChartImbInput is on).
- Volume Profile calculation layer: uses the ENTIRE stored close+volume history (not just the spikes) from the HTF period, bins it into the same vpRowsInput price bins, summing the volume of every LTF bar that falls into each bin; the bin with the highest total volume is drawn as the longest bar (exactly vpWidthInput wide) and the brightest color (the Point of Control); the remaining bins are drawn shorter in proportion to their volume, progressively dimmer for lower volume.
- Anchor-connector + value-label drawing layer: if enabled, draws 4 dashed horizontal lines connecting the exact real Open/High/Low/Close positions on the historical chart (where those levels actually occurred) over to the start of the projection block, helping the trader match the abstract projection to the correct real HTF candle; it also prints 4 numeric labels showing the precise current Open/High/Close/Low values of the still-forming HTF candle.
Outputs & how they're used
- Projection block (mini-candle + scatter + imbalance + volume profile): lets you inspect the order-flow structure inside a higher-timeframe candle without ever leaving the timeframe you're actually trading — saving repeated timeframe switching.
- Imbalance cells (in the projection block and/or on the real chart): price zones suspected of heavy one-sided large/institutional order flow — worth watching as candidate support/resistance or as a reference for entries aligned with that flow.
- Volume Profile bars: identify the price zone with the heaviest traded volume (Point of Control) within the current HTF candle — a reference for the likelihood price gravitates back to that level.
- Anchor connector lines + O/H/L/C labels: visual cross-checking plus a quick numeric read of the still-forming HTF candle's exact values, without switching timeframes or hovering over the real candle.