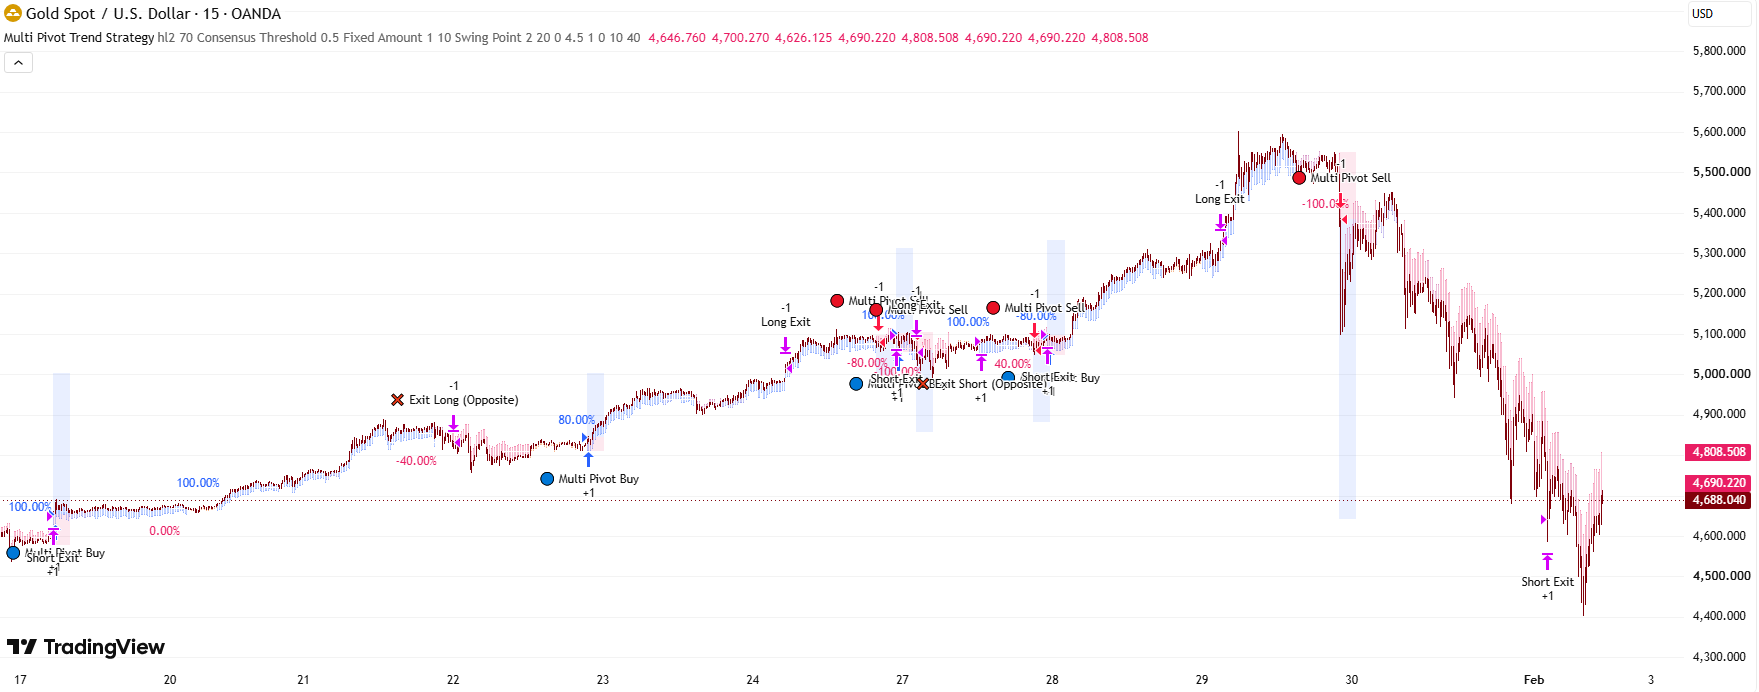
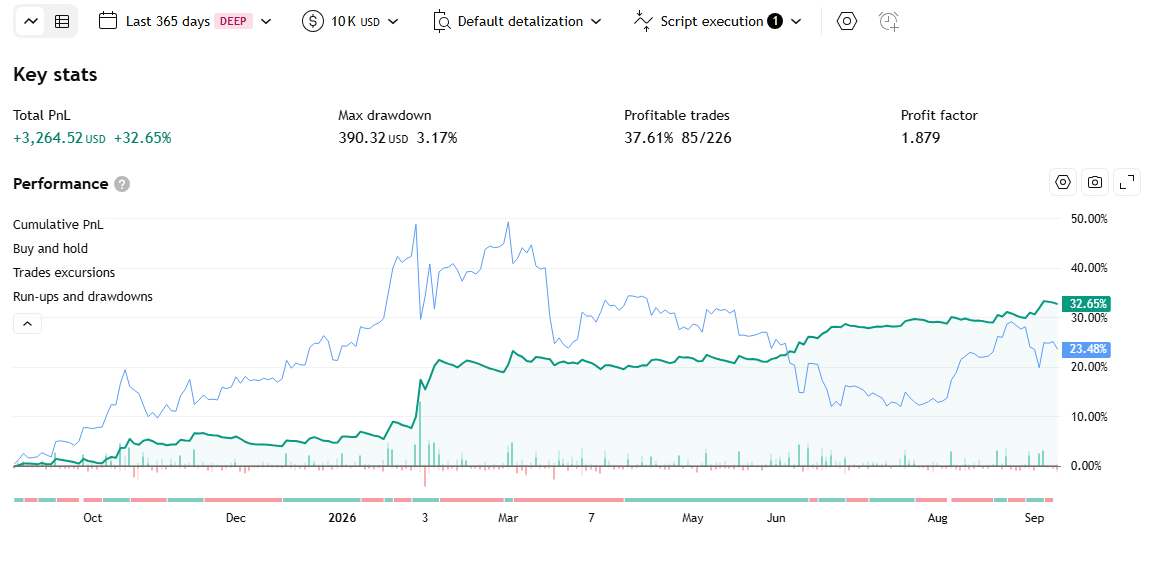
1. Description Multi Pivot Trend Strategy
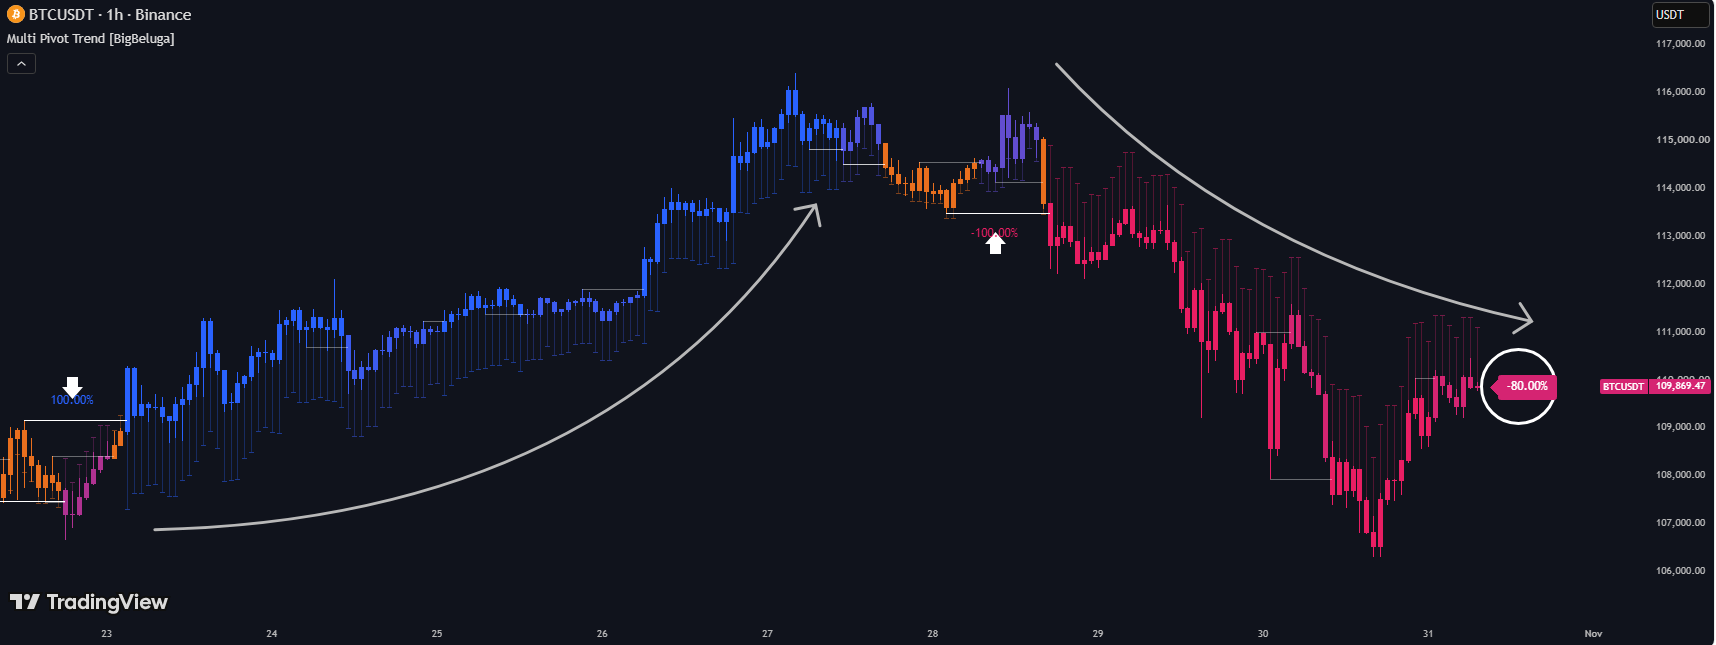
An indicator that runs 10 independent breakout detectors in parallel using 10 different pivot lengths, averages them into a single continuous "trend consensus" score from -1 to +1, then colors the entire candle in a gradient matching that exact score.
1.1 Indicator concept
The indicator runs 10 INDEPENDENT breakout-trend detectors SIMULTANEOUSLY, each using a different pivot length (from 2 to 11 bars on each side) — the short-length instance (len=2) is sensitive to short-term moves, the long-length instance (len=11) reflects a more stable trend. Each instance produces one of 3 states: Bullish (+1), Bearish (-1), or holds its previous state (0 if it has never broken out yet).
The indicator then AVERAGES all 10 of these values into a single continuous score ranging from -1.0 (all 10 instances agree bearish) to +1.0 (all agree bullish) — not just a simple binary bullish/bearish signal, but a measure of "trend CONSENSUS" across multiple sensitivities at once. This score is then used to color the whole candle in a continuous gradient (not just 2 up/down colors) and to draw an extra "tail" attached below/above each candle, whose length is proportional to consensus strength.
1.2 Indicator features
- Consensus-gradient candle coloring: every candle is entirely recolored (body+wick+border) on a continuous scale interpolating between Bearish (pink-red) → Neutral/Sideways (orange) → Bullish (blue), exactly reflecting what percentage of the 10 pivot instances currently agree in the same direction.
- Candle Trend Extension tail: an extra stroke attached to the near edge of the candle body, whose length is proportional to |consensus score| × 2×ATR(50) — the stronger the consensus (closer to ±1), the longer the tail.
- Breakout lines: every time one of the 10 pivot instances confirms a breakout (price crosses the most recent swing high/low), a horizontal line is drawn connecting the pivot's position to the breakout point, with a different shade depending on that instance's pivot length (shorter pivot = fainter line, longer pivot = more solid line).
- Consensus percentage label: a numeric label showing the current consensus score (as a %) appears right at the len=10 pivot instance's own breakout point, PLUS a continuously-updating label at the chart's right edge showing the exact current consensus %.
- Alert: the indicator has NO alert feature — it's purely visual.
1.3 How to use it in trading
- Read candle color for a quick gauge of trend consensus strength: a deep blue/deep pink-red color = most (nearly all) of the 10 pivot instances agree in the same direction, a more reliable trend; orange (the -30% to +30% zone) = instances are split, the market may be sideways/choppy, warranting more caution before entering with the trend.
- Use the % label at the chart's right edge to read the exact consensus figure instead of just estimating it visually from color.
- Watch the breakout lines: when several lines (from different pivot instances) form close together in time and in the same direction, that's a sign a breakout is being confirmed simultaneously across multiple sensitivities, raising signal confidence.
- Switch "Mitigation Method" to the strictness level you want: "close" (default) requires the closing price to clearly clear the pivot level to count as a breakout — strict, fewer false signals; "wicks" only needs a wick touch to count — most sensitive, more prone to false breakouts; "hl2" sits in between the two.
- The extension tail below/above candles is mainly a visual aid for consensus strength (the longer, the stronger the consensus) — useful for a quick glance at trend intensity without reading the % number.
- Raise "Candles Extension Transparency" if you want the extension tail fainter, less overpowering on the real candles; lower it for a more visible tail.
1.4 How the indicator works
Inputs & their role
- mitigation (Mitigation Method, default "close", options close/wicks/hl2): selects which price is used to confirm a breakout past the pivot level — "close": only counts a breakout when the CLOSING price clearly clears the level, the strictest; "wicks": only needs a WICK (high to break a high, low to break a low) to touch past the level, the most sensitive, more prone to false breakouts; "hl2" uses the average (high+low)/2, a middle strictness between the two.
- colTrendUp / colTrendL / colTrendDn (color, default ■ blue / ■ orange #e96f1e / ■ pink-red #e91e63): the 3 anchor colors for the gradient scale — Strongly Bullish, Neutral/Sideways, Strongly Bearish.
- colLines (Breakout Lines, default white): the base color used for the breakout lines of all 10 pivot instances — each instance gets a different shade based on its pivot length.
- candlesExtension (Candles Extension Transparency, default 70, range 20-90): the transparency of the wick/border portion of the "extension tail" attached to each candle (does not affect the real candle or the tail's body).
Main logic blocks
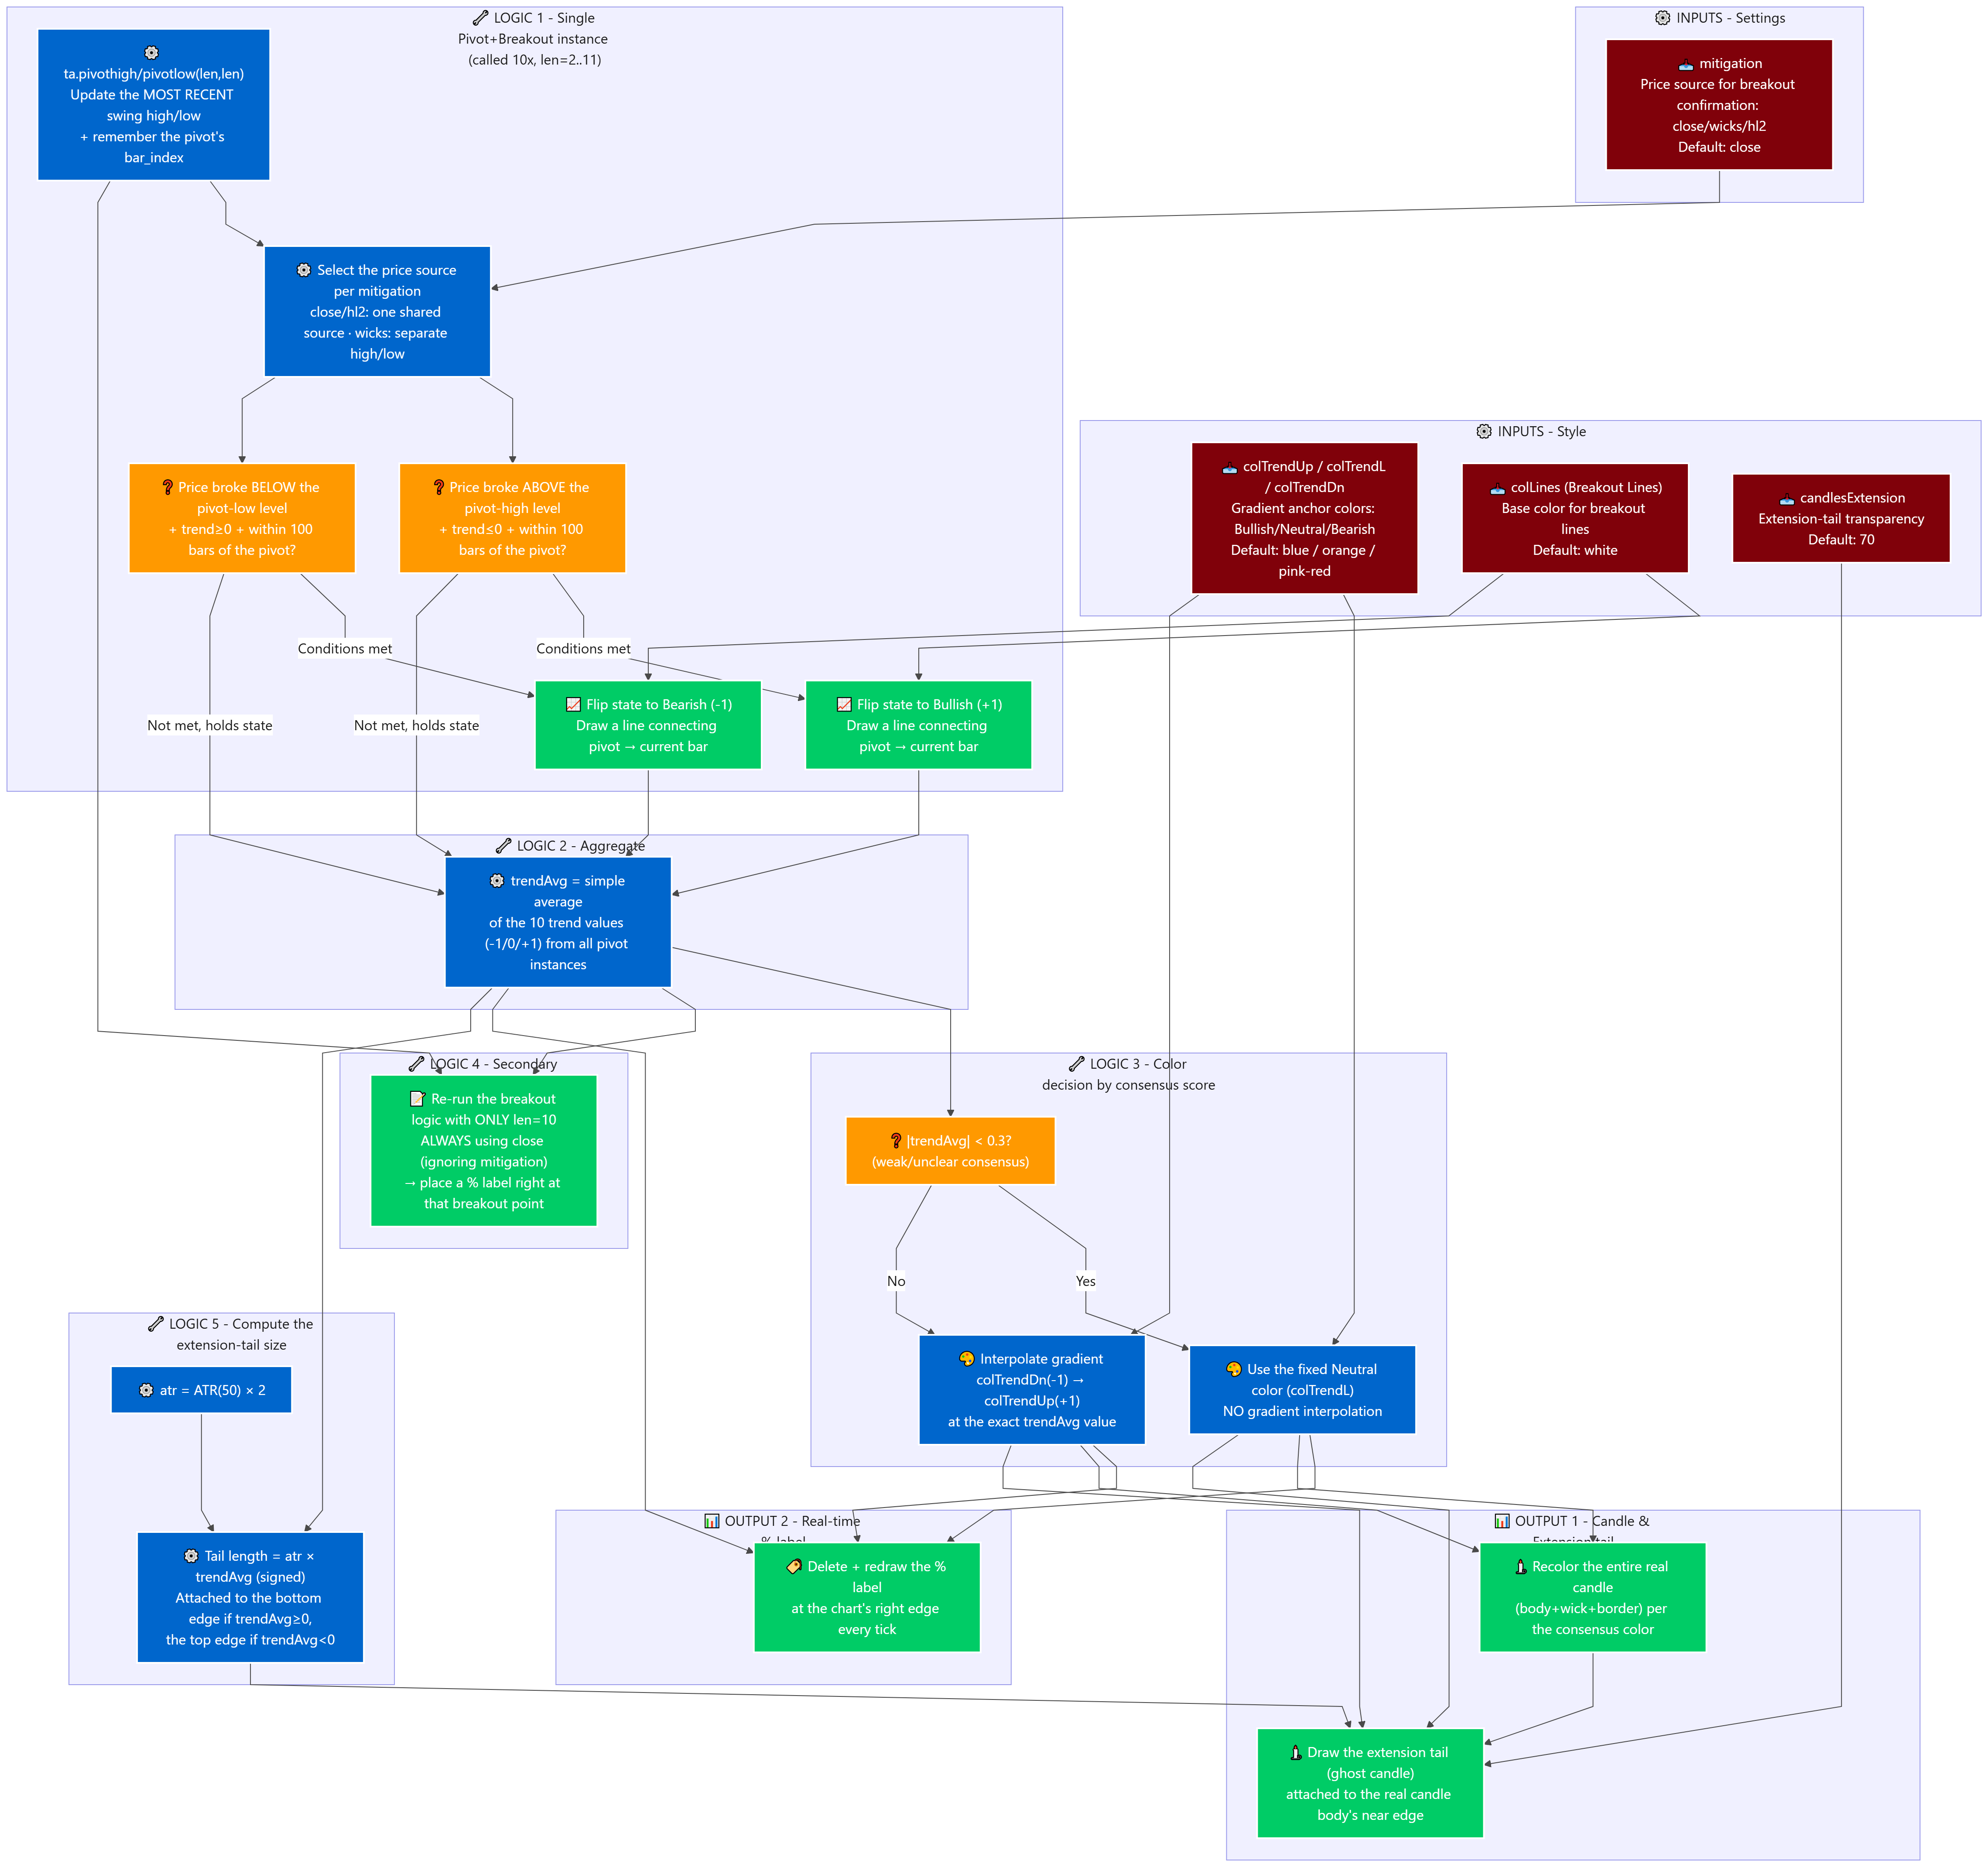
- Working backward from what's displayed: the candle color + extension tail + % label all originate from exactly ONE value, "trendAvg" — the average of 10 separate trend values (each only ever -1, 0, or +1) computed by 10 calls of the breakout-detection function, each with a different pivot length (2 through 11).
- Single pivot-instance breakout-detection layer (shared by all 10 calls, differing only in the "len" parameter): on every bar, uses TradingView's standard pivot function (len bars of lag on each side) to keep the MOST RECENT swing high/low updated as the "reference level"; it also remembers the bar position (bar_index) of that most recent pivot. The price compared against the reference level is chosen per the mitigation setting (close/hl2 use the same source for both directions; wicks separates high for the upward test, low for the downward test).
- Breakout confirmation + state-flip layer (within each individual pivot instance): if price breaks ABOVE the pivot-high level AND that instance's current state is not already Bullish AND this break happens within 100 bars of that pivot forming (avoiding breaking an already-stale, no-longer- meaningful pivot) → that instance's state flips to Bullish (+1), and a horizontal line is drawn connecting the pivot's position to the current bar. The mirror applies for price breaking BELOW the pivot-low level under the same conditions → flips to Bearish (-1). If neither condition fires, that instance HOLDS its previous state (it does not automatically reset to 0).
- Line-coloring-by-pivot-length layer: each of the 10 instances is assigned its own shade of colLines — the shortest pivot instance (len=2) draws the faintest line (70% transparent), the longest (len=11) draws the most solid line (0% transparent), the instances in between interpolate linearly by length — helping visually distinguish which sensitivity a given line came from.
- Consensus-aggregation layer: takes the simple average of all 10 trend values (-1/0/+1) from the 10 pivot instances (len 2 through 11) → producing a single continuous number in [-1, +1]. E.g. 6 instances Bullish, 3 Neutral, 1 Bearish → average = (6−1)/10 = 0.5 (50% bullish consensus).
- Color-decision-by-consensus layer: if the score falls within a narrow band around 0 (-0.3 to +0.3, i.e. weak/unclear consensus) → uses the fixed Neutral color (colTrendL) directly, with NO gradient interpolation; if the score falls outside that band (strong enough one-sided consensus) → interpolates a continuous color between colTrendDn (at -1) and colTrendUp (at +1) based on the exact current score.
- Secondary label-drawing layer at the len=10 pivot: runs a simplified duplicate of the breakout logic in parallel (using ONLY len=10, and ALWAYS testing against the close price — regardless of whatever the mitigation input is set to) — its sole purpose is to place a % label (the trendAvg value at that moment) right at this specific len=10 instance's own breakout point; it does not participate in computing trendAvg or coloring the candles.
- Real-time % label layer: on the chart's last bar, continuously deletes and redraws a label showing the exact current consensus %, placed at the chart's right edge, colored to match whichever gradient color is currently applied to the candles.
- Extension-tail drawing layer: computes atr = ATR(50)×2 as the base unit; tail length = atr × trendAvg (signed — positive when bullish consensus, negative when bearish); the tail is attached to the NEAR edge of the real candle body (the bottom edge if trendAvg≥0, the top edge if trendAvg<0) and extends further by that computed length — geometrically, when consensus is bullish (trendAvg positive), the extension tail appears BELOW the candle; when consensus is bearish (trendAvg negative), the tail appears ABOVE the candle — this is a direct observation of the geometry in the original code.
Outputs & how they're used
- Consensus-gradient candle color: lets you instantly recognize not just the trend's DIRECTION but also the DEGREE of consensus across multiple pivot sensitivities, helping distinguish a "solid" trend (most instances agree) from a "fragile" one (only a few agree).
- Multi-shade breakout lines: shows exactly which pivot sensitivity (short or long-term) a given breakout just came from, helping judge whether that breakout is likely to be meaningful long-term or just short-term noise.
- Consensus % labels (at the len=10 pivot and at the chart's edge): a quick lookup of the exact consensus figure, without having to estimate it from color.
- Extension tail below/above candles: a supplementary visual indicator of consensus strength, readable at a glance without looking at the number.