1. Smart Money Volume Activity Strategy Description
An indicator that decomposes each chart candle into lower-timeframe volume, flags statistically abnormal volume spikes, and classifies each spike as a "Smart Money" or "Retail" footprint
1.1 Indicator Concept
This indicator is built on the theory that every candle hides a mix of two very different types of participants, and their volume "footprint" can be told apart statistically:
- Retail: individual, often emotional/FOMO-driven traders who tend to jump in right at the price everyone can see — i.e. exactly at the candle's closing price. Their large trades are a "chasing" footprint.
- Smart Money: large, informed capital (institutions, market makers) that transacts quietly inside the candle's body, without needing to chase price all the way to the close. Their large trades are a "patient, deliberate" footprint.
To find these abnormally large trades objectively, the indicator breaks every chart candle (e.g. 15-minute) down into its lower-timeframe sub-candles (e.g. three 5-minute sub-candles) and computes a Z-score for each sub-candle's volume against a rolling pool of historical sub-candle volumes. Any sub-candle whose Z-score clears the threshold is a statistically abnormal event — an unusually heavy trade.
Each event is drawn as a horizontal level at the price where that heavy trade closed. The theory: that price keeps a "memory" of size — it behaves like support (if the event was bullish) or resistance (if bearish) — until price actually comes back and trades through it, at which point the footprint is considered "used up" and the level disappears. On top of that, the indicator keeps a running tally of whether the volume behind every still-active level is currently sitting in profit or in loss, separately for Retail and Smart Money, to show at a glance who currently has the upper hand.
1.2 Indicator Features
-
Display:
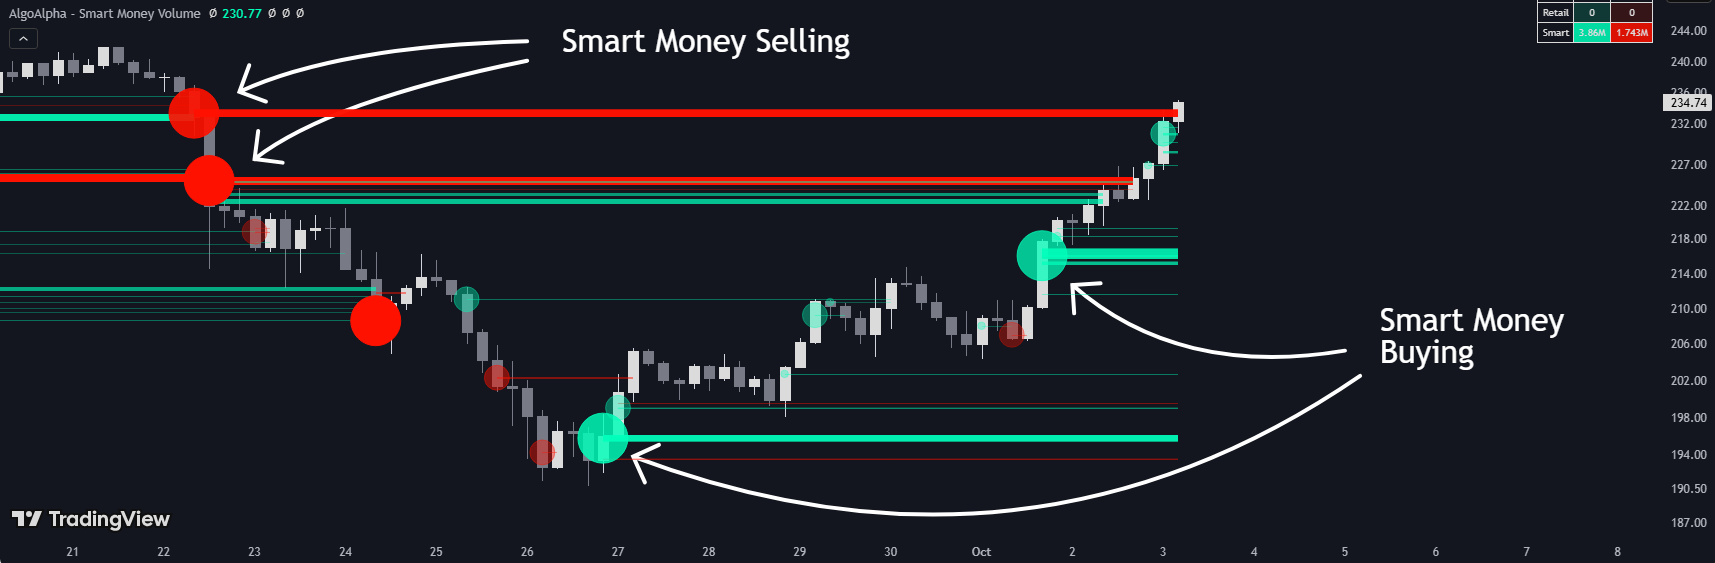
- Level Lines: a glowing double line (a soft outer glow + a brighter, thinner core) drawn horizontally from the event's bar forward, like a ray. Retail events use gray tones (light gray bullish / dark gray bearish); Smart Money events use the user-selectable colors (default teal-green bullish / red bearish). Thickness and opacity both scale with the event's Z-score — the stronger the volume spike, the thicker and more vivid the line.
- Bubble Marker: one circle drawn per bar at the price of that bar's single strongest qualifying event, in 5 size tiers (tiny → huge) and colored/faded the same way as level lines — a quick "who dominated this bar" read.
- P/L Table: a 3×3 table (Class × Profit/Loss) comparing the accumulated volume of Retail vs Smart Money that is currently in profit vs currently in loss. Cell color intensity scales with how large that value is relative to the larger of the two classes in the same column. Size and screen position are configurable.
-
Alerts:
- "Retail Bull" / "Retail Bear": fires when a Retail-classified bullish/bearish volume event is detected on the bar.
- "Smart Money Bull" / "Smart Money Bear": fires when a Smart-Money-classified bullish/bearish volume event is detected on the bar.
- All 4 alerts fire from the raw detection and ignore the "Show" / "Show Levels" / "Show Bubbles" display filters — they always reflect what actually happened.
1.3 How to Use the Indicator
- Support/Resistance from footprints: treat active bullish levels sitting below price as potential support/long-retest zones, and active bearish levels above price as resistance/short zones. A level's disappearance means price has already retested and "used up" that footprint.
- Prioritize Smart Money over Retail: when several levels cluster together, give more weight to the teal-green/red Smart Money levels — that volume didn't need to chase the close, which typically means larger, more deliberate size.
- Confirm with bubbles: a large, opaque bubble printing at a swing extreme in your bias's direction adds conviction to an entry; an opposite-colored bubble right at your entry zone is a warning sign.
- Read sentiment from the P/L table: if Smart Money profit volume clearly outweighs its own loss volume and Retail's profit volume, informed money is currently winning — treat that as confirmation of the direction Smart Money is skewed toward. Ballooning Retail loss volume while Smart Money stays in profit is the classic "Retail is trapped, Smart Money is right" read, useful as a contrarian filter.
- Isolate one footprint type: set "Show" to "Smart Money" or "Retail" to hide the other class's levels/bubbles entirely when you only want to trade one type of footprint.
- Automate with alerts: set up the 4 alert conditions in TradingView to get notified live instead of watching the chart.
1.4 How the Indicator Works
Inputs & Roles
- zLen ("Period (Chart Bars)", Integer, default: 50): how many chart (higher-timeframe) bars' worth of lower-timeframe volume readings are kept in the rolling statistics pool used to compute the average and standard deviation. Example: chart = 15m, lower timeframe = 5m → each 15m bar contributes 3 sub-candle volume readings, so zLen=50 keeps a pool of up to 50×3 = 150 samples. Smaller zLen (e.g. 20) → statistics adapt fast to a recent volume regime, more events flagged right after a genuine volume expansion, but noisier once that spike itself skews a small pool. Larger zLen (e.g. 100) → steadier statistics, fewer false positives, but slower to react if the market's baseline volume has genuinely shifted.
- thAbs ("Threshold (|Z|)", Float, step 0.1, default: 2.0): the minimum Z-score a lower-timeframe volume reading must clear to be treated as a significant event. Example: pool average = 1,200, standard deviation = 300, a sub-candle prints volume = 2,100 → Z = (2,100−1,200)/300 = 3.0, which clears thAbs=2.0 and is flagged. Lower thAbs (e.g. 1.5) → more, noisier events. Higher thAbs (e.g. 3.0) → only the most extreme spikes are flagged, far fewer but each far more significant.
- ltf_ ("Lower Timeframe Value", Timeframe, default: "5"): the lower timeframe the indicator decomposes each chart bar into. Example: on a 15m chart, ltf_="1" gives 15 one-minute sub-candles per chart bar (much finer detection, but the statistics pool grows to zLen×15 = 750 samples if zLen=50 — heavier to compute), while ltf_="5" gives only 3 sub-candles per bar (pool = 150). This value must stay smaller than the chart's own timeframe, otherwise there is no sub-candle data to decompose.
- who ("Show", options: Smart Money / Retail / Both, default: "Both"): filters which class is allowed to draw levels and bubbles. Example: who="Smart Money" hides every Retail-classified level/bubble, but the 4 alert conditions still fire for both classes regardless of this setting.
- levels ("Show Levels", Boolean, default: true): turns the level lines on/off. Turning it off does not stop event detection or alerts — it only stops new lines from being drawn.
- bubbles ("Show Bubbles", Boolean, default: true): turns the bubble marker on/off, independently of the level lines and the P/L table.
- showPLTable ("Show P/L Table", Boolean, default: true): shows or hides the 3×3 Profit/Loss table.
- table_size ("Table Size", options: Tiny/Small/Medium/Large, default: "Small"): text size used inside the P/L table.
- plTablePosition ("Table Position", default: "top right"): where the P/L table is anchored on the chart.
- bullColor / bearColor (Color, defaults: #00ffbb / #ff1100): color of Smart Money bullish/bearish level lines, bubbles, and the corresponding P/L table cells.
- retailbullcol / retailbearcol (Color, defaults: #9c9c9c / #4a4a4a): color of Retail bullish/bearish level lines and bubbles.
Main Logic Blocks
🎯 Flow 1: Volume Event Detection & Classification
-
Step 1 - Pull lower-timeframe data & build the rolling pool:
- Every chart bar, request.security_lower_tf() fetches the volume, close and open of every sub-candle inside that bar at the ltf_ timeframe. Example: 15m chart + ltf_=5m → 3 sub-candles per bar.
- All of that bar's sub-candle volumes are pushed into a global rolling list (an array — a growable list of values kept in memory), then the oldest entries are dropped until the list holds at most zLen × (sub-candles per bar) values, e.g. 50×3 = 150.
-
Step 2 - Compute a Z-score per sub-candle & flag events:
- For each of this bar's sub-candles, Z = (volume − pool average) / pool standard deviation. Example: average=1,200, stdev=300, volume=2,100 → Z=3.0.
- If Z is greater than thAbs (only unusually high volume triggers an event — unusually low volume is never flagged), that sub-candle's position is recorded as an event candidate.
-
Step 3 - Classify Retail vs Smart Money:
- Read that sub-candle's own open/close to get its direction (bullish if close > open), and take its closing price as the candidate level price (lvlPrice).
- If lvlPrice equals the chart bar's own closing price → Retail (the heavy trade landed exactly at the extreme everyone can see). Example: chart bar closes at 1.0855, event sub-candle also closes at 1.0855 → Retail.
- Else, if lvlPrice sits strictly inside the chart bar's body (between its open and close, not touching either edge) → Smart Money. Example: chart bar open=1.0830, close=1.0855, event sub-candle closes at 1.0850 → strictly inside the body → Smart Money.
- Any other case defaults back to Retail.
- Regardless of the "Show"/"Show Levels"/"Show Bubbles" settings, this step also unconditionally flags the bar with the matching alert flag (Retail Bull/Bear or Smart Money Bull/Bear) so the 4 alerts always reflect the raw detection.
📈 Flow 2: Level Line Drawing & Lifecycle
- Creation: if levels is on and the "Show" filter allows this event's class, a width/opacity value widthZ is derived from the event's |Z| (rounded, clamped to 1-10). Example: Z=3.0 → widthZ=3 → a relatively thin, faint line; Z=8.5 → widthZ=9 → a thick, vivid line. Two overlapping line objects are drawn at lvlPrice starting at the event bar: a wider, more transparent "glow" and a narrower, more opaque "core", colored per the class/direction (Retail gray tones or Smart Money bullColor/bearColor).
- Persistence: every following bar, every still-active level's line is stretched forward to the current bar (its right edge follows price forward like a ray, keeping the level visible on screen).
- Deletion (retest): on every confirmed bar, if that bar's body (its open/close range) actually straddles the level's price, the level is considered retested and is deleted (line removed from the chart). Example: level at 1.0850; a later bar opens 1.0862 and closes 1.0843 → its body spans 1.0843-1.0862, which straddles 1.0850 → level deleted. A bar that instead gaps straight through (e.g. opens 1.0820, closes 1.0810, entirely below 1.0850) does not straddle the level, so the level survives — it simply now counts as "in loss" instead of being removed (see Flow 4).
- Storage limits: at most 150 levels and 100 stored volume/Z samples are kept at once; anything beyond that is dropped from the oldest end first.
🔵 Flow 3: Bubble Marker
- On every bar, among all events whose class passes the "Show" filter, the indicator keeps only the one with the largest |Z| for that bar (its direction, price and class).
- That single strongest event is drawn as one circle at its price, sized into one of 5 tiers by its rounded, clamped |Z| (1-2 → tiny, 3-4 → small, 5-6 → normal, 7-8 → large, 9-10 → huge), and colored/faded the same way as level lines.
📊 Flow 4: Profit/Loss Volume Tally & Table
- On every bar, for every level that is still active, the indicator checks whether the current closing price sits on the favorable side of that level (bullish level: close ≥ level price; bearish level: close ≤ level price) — "in profit" if so, "in loss" otherwise — and adds that event's original volume into one of 4 running buckets: Retail Profit/Loss, Smart Money Profit/Loss.
- On the very last bar, if showPLTable is on, a 3×3 table renders these 4 totals. Each cell's background opacity is scaled relative to the larger of Retail vs Smart Money in that same column. Example: Smart Money profit = 120,000 (the column's largest) → its cell is painted at full intensity (most opaque); Retail profit = 50,000 → painted noticeably lighter, since it is only ~42% of the column's maximum.
🔔 Flow 5: Alerts
- The 4 alert flags set in Flow 1, Step 3 are exposed as TradingView alert conditions: "Retail Bull", "Retail Bear", "Smart Money Bull", "Smart Money Bear".
- Because these flags are set before any display filter is applied, the alerts fire for every qualifying event regardless of the "Show" / "Show Levels" / "Show Bubbles" settings.
Outputs & Roles in Trading
- Level Lines: visual support/resistance zones built from statistically abnormal trades, self-clearing once retested — useful as confluence for entries/exits.
- Bubble Marker: a bar-by-bar "who's dominating right now" read, useful for quick visual confirmation without reading the raw levels.
- P/L Table: a running sentiment gauge comparing Retail vs Smart Money conviction, useful as a contrarian/confirmation filter.
- Alerts: real-time notification of Retail/Smart Money volume events so traders don't have to watch the chart continuously.