1. RSI Momentum Divergence Zones Strategy Description
Finds divergences between price and an unusual RSI (an RSI computed on price momentum rather than on price itself), then turns every divergence into a horizontal price zone that stays alive until it is broken.
1.1 Indicator Concept
The indicator builds on the familiar idea of divergence: price makes a higher high while a momentum oscillator makes a lower high (or price makes a lower low while the oscillator makes a higher low) — a sign that the current push is losing steam and may be about to reverse. What makes this one different comes down to two things:
- The oscillator is not an RSI of price, it is an RSI of price MOMENTUM. The code first computes mom = close − close[10] (today's close minus the close 10 bars ago — i.e. "how far has price travelled over the last 10 bars"), and only then feeds that series into the RSI formula. In plain words: a normal RSI measures "is price strong or weak", while this one measures "is price's momentum itself building or fading" — one derivative earlier and one notch more sensitive. That is where the word "Momentum" in the name comes from.
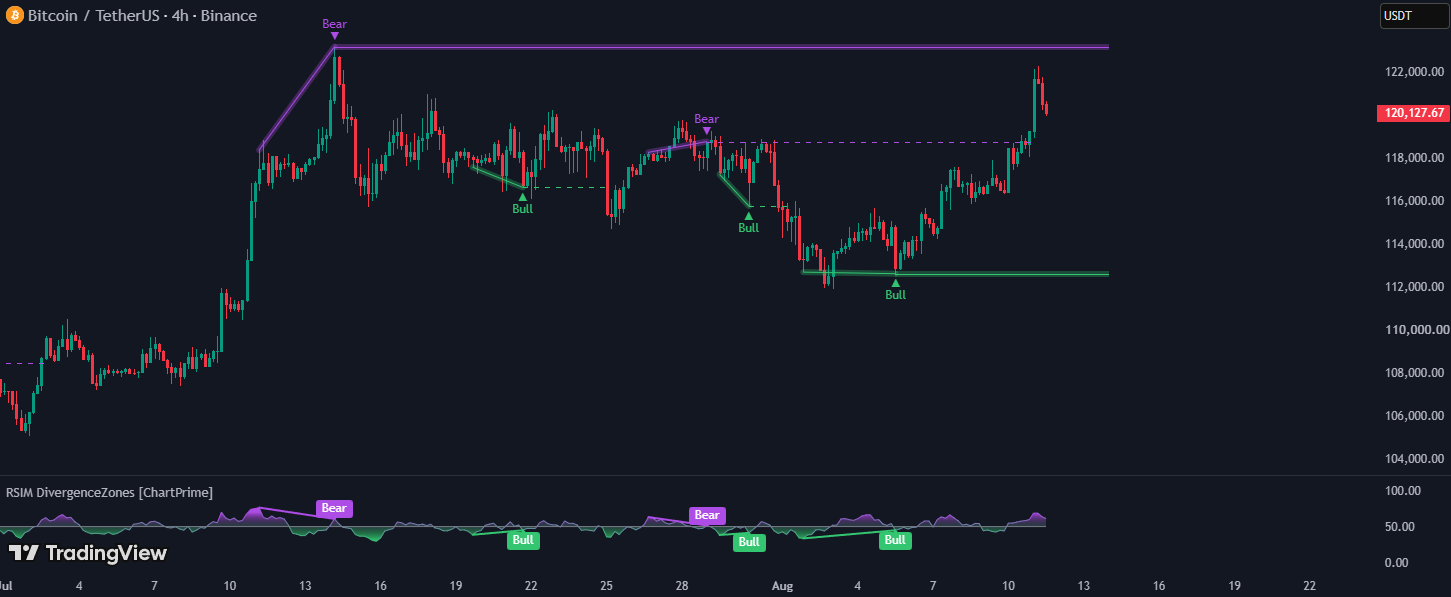
- A divergence is not just a label and done — it spawns a living PRICE ZONE. The indicator takes the low (bullish divergence) or the high (bearish divergence) of the exact bar that produced the divergence, draws a thick horizontal band there, and keeps extending it forward for as long as price still respects that level. Once price breaks fully through, the band switches to a dashed line and stops extending — so at a glance you can tell which levels are still valid and which ones are already gone.
The underlying belief: the price level at which market momentum first "ran out of breath" (the divergence point) is a level the market remembers; it tends to act as support (bullish divergence) or resistance (bearish divergence) until it is decisively broken.
1.2 Indicator Features
-
Display — in the sub-pane (RSI pane) below the chart:
- A value-colored RSI line: blends from green around 30 to purple around 70. Note the color logic is "reversal warning" logic: high = purple (watch for a drop), low = green (watch for a bounce).
- A gradient fill between the RSI line and the 50 level: the part above 50 leans further toward purple as it approaches 70, the part below 50 leans further toward green as it approaches 30. A gray horizontal line marks the 50 level.
- Divergence connector line: a straight segment joining the previous RSI low to the current RSI low (bullish, green) or the previous RSI high to the current RSI high (bearish, purple). It is only colored in when the divergence is valid — otherwise it is still drawn but made fully transparent, so the eye never sees it.
- "Bull" / "Bear" labels: a green label with white text pointing up (Bull) or a purple one pointing down (Bear), placed exactly at the RSI high/low that produced the divergence.
-
Display — on the price chart (drawn over the candles):
- Price-side divergence connector: the same pair of points as the RSI-pane connector, but joining the two price lows (Bull) or the two price highs (Bear) — drawn as one thin solid line plus one thick 70%-transparent band of the same color.
- Text labels "▲ Bull" / "Bear ▼": colored text with no bubble background, placed at the exact low/high of the divergence bar.
- Divergence Zone: a thick horizontal band (one thin line + one thick faded backing band) starting at the divergence bar and continuously extended 15 bars into the future for as long as it stays valid. When the level is broken, the thin line switches to dashed and stops at the breaking bar, and the thick backing band is deleted.
- Alerts: The indicator has NO alertcondition() calls. To get notifications you would have to create alerts manually in TradingView off the existing plots, or add the code yourself.
1.3 How to Use the Indicator
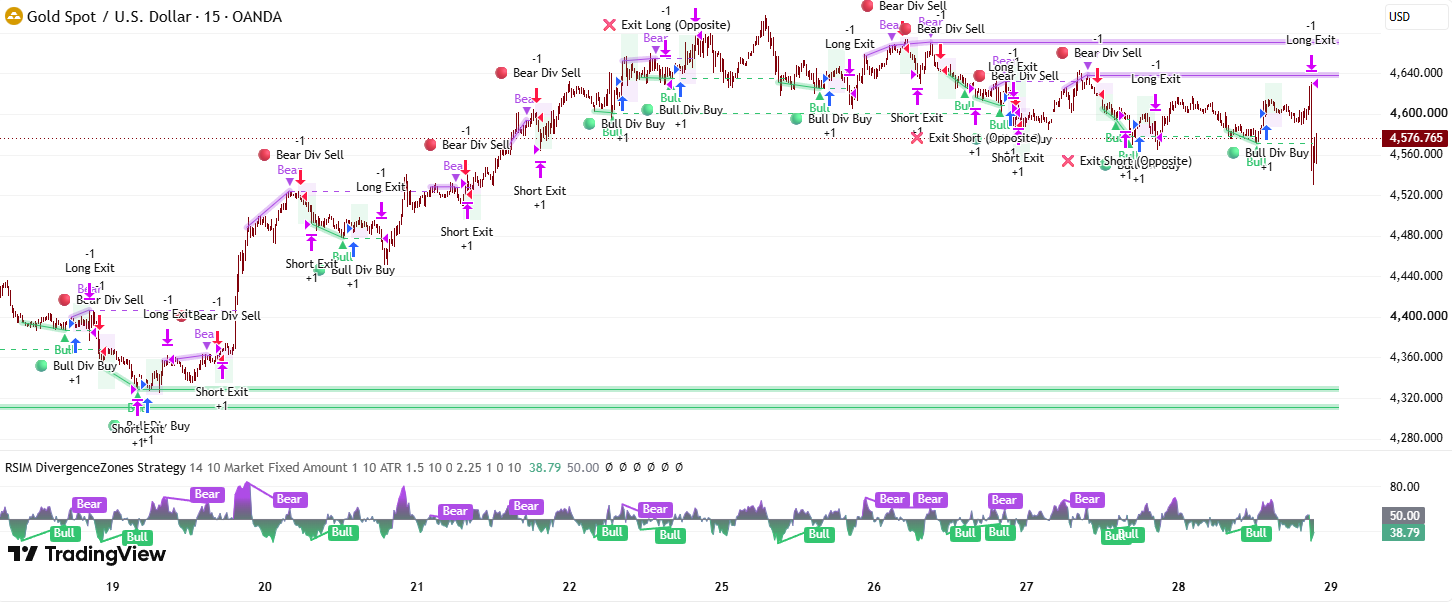
- Treat the Bull/Bear labels as reversal WARNINGS, not as immediate entries. Every divergence is confirmed with a 5-bar lag (the indicator must wait for 5 bars to the right before it can be sure it has a real high/low). The label appears 5 bars in the past while price has already moved on — so read it as "this area just showed exhaustion", then wait for price-action confirmation.
- Trade at zones that are still alive. A green band that is still being extended = the support level is still intact; look for longs when price pulls back into it. A purple band still being extended = resistance intact; look for shorts when price rallies into it.
- Use the "band turns dashed" event itself as a breakout signal. A green band going dashed means a whole candle has closed below that support level — support lost, buyers lost this round. A purple band going dashed means resistance has been taken out, sellers lost. Many traders find this flip (from long-bias to short-bias or vice versa) more tradeable than the original divergence signal.
- Anchor your Stop Loss on the band's level. Because the band's level is the low (or high) of the divergence bar, it is a clean technical reference: enter long at a green band → stop just below the band level; enter short at a purple band → stop just above it.
- Read where the RSI line sits to filter divergence quality. A bullish divergence that forms while the RSI is deep in its low zone (strongly green fill, near 30) is more trustworthy than one that forms while the RSI is drifting near 50. Same idea for bearish divergences near 70.
- Tune "Qty Divergence Zones" to your visual style. Leave it at 10 (default) for a multi-layer view of many levels; drop it to 2–3 to track only the most recent levels and keep the chart clean.
1.4 How the Indicator Works
Inputs & their role
- rsiLength ("RSI Length", integer, default 14, Settings group): the smoothing lookback in the RSI formula. Important: it is applied to the momentum series, not to price. Drop it to 7 → the line gets jumpy, hits 30/70 constantly, produces many more RSI highs/lows → more divergences but noisier. Raise it to 21 → a smooth line with few pivots, rarer but more selective divergences. This is the ONLY input that changes how many divergences appear and where — every other setting is purely cosmetic.
- enableDivCheck ("Enable Divergence Detection", checkbox, default ON, Divergence group): the master switch for the entire divergence engine. Turn it off → the indicator degrades into a plain oscillator: only the colored RSI line, the gradient fill and the 50 line remain; the Bull/Bear labels, both connector lines and every zone band disappear completely.
- showDivLevels ("Show Divergence Zones", checkbox, default ON, Divergence group): controls only the horizontal bands on the price chart. Turn it off → you still get the Bull/Bear labels and the connector lines, but no band is created, extended or tracked at all. Use it when you want to read the divergence signals without covering the chart in horizontal bands.
- qtyDivLevels ("Qty Divergence Zones", integer, default 10, Divergence group): the maximum number of still-valid bands kept per SIDE. Bull and Bear use two separate lists, so the default 10 means up to 10 green + 10 purple = 20 live bands at once. When the 11th band of a side is born, the OLDEST one of that side is deleted outright from the chart (both its lines).
- divBullColor ("Bullish Color", color picker, default #33c570 — green): used for everything on the bullish side — the Bull label, the RSI-low connector, the line and backing band of the support zone, and it is the lower-extreme color (the 30 level) of both the RSI line and the gradient fill below 50.
- divBearColor ("Bearish Color", color picker, default #ae4ce6 — purple): perfectly symmetric for the bearish side, and the upper-extreme color (the 70 level).
Hard-coded constants (NOT inputs — changing them means editing the code)
- divLookbackL = 5 and divLookbackR = 5: how many bars on the left and on the right are required before a high/low of the RSI line is accepted. The "5 on the right" half is exactly what causes the 5-bar lag on every signal.
- minBarsInRange = 5 and maxBarsInRange = 50: the allowed distance (in bars) between the current RSI pivot and the previous one. Too close or too far and the divergence is rejected — this stops the indicator comparing two points that have nothing to do with each other.
- max_lines_count = 500: declared on the first line, the ceiling on how many line objects the indicator may keep on the chart at once.
Main logic blocks

📊 Flow 1 — Building the oscillator (every bar)
- Step 1: rsiSrc = ta.mom(close, 10) — today's close minus the close 10 bars ago. Example: XAUUSD closes at 2650 today and closed at 2630 ten bars ago → rsiSrc = +20. If it had closed at 2670 ten bars ago → rsiSrc = −20. This is a series that oscillates around 0, can go negative, and tells you "over the last 10 bars, which way did price go and how far".
- Step 2: rsiVal = ta.rsi(rsiSrc, rsiLength) — that series is fed into the RSI-14 formula. RSI measures the ratio of total up-moves to total down-moves of its input series, always landing between 0 and 100. Because the input is momentum, rsiVal ≈ 70 means momentum has been consistently building over recent bars, not "price is overbought" in the classic RSI sense.
- Step 3: rsiRight = rsiVal[divLookbackR] = the RSI value 5 bars ago. This number shows up everywhere because every divergence comparison happens at the pivot point — and the pivot always sits exactly 5 bars behind the current bar.
- Since RSI needs 14 bars and mom needs 10, the first ~24 bars of the chart have no value (na) — no line, no signals.
🔍 Flow 2 — Finding highs/lows of the RSI line (every bar, only while Enable Divergence Detection is on)
- foundPL = not na(ta.pivotlow(rsiVal, 5, 5)) — a flag meaning "an RSI LOW has just been confirmed". The mechanism: a bar counts as a low when its RSI value is lower than all 5 bars to its left AND all 5 bars to its right. Because it must wait for those 5 right-hand bars, the flag only fires on the 5th bar AFTER the real low. Example: the real RSI low sits at bar 100 → foundPL only fires at bar 105.
- foundPH — perfectly symmetric, meaning "an RSI HIGH has just been confirmed".
- These two flags fire only on scattered bars, not on every bar. They are the heartbeat that drives everything else in the indicator.
⚖️ Flow 3 — Testing the 3 conditions for a valid divergence (only on bars where a pivot flag fires)
-
BULLISH divergence — all 3 required:
- ① RSI makes a Higher Low: rsiRight > ta.valuewhen(foundPL, rsiRight, 1) — compares the RSI at the current low against the RSI at the previous low. The function valuewhen(condition, value, 1) means "take that value at the 2nd most recent time the condition was true" — which is exactly the previous RSI low.
- ② Price makes a Lower Low: low[5] < ta.valuewhen(foundPL, low[5], 1) — the low of the current pivot bar must be below the low of the previous pivot bar.
- ③ Valid spacing: _inRange(foundPL[1]) — the number of bars between the two pivot detections must fall in the 5–50 window.
- Concrete example: previous RSI low at bar 80 with RSI = 22 and a low of 2600; new RSI low at bar 110 with RSI = 31 and a low of 2585. Test: RSI 31 > 22 ✓ · price 2585 < 2600 ✓ · 30 bars apart, inside 5–50 ✓ → Bull confirmed, and the zone level will be 2585.
- BEARISH divergence — perfectly symmetric: RSI makes a Lower High (rsiRight < the previous RSI high), price makes a Higher High (high[5] > the previous pivot's high), and the pivot spacing is inside 5–50 bars. The zone level will be high[5].
- If only 2 of the 3 conditions hold, nothing happens: no label, no band; the connector line is still plotted but stays transparent and therefore invisible.
🎨 Flow 4 — Drawing inside the RSI pane
- The RSI line: colored via color.from_gradient(rsiVal, 30, 70, green, purple) — a linear blend where RSI = 30 gives pure green, RSI = 70 gives pure purple, and everything in between is a mix.
- Gradient fill: two stacked fill() calls between the RSI line and the 50 line — the first paints purple at the 70 level fading out toward 30, the second paints green at the 30 level fading out toward 70. Net result: the part sticking up above 50 goes purple, the part dipping below 50 goes green.
- Divergence connector: the call plot(foundPL ? rsiRight : na, offset = −5). How it works: a value exists only on pivot bars and is na everywhere else, and plot automatically joins two consecutive values with a straight segment → that segment IS the line from the previous RSI low to the current one. The offset = −5 parameter shifts the whole thing 5 bars back so it lands on the real pivot position. The segment is green when the divergence is valid, otherwise it uses noneCol (white at 100% transparency) — still drawn, but invisible.
- Bull/Bear labels: plotshape with style labelup (Bull) / labeldown (Bear), positioned at the exact rsiRight height using absolute coordinates, also shifted back 5 bars.
🖼️ Flow 5 — Drawing over the price chart
- The same set of drawings as Flow 4, repeated on the price side: plot(foundPL ? low[5] : na, offset = −5, force_overlay = true) joins the two price lows, plus a duplicate at linewidth = 6 with transparency 70 to make it read as a "band" rather than a "line".
- The force_overlay = true parameter is what lets an indicator that lives in a sub-pane still draw onto the main price chart.
- The "▲\nBull" and "Bear\n▼" text labels use an inverted trick: the label bubble color is set to noneCol (invisible) while textcolor carries the real color → the eye sees floating text over the candles, never a label box.
📐 Flow 6 — Creating, feeding and retiring the divergence zones (only while Show Divergence Zones is on)
- Create: on the bar that confirms a divergence, the indicator takes levelY = low[5] (Bull) or high[5] (Bear) and creates 2 horizontal lines at that same level, both running from the pivot bar (bar_index − 5) to the current bar: one thin solid line in full color, and one 6px-wide line at transparency 70 as backing. The pair is wrapped into a single object and pushed onto the back of the queue (array) for that side.
- Count cap: if the queue grows past qtyDivLevels, the element at the FRONT (the oldest) is pulled off and both of its lines are deleted from the chart.
- Feeding (runs every bar, walking the whole queue): for each zone, the indicator asks a single question —
· Bull zone: is the current bar's high still ABOVE the zone level?
· Bear zone: is the current bar's low still BELOW the zone level?
If YES → the right end of both lines is dragged to bar_index + 15, i.e. 15 bars past the current bar (this is why the bands always look like they are "reaching into the future"). - Retire: if NOT (the whole candle has dropped below the support level, or cleared fully above the resistance level) → the thin line's right end is pinned at the current bar, it switches to dashed, the thick backing band is deleted, and the zone is removed from the queue (the indicator stops tracking it).
- Example on a timeline: bar 110 confirms a Bull at level 2585 → the green band appears starting at bar 105 and immediately stretches to bar 125. Through bars 111–139 price keeps printing highs above 2585 → the band is pushed one bar further right each bar. At bar 140 price drops hard and the entire candle sits below 2585 → the backing band vanishes, leaving a dashed green line pinned at bar 140. From that point on this zone no longer counts toward the 10 active zones.
Outputs & their role in trading
- RSI line + gradient fill: a quick feel for whether momentum is accelerating or fading, and how extreme it currently is — useful as a quality filter on the divergence signals.
- Bull/Bear labels + connector lines (both panes): the visual proof that price and momentum have gone out of phase — an early WARNING signal, with a fixed 5-bar lag.
- Divergence bands still being extended: support/resistance levels that remain valid — used as entry areas and as Stop Loss anchors.
- Bands that turn dashed: the signal that a level has been broken — used as an exit condition, or as a signal to flip trade direction.
- The oscillator is NOT a standard RSI — do not read it with classic 30/70 logic. Its input is ta.mom(close,10), so rsiVal = 75 does not mean "price is overbought", it means "10-bar momentum has been consistently widening". This line swings around 50 far faster and far more symmetrically than a price RSI, and hits the extremes much more often. Consequence: the number of RSI pivots (and therefore of divergences) is significantly higher than on a conventional RSI divergence indicator.
- The "price lower low" is measured at the RSI pivot bar, not at a real price low. The code compares low[5] at this RSI pivot bar against low[5] at the previous RSI pivot bar. Because pivots are found on the RSI line, that bar is not necessarily a genuine price swing low — it is simply whatever bar happens to sit at the RSI low. A divergence can therefore be confirmed even when, by eye, price never made a clear new low.
- The spacing filter is really 6–51 bars, not 5–50. The code calls _inRange(foundPL[1]) — using the pivot flag shifted back by one bar — so ta.barssince returns exactly (real distance − 1). That one-bar skew is irrelevant in live trading, but worth knowing if you port the logic to MT5 or edit the constants.
- Broken (dashed) bands are NEVER cleaned up. When a zone is broken it is removed from the tracking array — and the qtyDivLevels cap only counts what is still IN the array. So the dashed lines stay on the chart forever and pile up over time. On a chart with many bars they will quietly eat through the max_lines_count = 500 budget, and once the ceiling is hit TradingView silently deletes the oldest lines — including bands that are still valid. If old bands seem to vanish on a long chart, this is why.
- The loop deletes elements while iterating over them. The for dl in arr block calls arr.remove() from inside itself. Pine warns against modifying an array while looping over it: when one zone is broken, the element right after it can be skipped on that pass. The consequence is mild — the skipped zone gets handled on the next bar, so a band may lag by exactly 1 bar when several zones break at once.
- The zone's survival condition is fairly loose. A Bull zone only dies when high <= level, i.e. the ENTIRE candle must sit below the support level. Price piercing the level intraday and closing back above it (a long wick) will NOT kill the zone. This is a deliberate design choice to filter out wick-hunting noise, but it also makes zones survive longer than many people expect.
- The whole detection block sits inside if doCheck. Functions that need a continuous history (ta.pivotlow, ta.valuewhen, ta.barssince) should in principle be called on every bar. It is harmless here because enableDivCheck is a fixed input for the whole run — either always on or always off. But if someone edits the code to toggle it dynamically off market conditions, the results will be wrong.