1. Wolfe Waves Indicator Description [BigBeluga]
Automatic detection tool for the Wolfe Waves reversal pattern — built on market cycle and geometry theory
1.1 Indicator Concept
The Wolfe Waves indicator is based on the theory developed by Bill Wolfe in the 1980s–1990s. He was a trader who focused on market geometry and the natural rhythm cycles of price.
Core idea: Price doesn’t move randomly; it forms symmetrical wave structures that reflect the equilibrium between supply and demand. When price reaches an equilibrium point, a sharp trend reversal may occur.
The Wolfe Waves pattern consists of 5 key pivot points (high–low–high–low–high, or the inverse), creating a geometric structure with self-balancing properties. When these 5 points appear and satisfy the geometric rules, the indicator projects:
- Bullish Wolfe Wave: price is compressing downward and is likely to bounce strongly from point 5
- Bearish Wolfe Wave: price is stretching upward and is likely to fall sharply from point 5
1.2 Indicator Features
On-chart components:
-
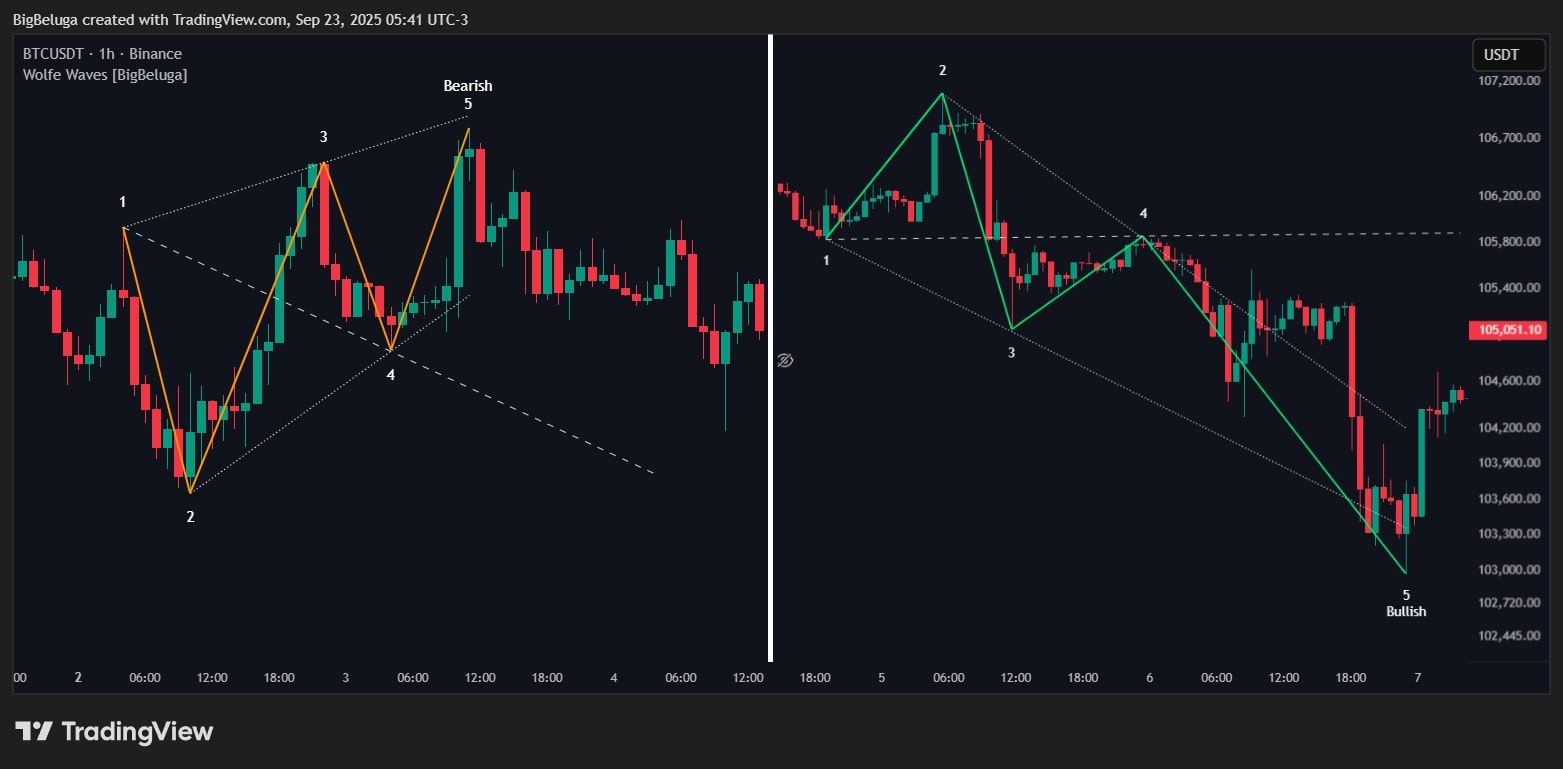
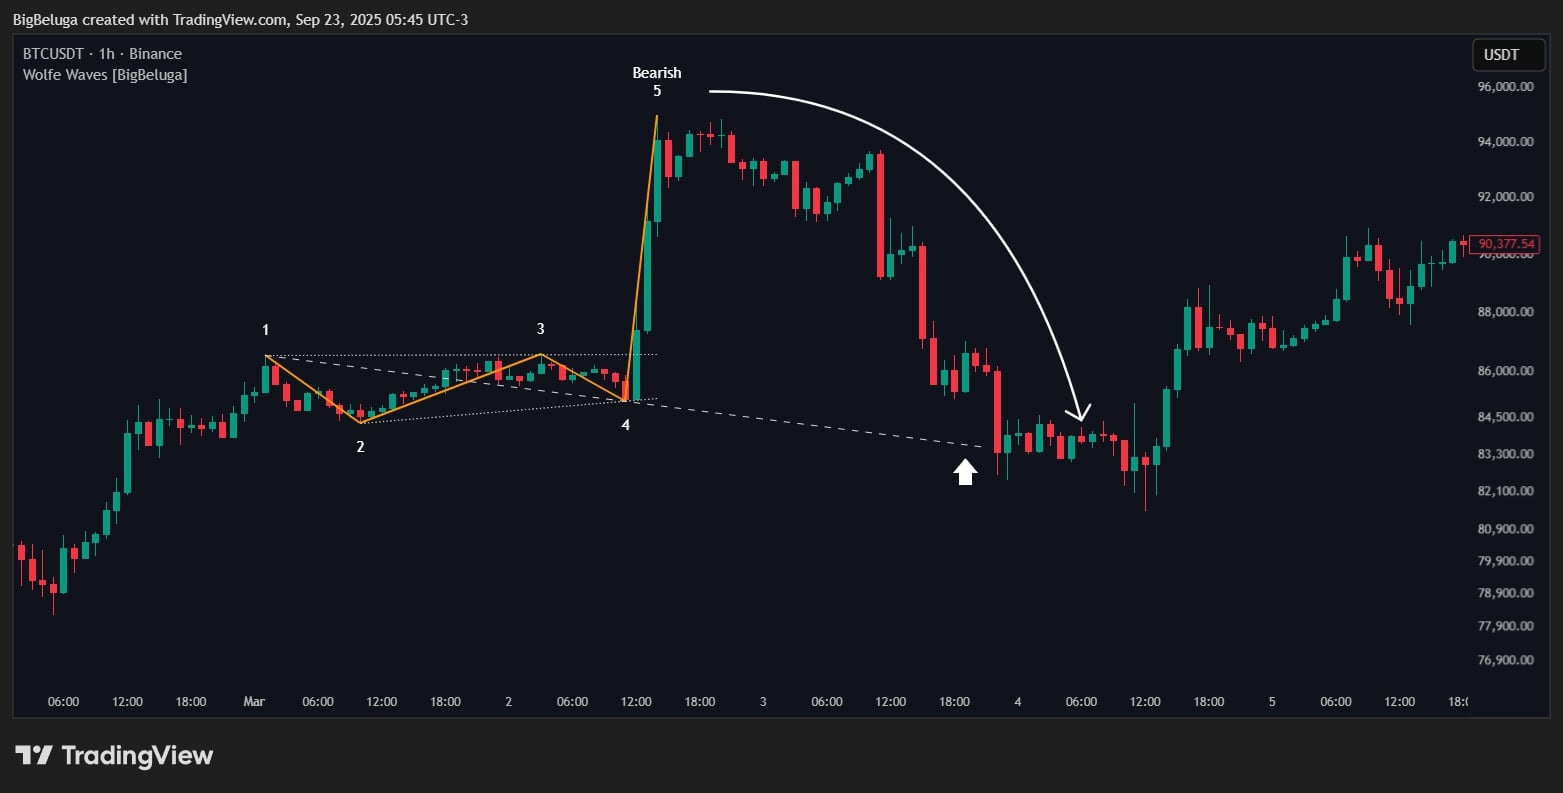
Numeric labels 1 to 5: mark the 5 pivots (highs/lows) forming the Wolfe Wave. Label 5 includes “Bullish” or “Bearish” to denote the wave type.
Role: helps traders recognize the structure and key locations. -
Four solid lines: connect points 1–2, 2–3, 3–4, 4–5 (green for Bullish, orange for Bearish).
Role: draws the Wolfe shape so the pattern is visually clear. -
Dashed line: extended from point 1 through point 4 to project the target zone (EPA – Expected Price Arrival).
Role: indicates take-profit (TP) when price reacts from point 5. -
Two dotted lines: extended from points 1–3 and 2–4 to aid geometric assessment.
Role: provide extra information about slope and symmetry. -
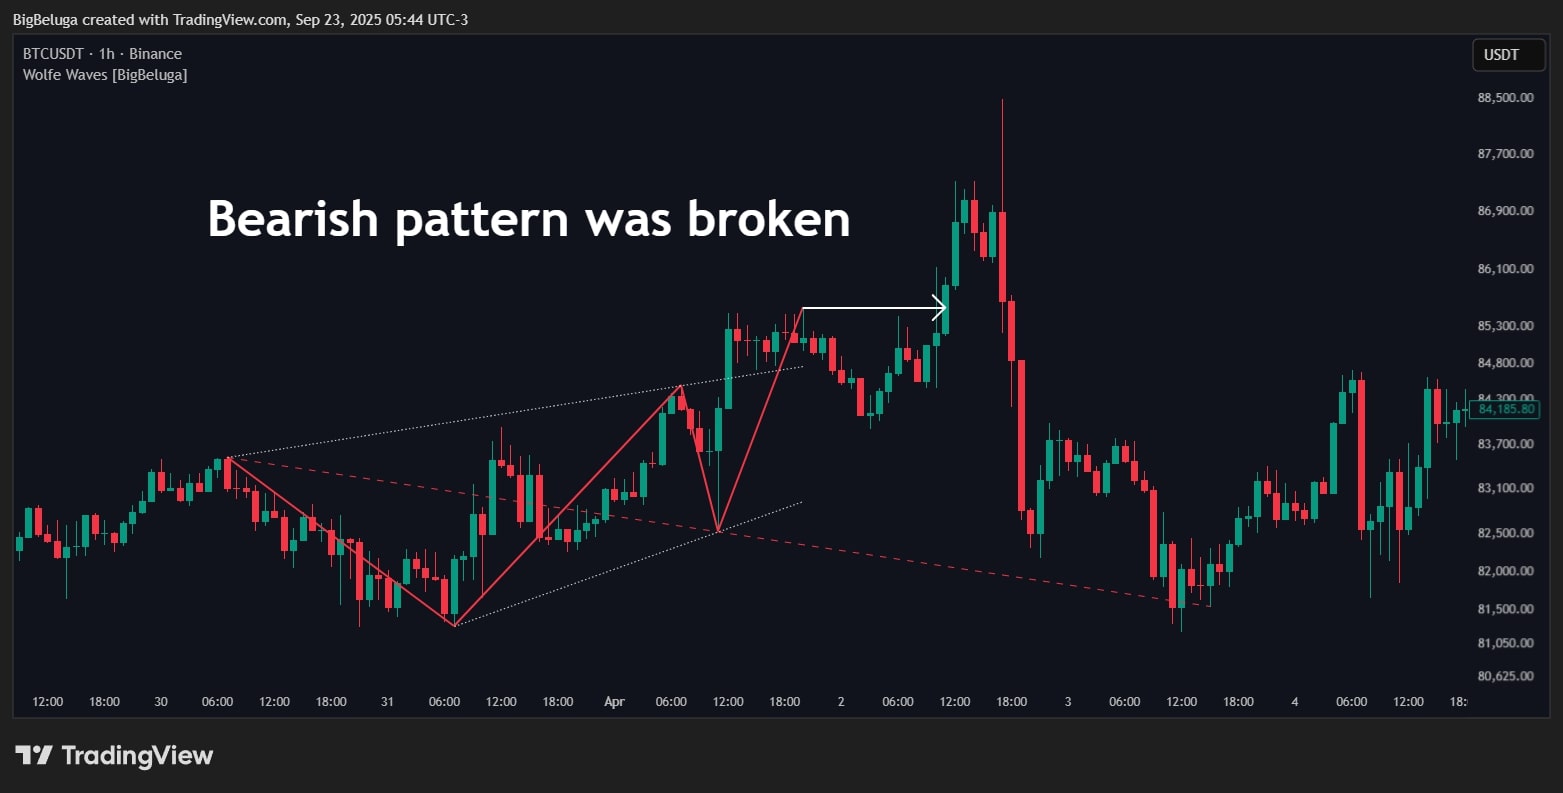
All lines turn red: when the pattern is “invalidated” (price moves against expectations).
Role: instant warning that the setup failed; exit or avoid entries.
Alerts:
- The indicator automatically detects when 5 pivots complete according to the geometry rules → a new pattern appears on the chart.
- When the pattern is invalidated (price breaks the opposite way) → lines turn red → visual alert.
- Note: The code does not include a built-in alert() function, but you can add alerts based on the appearance of label 5 or the red color state.
1.3 How to Use the Indicator
- Select Bullish or Bearish mode: depending on the direction you want to trade. Choose “Bullish” for long setups; choose “Bearish” for short setups.
- Wait for all 5 pivots: the indicator will automatically label 1 through 5 when a valid Wolfe structure is found.
-
Enter near point 5:
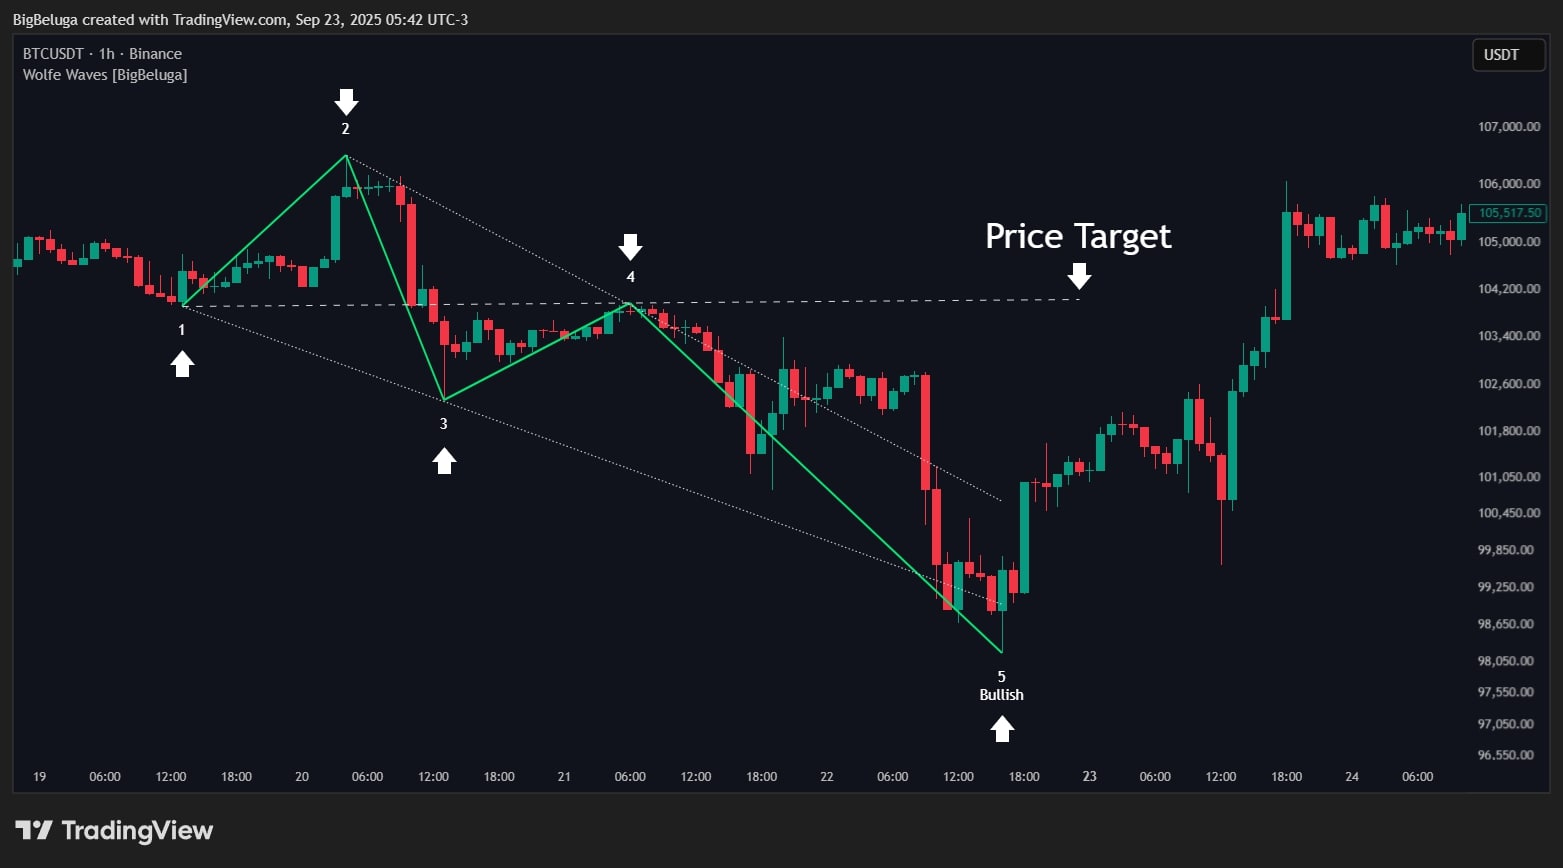
- For a Bullish Wave: wait for price to touch or approach point 5 (the 5th low) → place a BUY, targeting the EPA (dashed line).
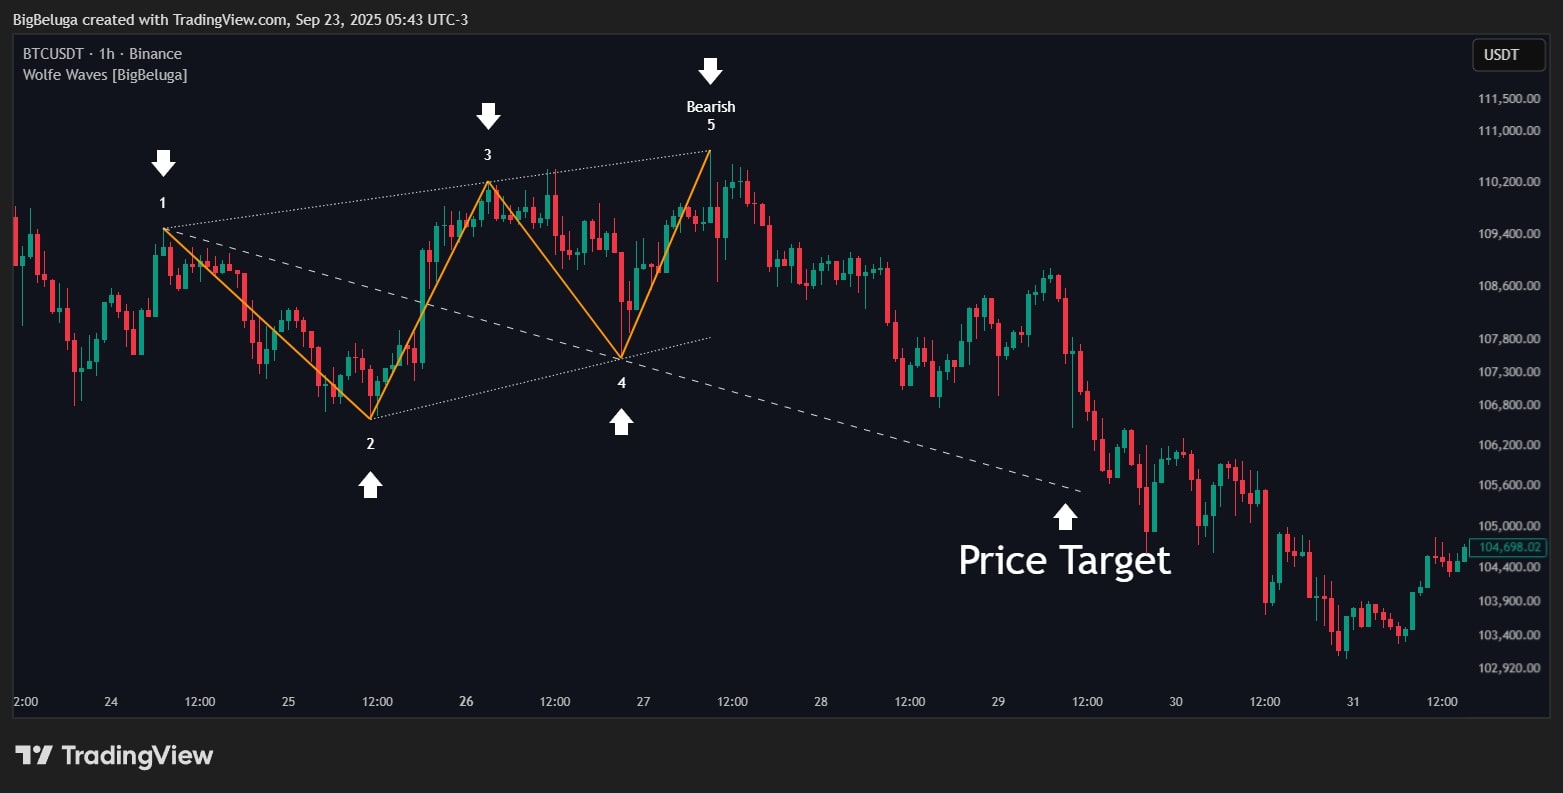
- For a Bearish Wave: wait for price to touch or approach point 5 (the 5th high) → place a SELL, targeting the EPA.
- Set take-profit (TP): at the dashed EPA line — the projected equilibrium area.
- Set stop loss (SL): beyond point 5 by a safe margin. For Bullish, SL below point 5; for Bearish, SL above point 5.
- Monitor line colors: if lines turn red → pattern failed → cut loss or do not enter.
- Combine with other tools: add momentum indicators, volume, or higher-timeframe analysis to increase confidence.
→ Place a BUY at $100.5, SL at $98, TP at $110.
If price rallies as expected → take profit at $110.
If price drops below $98 and lines turn red → stop out.
1.4 How the Indicator Works
Inputs & roles:
-
sensetivity (default 10): pivot detection sensitivity. Lower values = more sensitive, more pivots (more noise). Higher values = slower, only major pivots.
Role: controls pattern frequency — crucial for signal filtering. -
isbull: choose “Bullish” or “Bearish” — determines which wave type is searched.
Role: aligns with your trading bias. -
bearCol and bullcol: display colors for each wave type (orange for Bearish, green for Bullish).
Role: quick visual identification on chart. -
Price data (OHLC): high, low, close of each candle.
Role: raw inputs for pivot calculations and invalidation checks.
Main logic blocks:
-
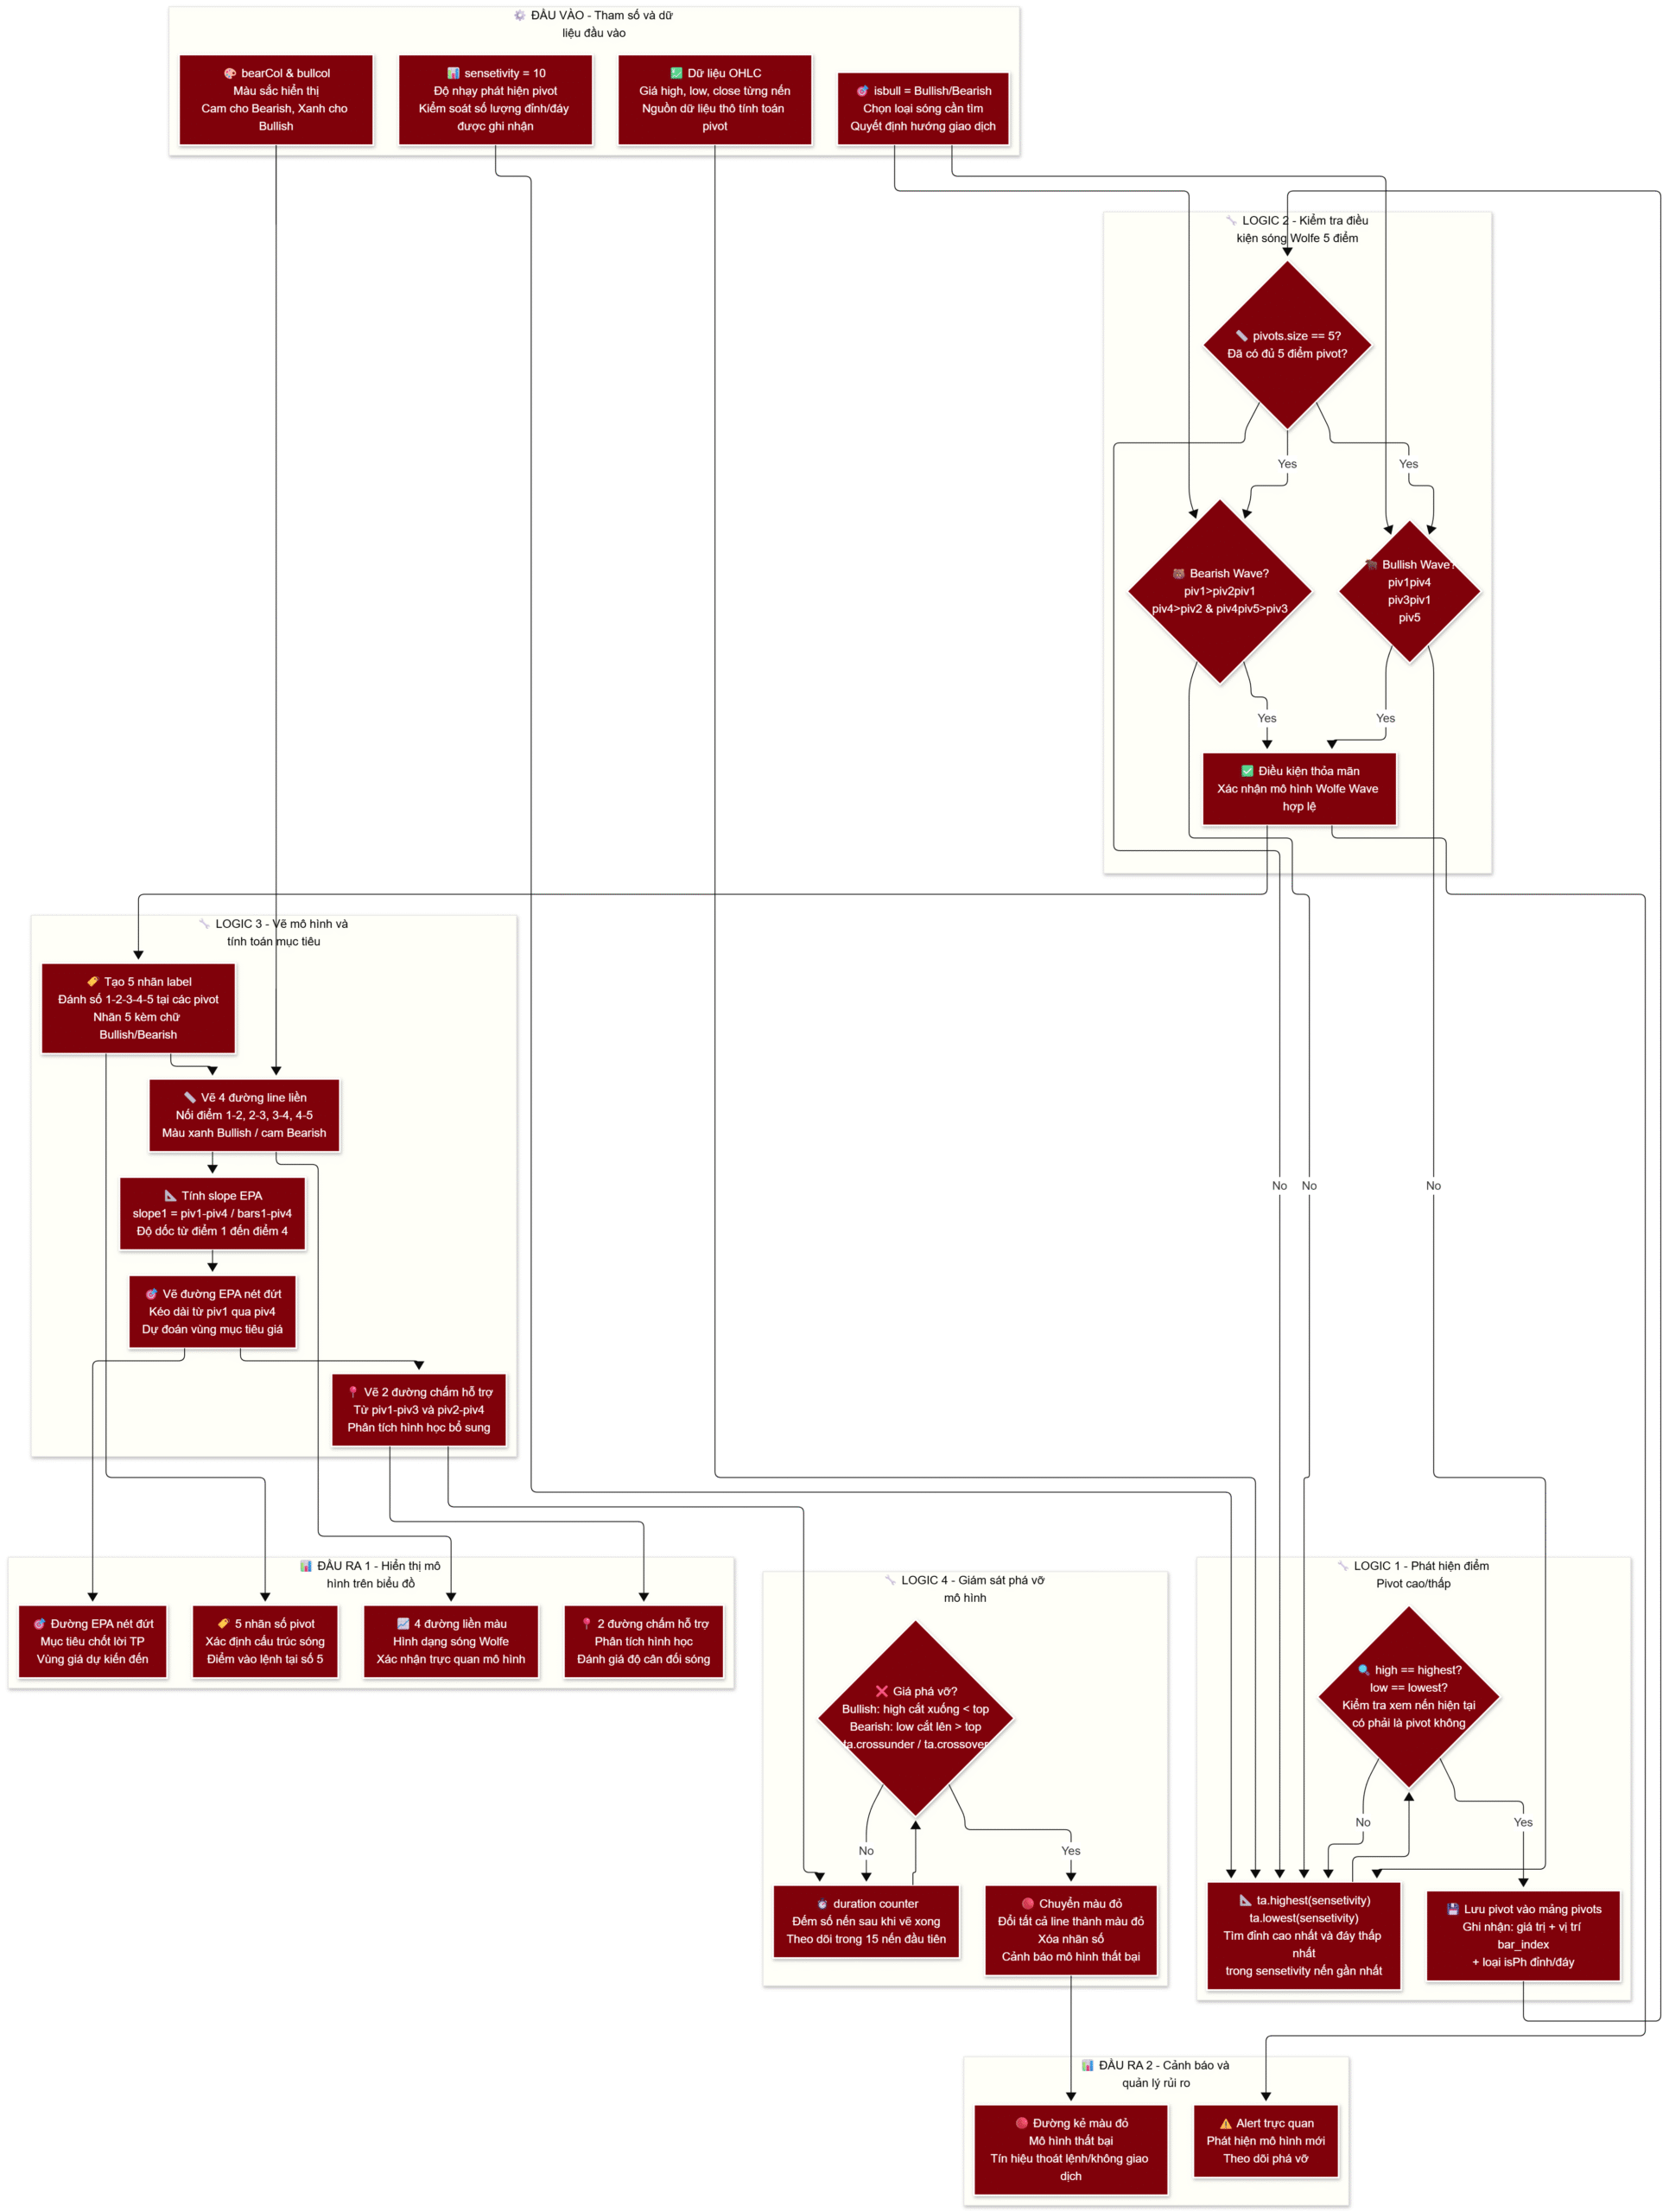
Block 1 – Pivot (high/low) detection:
Use ta.highest(len) and ta.lowest(len) to find the highest high and lowest low within the last len candles.
When a new high/low is detected, store its bar index and value in the pivots array.
Role: identifies turning points — the foundation of Wolfe waves. -
Block 2 – Wolfe wave validation:
When the pivots array holds 5 points, check if they satisfy the geometry rules:- Bearish Wave: piv1 > piv2 < piv3 > piv1 and piv4 > piv2 and piv4 < piv1 and piv5 > piv3
- Bullish Wave: piv1 < piv2 > piv4 and piv3 < piv1 and piv4 > piv1 and piv5 < piv3
Role: filters random pivot structures, retaining only true Wolfe patterns. -
Block 3 – Drawing & projection:
If conditions hold, the indicator:- Plots 5 numeric labels at pivot points
- Draws 4 solid lines connecting 1–2–3–4–5
- Computes the slope between points 1 and 4, extends it as the EPA (dashed) line
- Adds two auxiliary dotted lines (1–3 and 2–4)
Role: visualizes the pattern and provides clear price targets. -
Block 4 – Pattern invalidation:
After plotting, the indicator tracks price over the next 15 candles:- For a Bullish Wave: if the high crosses under point 5 (ta.crossunder(high, top)) → invalidation
- For a Bearish Wave: if the low crosses above point 5 (ta.crossover(low, top)) → invalidation
- On invalidation → all lines turn red, labels are removed
Role: warns of failure, aiding risk management.
Outputs mapped to display & usage:
- Five numeric labels: show the 5 pivot locations → help identify structure and the entry (point 5).
- Four solid lines: draw the Wolfe shape → visual confirmation of the forming pattern.
- EPA (dashed) line: target projection → place take-profit (TP).
- Two dotted lines: geometric aids → improve confidence when assessing symmetry.
- Red color state: failure warning → exit or avoid trading.
Inputs:
- Last 100 candles: high = [102, 105, 103, 108, 107, ..., 95], low = [98, 100, 99, 104, 103, ..., 90]
- sensetivity = 10
- isbull = true (search Bullish Wave)
Processing logic:
1. Scan every 10 candles, detect highs/lows: found piv1 = 98, piv2 = 105, piv3 = 96, piv4 = 103, piv5 = 90
2. Check Bullish conditions: 98 < 105 ✅, 105 > 103 ✅, 96 < 98 ✅, 103 > 98 ✅, 90 < 96 ✅ → Valid!
3. Compute slope from piv1 (98) to piv4 (103): slope = (103−98) / (bars between)
4. Extend as EPA line → project move toward 105–108
Displayed outputs:
- Plot labels “1” at 98, “2” at 105, “3” at 96, “4” at 103, “5 Bullish” at 90
- Draw four green lines connecting 1–2–3–4–5
- Draw a dashed line from piv1 through piv4, pointing to 105–108
- If price rises from 90 to 106 → take profit
- If price falls below 90 (high < 90) → lines turn red → stop out
- The indicator only plots after all 5 pivots complete, so there is lag. Avoid premature entries.
- Wolfe Waves are not 100% accurate. Always use a stop loss.
- Combine with volume, RSI, MACD, or multi-timeframe analysis to improve win rate.

Use the analysis above + the code below to instruct AI to modify the indicator and turn it into a trading bot—no coding required!
How to do it here -> 👉ZERO2HERO👈
					// This work is licensed under Creative Commons Attribution-NonCommercial-ShareAlike 4.0 International
// https://creativecommons.org/licenses/by-nc-sa/4.0/
// © BigBeluga


//@version=6
indicator("Wolfe Waves [BigBeluga]", overlay = true, max_labels_count = 500, max_lines_count = 500)
plot(na, editable = false)

// INPUTS ――――――――――――――――――――――――――――――――――――――――――――――――――――――――――――――――――――――――――――――――――――――――――――――――――――――――{
sensetivity = input.int(10)
isbull = input.string("Bearish", "Wave", ["Bullish", "Bearish"]) == "Bullish"
bearCol = input.color(color.orange)
bullcol = input.color(color.lime)

var int     index_low   = na
var float   loww        = na
var int     index_high  = na
var float   highh       = na
var bool    direction   = bool(na)
var isPh = false


type pivot
    float val
    int indx
    bool isPh
var pivots = array.new<pivot>()


var lastIndex = 0

type wave
    array<label> lbls
    array<line> lines

var draws = array.new<wave>()
var duration = 0
var isdetected = false
var top = 0.

atr = ta.atr(200)

// }


// CALCULATIONS――――――――――――――――――――――――――――――――――――――――――――――――――――――――――――――――――――――――――――――――――――――――――――――{
len = sensetivity
float highest = ta.highest(len)
float lowest  = ta.lowest(len)

if pivots.size() > 5
    pivots.shift()


stl1   = line.style_solid

if high == highest
    direction := true
if low  == lowest
    direction := false

if low[1] == lowest[1] and low > lowest
    index_low := bar_index[1]
    loww      := low[1]

if high[1] == highest[1] and high < highest
    index_high := bar_index[1]
    highh      := high[1]

if direction != direction[1] and direction
    pivots.push(pivot.new(loww, index_low, false))

if direction != direction[1] and not direction
    pivots.push(pivot.new(highh, index_high, true))


if pivots.size() == 5

    piv1 = pivots.get(0)
    piv2 = pivots.get(1)
    piv3 = pivots.get(2)
    piv4 = pivots.get(3)
    piv5 = pivots.get(4)

    isBearWWave = piv1.val > piv2.val and piv2.val < piv3.val and piv3.val > piv1.val and piv4.val > piv2.val and piv4.val < piv1.val and piv5.val > piv3.val
    isBullWWave = piv1.val < piv2.val and piv2.val > piv4.val and piv3.val < piv1.val and piv4.val > piv1.val and piv5.val < piv3.val

    cond = isbull ? isBullWWave : isBearWWave
// }

// PLOT ――――――――――――――――――――――――――――――――――――――――――――――――――――――――――――――――――――――――――――――――――――――――――――――――――――――――――――{
    if cond and not isdetected and (lastIndex != piv1.indx) and piv1.indx > lastIndex and barstate.isconfirmed

        labels = array.new<label>()
        lines = array.new<line>()

        lastIndex := piv5.indx
        for p in pivots
            index = str.tostring(pivots.indexof(p)+1)
            labels.push(label.new(p.indx, p.val, style = p.isPh ? "ldn" : "lup", color = color(na), text = index == "5" ? (isbull ? "5\nBullish" : "Bearish\n5") : index))

        color = isbull ? bullcol : bearCol

        l1 = line.new(piv1.indx, piv1.val, piv2.indx, piv2.val, color = color, width = 2)
        l2 = line.new(piv2.indx, piv2.val, piv3.indx, piv3.val, color = color, width = 2)
        l3 = line.new(piv3.indx, piv3.val, piv4.indx, piv4.val, color = color, width = 2)
        l4 = line.new(piv4.indx, piv4.val, piv5.indx, piv5.val, color = color, width = 2)

        bars1 = piv4.indx - piv1.indx
        slope1 = (piv1.val-piv4.val)/bars1

        bars2 = piv3.indx - piv1.indx
        slope2 = (piv3.val-piv1.val)/bars2
        b2 = piv5.indx - piv3.indx

        bars3 = piv4.indx - piv2.indx
        slope3 = (piv4.val-piv2.val)/bars3
        b3 = piv5.indx - piv4.indx


        l5 = line.new(piv1.indx, piv1.val, piv4.indx+bars1, piv4.val-slope1*bars1, width = 1, style = line.style_dashed, color = chart.fg_color)


        l6 = line.new(piv1.indx, piv1.val, piv3.indx+b2, piv3.val+slope2*b2, width = 1, style = line.style_dotted, color = chart.fg_color)
        l7 = line.new(piv2.indx, piv2.val, piv4.indx+b3, piv4.val+slope3*b3, width = 1, style = line.style_dotted, color = chart.fg_color)


        lines.push(l1)
        lines.push(l2)
        lines.push(l3)
        lines.push(l4)
        lines.push(l5)

        isdetected := true
        duration := 0
        top := piv5.val

        draws.push(wave.new(labels, lines))

if isdetected
    duration += 1

if duration == 50
    isdetected := false


crossUp = ta.crossunder(high, top)
crossDn = ta.crossover(low, top)

if duration < 15

    cond = isbull ? crossUp : crossDn

    if cond and top == top[1] and barstate.isconfirmed

        d = draws.last()
        for l in d.lines
            l.set_color(color.red)

        for l in d.lbls
            l.delete()
// }
Other Indicators
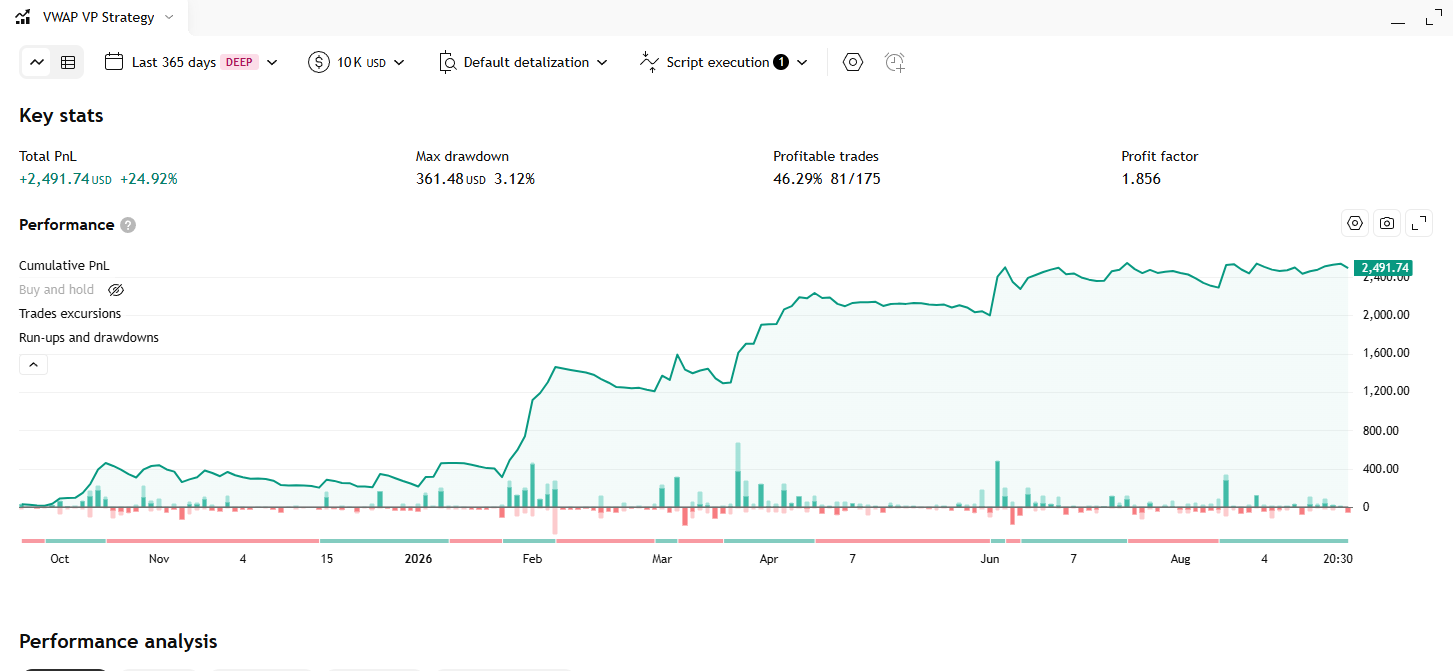
VWAP Volume Profile Indicator – Strategy
Một hồ sơ khối lượng hai chiều dựng trên đường VWAP thay vì trên giá: khối lượng của mỗi nến được gắn dấu cộng hoặc trừ tuỳ VWAP đang lên hay xuống, rồi gom lại thành biểu đồ cột nằm ngang chìa ra cả hai phía ở mép phải chart.
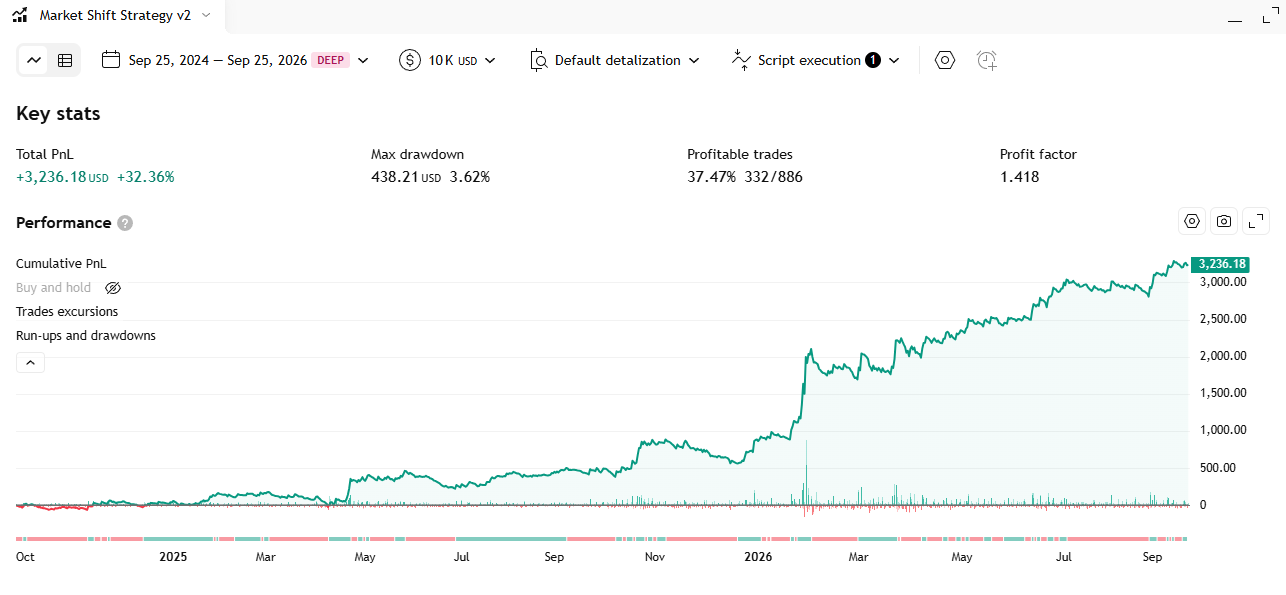
Market Shift Levels Indicator – Strategy
Every time the HMA moving average flips its slope, the indicator locks in the high or the low of that exact candle as a “boundary level”, colors every candle relative to it, and flags the moments price pokes through the level and immediately fails.
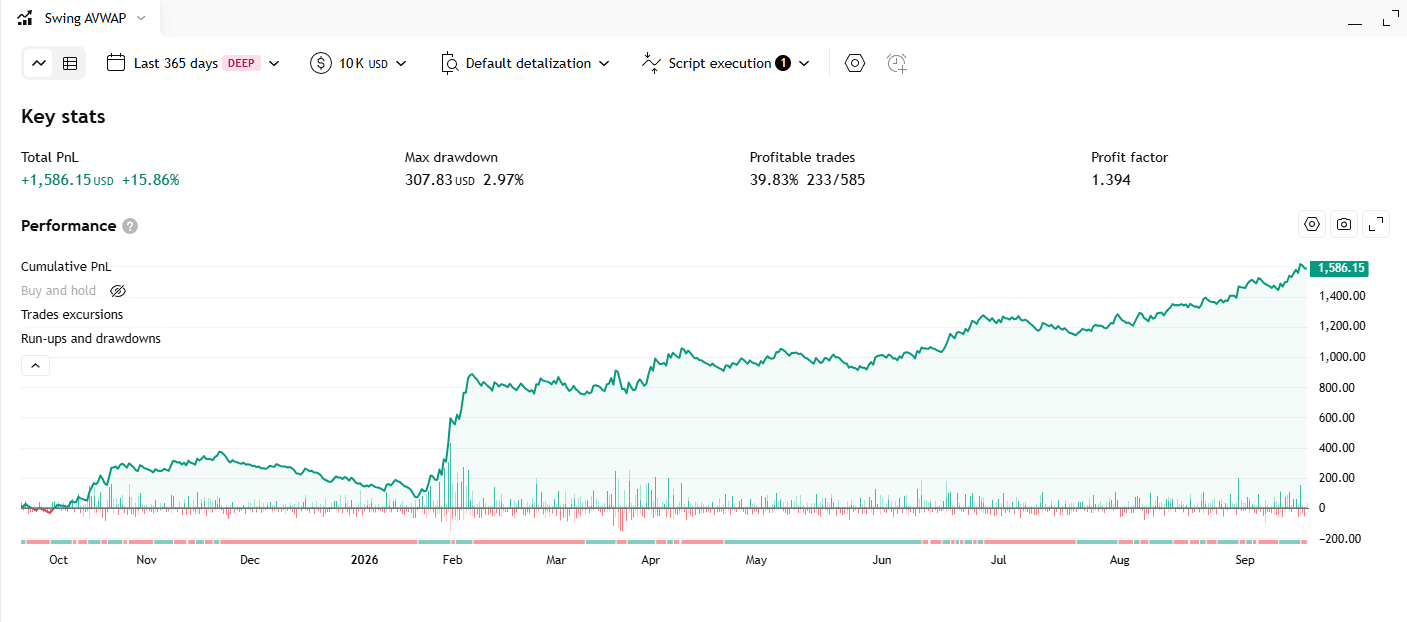
Dynamic Swing Anchored VWAP Indicator – Strategy
Automatically anchors a VWAP line to the most recent swing reversal point, rebuilds the whole line from that anchor every time market structure flips, and tags each anchor with an HH / HL / LH / LL structure label.