1. Spring & Upthrust Trap Indicator Description (Zeiierman)
Indicator that detects liquidity traps using the Wyckoff method - when price "fakes" a breakout then immediately reverses
1.1 Indicator Concept
This indicator is based on Wyckoff theory about "liquidity traps". The core idea is: large investors (smart money) intentionally push price to break through an important price zone to "trigger" stop loss orders from the crowd, then immediately reverse in the opposite direction.
There are two main types of traps:
- Spring (Bullish Trap): Price fakes a breakdown below the bottom of the price range (to trigger sell orders), but immediately bounces back strongly → bullish signal
- Upthrust (Bearish Trap): Price fakes a breakout above the top of the price range (to trigger buy orders), but immediately drops sharply → bearish signal
This indicator believes: when a breakout fails quickly, it's a sign that the trend is about to reverse strongly.
1.2 Indicator Features
- Display X-A-B-C geometry: Draws straight lines connecting 4 important points (X, A, B, C) forming the trap shape. Green lines for Spring (bullish), red for Upthrust (bearish).
- Display price zone box: Draws a rectangle (box) with light fill between points X and A, representing the "price zone" where price was ranging before the fake breakout.
- Display price zone boundary lines: Draws 2 horizontal lines extending to the right (dotted lines) at price levels X and A, helping you easily track important support/resistance levels.
- Display signal symbols: When Spring is detected, displays an upward triangle arrow in green. When Upthrust is detected, displays a downward triangle arrow in red.
- Alert: Sends notifications when Spring or Upthrust is detected, helping you not miss trading opportunities even when not watching the chart.
1.3 How to Use the Indicator
- Trading Spring (Bull): When a Spring signal appears (green upward arrow), this indicates price may rise strongly. You can consider entering a BUY (Long) position when price confirms return to the price zone or breaks above level A. Set Stop Loss below point B (the lowest point of the fake "sweep"). Take Profit can be placed at next resistance levels or according to appropriate Risk:Reward ratio.
- Trading Upthrust (Bear): When an Upthrust signal appears (red downward arrow), this indicates price may drop strongly. You can consider entering a SELL (Short) position when price confirms return to the price zone or breaks below level A. Set Stop Loss above point B (the highest point of the fake "sweep"). Take Profit can be placed at next support levels.
- Combine with other indicators: To increase accuracy, combine Spring & Upthrust with other indicators like Volume, RSI, or Japanese candlestick patterns to confirm the trend.
- Pay attention to "sweep" size: The indicator has filters to eliminate sweeps that are too small (noise) or too large (may be real trend). You can adjust Min Sweep and Max Sweep to suit different assets and timeframes.
- Watch for retest: After a signal appears, price often returns to "test" the price zone boundary (X or A) from inside. This is a safer entry point.
1.4 How the Indicator Works
Inputs & Roles
-
ZigZag Length: This is an integer (default 12), determining
the sensitivity of detecting "peak" and "valley" points on the chart.
- Role: This value controls the minimum distance (number of candles) for a point to be considered a peak or valley. For example: if ZigZag Length = 12, a candle is only considered a peak when it's the highest point within 12 surrounding candles.
- If increased (e.g., 20): Indicator will be "smoother", detect fewer signals, only catch major peaks/valleys → suitable for long timeframes or low volatility assets.
- If decreased (e.g., 5): Indicator will be more "sensitive", detect more signals, catch even minor peaks/valleys → may have more noise.
-
Show Patterns: This is a dropdown selection with 3 options:
"All", "Spring (Bull)" (only bullish traps), "Upthrust (Bear)" (only bearish traps).
- Role: Filters the type of signal you want to see. If you select "Spring (Bull)", the indicator will only display bullish signals, ignoring bearish signals.
-
Min Sweep: This is a decimal number from 0.0 to 1.0
(default 0.05), representing the minimum percentage that price must "exceed" the price zone
boundary to be considered a valid "sweep".
- Role: Filters out sweeps that are too small (noise). For example: if the price zone is 100 points high (from X to A), and Min Sweep = 0.05, price must exceed the boundary by at least 5 points (100 × 0.05) to be considered a sweep.
- If increased (e.g., 0.10): Only accepts larger sweeps → fewer signals but higher quality.
- If decreased (e.g., 0.02): Accepts even small sweeps → more signals but may have noise.
-
Max Sweep: This is a decimal number from 0.01 to 1.5
(default 0.35), representing the maximum percentage that price can "exceed" the price zone
boundary.
- Role: Filters out sweeps that are too large (may be real trend, not trap). For example: if the price zone is 100 points high, and Max Sweep = 0.35, price can only exceed the boundary by maximum 35 points. If exceeded, the indicator won't consider it a trap.
- If increased (e.g., 0.50): Accepts deeper sweeps → more signals but may catch real trends too.
- If decreased (e.g., 0.20): Only accepts shallow sweeps → fewer signals but more accurate.
-
Confirm Pad: This is a decimal number from 0.0 to 0.5
(default 0.00), representing additional distance that price must exceed the opposite
boundary (point A) to confirm the signal.
- Role: Increases signal certainty. For example: if the price zone is 100 points high, and Confirm Pad = 0.10, after the sweep, price must reverse and exceed the opposite boundary by an additional 10 points (100 × 0.10) to be considered a valid signal.
- If increased (e.g., 0.20): Requires stronger confirmation → fewer signals but higher quality, avoids false signals.
- If decreased (e.g., 0.00): No additional confirmation required → more signals but may have false signals.
- Bull Fill / Bear Fill: These are color selections to fill the price zone box. Light green for Spring, light red for Upthrust.
- Bull Lines / Bear Lines: These are color selections for the X-A-B-C connecting lines. Green for Spring, red for Upthrust.
- Leg Style: This is a dropdown selection with 3 options: "Solid", "Dashed", "Dotted".
- Leg Width: This is an integer from 1 to 4 (default 2), determining the thickness of the X-A-B-C connecting lines.
- Level Width: This is an integer from 1 to 4 (default 2), determining the thickness of the 2 extending horizontal lines (at X and A).
- Extend Levels (bars): This is an integer from 1 to 500 (default 120), determining the number of candles that the 2 horizontal lines will extend to the right.
Main Logic Blocks
🎯 Final Output: Spring or Upthrust Signal
-
When the indicator detects a complete trap pattern, it will:
- Draw 3 straight lines connecting 4 points X → A → B → C (green for Spring, red for Upthrust)
- Draw price zone box between X and A
- Draw 2 extending horizontal lines at levels X and A
- Display triangle arrow (up for Spring, down for Upthrust)
- Send alert if you've enabled it
🔍 How to Detect X-A-B-C Pattern
-
The indicator needs at least 4 pivot points (peaks/valleys) to form the pattern.
These points are named in chronological order:
- X: Oldest pivot point (4th from current)
- A: 3rd pivot point from current
- B: 2nd pivot point from current (the "sweep" point - fake breakout)
- C: Newest pivot point (the "rejection" point - reversal)
-
Conditions to detect Spring (Bullish Trap):
- Point A must be higher than point X (forming price zone with A on top, X on bottom)
- Point B must be lower than point X (breaks below bottom of price zone)
- Point C must be higher than point A (+ confirm pad if any) (strong reversal upward)
- Sweep size (|B - X| / |A - X|) must be within [Min Sweep, Max Sweep]
Specific example: Assume X = 100, A = 120 (price zone 20 points high). Price drops to B = 98 (breaks below X by 2 points). Then price bounces to C = 122 (exceeds A by 2 points). Sweep size = |98 - 100| / |120 - 100| = 2/20 = 0.10 (10%). If Min Sweep = 0.05 and Max Sweep = 0.35, this is a valid Spring.
-
Conditions to detect Upthrust (Bearish Trap):
- Point A must be lower than point X (forming price zone with X on top, A on bottom)
- Point B must be higher than point X (breaks above top of price zone)
- Point C must be lower than point A (- confirm pad if any) (strong reversal downward)
- Sweep size (|B - X| / |A - X|) must be within [Min Sweep, Max Sweep]
Specific example: Assume X = 120, A = 100 (price zone 20 points high). Price rises to B = 122 (breaks above X by 2 points). Then price drops to C = 98 (exceeds A downward by 2 points). Sweep size = |122 - 120| / |120 - 100| = 2/20 = 0.10 (10%). If Min Sweep = 0.05 and Max Sweep = 0.35, this is a valid Upthrust.
📍 How to Find Pivot Points (peaks/valleys)
- The indicator uses the ZigZag method to find pivot points. This simplifies the price chart into straight line segments connecting important peaks and valleys.
-
How ZigZag works:
- The indicator scans through each candle on the chart
- A candle is considered a peak (pivot high) if it's the highest point within ZigZag Length surrounding candles. For example: if ZigZag Length = 12, the current candle must be higher than 12 candles to the left and 12 candles to the right.
- A candle is considered a valley (pivot low) if it's the lowest point within ZigZag Length surrounding candles.
- The indicator stores a maximum of 6 most recent pivot points in an "array", with the newest point at the beginning of the list.
- Special handling: If 2 peaks (or 2 valleys) appear consecutively without a valley (or peak) in between, the indicator will only keep the higher (or lower) point and ignore the other. This helps avoid noise and keeps the ZigZag structure always alternating peak-valley.
-
Pivot direction: Each pivot is assigned a "direction":
- +1: Normal peak
- -1: Normal valley
- +2: Peak higher than previous peak (Higher High)
- -2: Valley lower than previous valley (Lower Low)
🎨 How to Draw Geometry and Boundary Lines
-
When a new pattern is detected, the indicator will:
- Draw 3 straight lines: X → A, A → B, B → C (using colors and line styles according to settings)
- Draw price zone box from point X to point A, extending to point B (or point X if B is closer)
- Draw 2 horizontal lines: one at price level X, one at price level A, extending to the right by the number of candles set (Extend Levels)
- Overlap handling: If a new pattern appears before the boundary lines of the old pattern finish extending, the indicator will automatically shorten the old boundary lines to avoid overlapping, keeping the chart cleaner.
Outputs & Roles in Usage
- Spring signal (green upward arrow): This is a bullish signal. You can consider entering a BUY (Long) position when price confirms return to the price zone or breaks above level A.
- Upthrust signal (red downward arrow): This is a bearish signal. You can consider entering a SELL (Short) position when price confirms return to the price zone or breaks below level A.
- Price zone boundary lines (X and A): These are important support/resistance levels. You can use them to set Stop Loss or Take Profit.
- Price zone box: Helps you easily identify the price zone where price was ranging before the fake breakout.
- Alert: Helps you not miss trading opportunities even when not watching the chart.


Backtest Results - Spring & Upthrust Trap Strategy
Performance analysis and optimal settings for the trading strategy
Strategy Development
To find the optimal approach for entry and risk management for this indicator, I converted the indicator into a strategy on TradingView with comprehensive professional capital and risk management features.
Core Strategy Features
🎯 Entry Management
- Enable/Disable Strategy: Toggle strategy execution on/off
- Direction Control: Allow LONG positions, SHORT positions, or both
- Entry Type: Choose between Market orders or Limit orders at different price levels (Market, Mid Range, Near Line, Far Line)
- Exit on Opposite Signal: Automatically close positions when an opposite signal appears
💰 Position Sizing Management
- Size Type: Fixed Amount (fixed number of contracts) or Percentage of Equity (percentage of capital)
- Equity Percentage: Set the percentage of capital to use for each trade
🛡️ Stop Loss Management
- Stop Loss Type: Swing Point (nearest swing point) or Far Line (far boundary line)
- Swing Lookback: Number of bars to look back for swing point detection
- Spread Adjustment: Additional buffer distance for stop loss
🎯 Take Profit Management
- Risk:Reward Ratio: Set TP based on SL distance (e.g., RR = 4 means TP is 4x SL)
⚡ Break Even Protection
- BE Activation at RR: Automatically move SL to break even when price reaches a certain RR level
- Offset from Entry: Buffer distance from entry price
📊 Visualization
- Show TP/SL Boxes: Display visual boxes for take profit and stop loss levels
- Custom Colors: Separate colors for TP and SL boxes
Performance Results
After thorough backtesting, the strategy achieved impressive performance metrics:
Optimal Settings
The following settings proved most effective through backtesting:
Pattern Detection
Strategy Settings
Position Sizing
Stop Loss
Take Profit
Break Even
Visualization
Resources
📚 Useful Resources
Discover more tools and courses to enhance your trading skills
					// This Pine Script® code is subject to the terms of the Mozilla Public License 2.0 at https://mozilla.org/MPL/2.0/
// © STEEL-CITY-CREATORS

//@version=5
indicator("Elliott Wave (rules-based, compile-safe)", overlay=true, max_lines_count=500, max_labels_count=500)

// ── Inputs ────────────────────────────────────────────────────────────────────
left     = input.int(5,   "Pivot Left",  minval=1)
right    = input.int(5,   "Pivot Right", minval=1)
useATR   = input.bool(true, "Use ATR filter for swing threshold?")
atrLen   = input.int(14, "ATR Length", minval=1)
atrMult  = input.float(1.0, "ATR Multiplier", step=0.1)
minPct   = input.float(0.5, "Min % swing (if ATR off)", step=0.1)
maxBack  = input.int(2000, "Max bars back for drawing", minval=300)
showABC  = input.bool(true, "Attempt A–B–C after 5 waves?")
showZig  = input.bool(true, "Show ZigZag Lines?")
colorUp  = color.new(color.lime, 0)
colorDn  = color.new(color.red,  0)

// ── Globals (declare BEFORE any function uses them) ───────────────────────────
var pivotBars  = array.new_int()
var pivotPrice = array.new_float()
var pivotType  = array.new_int()    // +1 = high, -1 = low

var lineArr    = array.new_line()
var labelArr   = array.new_label()

var int  lastImpulseBar = na
var int  lastABCBar     = na
var bool impulseFound   = false
var bool impulseUp      = false

// ── Helpers ───────────────────────────────────────────────────────────────────
atr = ta.atr(atrLen)

toPctMove(a, b) =>
    math.abs(b - a) / a * 100.0

isSwingBigEnough(prev, curr) =>
    useATR ? math.abs(curr - prev) >= atrMult * atr : toPctMove(prev, curr) >= minPct

// Pivots (confirmed by right bars)
ph = ta.pivothigh(high, left, right)
pl = ta.pivotlow(low,  left, right)

// Add pivot if large enough
addPivot(b, p, t) =>
    bool pushed = false
    if array.size(pivotPrice) == 0
        array.push(pivotBars,  b)
        array.push(pivotPrice, p)
        array.push(pivotType,  t)
        pushed := true
    else
        last = array.get(pivotPrice, array.size(pivotPrice) - 1)
        if isSwingBigEnough(last, p)
            array.push(pivotBars,  b)
            array.push(pivotPrice, p)
            array.push(pivotType,  t)
            pushed := true
    pushed

drawZigZag() =>
    if showZig
        sz = array.size(pivotBars)
        if sz >= 2
            b1 = array.get(pivotBars,  sz - 2)
            p1 = array.get(pivotPrice, sz - 2)
            b2 = array.get(pivotBars,  sz - 1)
            p2 = array.get(pivotPrice, sz - 1)
            ln = line.new(b1, p1, b2, p2, extend=extend.none, width=2, color = p2 > p1 ? colorUp : colorDn)
            array.push(lineArr, ln)

makeLabel(txt, b, p, col) =>
    lb = label.new(b, p, txt, textcolor=color.white, color=col, style=label.style_label_center, size=size.tiny)
    array.push(labelArr, lb)
    lb

// Basic impulse validation using six prices (not arrays)
isUpImpulse(p0, p1, p2, p3, p4, p5) =>
    // L0, H1, HL2, HH3, HL4, HH5
    (p0 < p2 and p2 < p4) and (p1 < p3 and p3 < p5) and (p1 > p0 and p3 > p2 and p5 > p4)

isDnImpulse(p0, p1, p2, p3, p4, p5) =>
    // H0, L1, LH2, LL3, LH4, LL5
    (p0 > p2 and p2 > p4) and (p1 > p3 and p3 > p5) and (p1 < p0 and p3 < p2 and p5 < p4)

// A–B–C check given three prices (A,B,C) and whether prior impulse was up
isABC(pa, pb, pc, uptrend) =>
    uptrend ? (pa > pb and pc < pa and pc < pb) : (pa < pb and pc > pa and pc > pb)

// ── Collect pivots on confirmation ────────────────────────────────────────────
newHigh = not na(ph)
newLow  = not na(pl)

if newHigh
    addPivot(bar_index - right, ph, +1)
    drawZigZag()

if newLow
    addPivot(bar_index - right, pl, -1)
    drawZigZag()

// ── Wave detection & labeling ─────────────────────────────────────────────────
tryLabelImpulse() =>
    // Returns (found, uptrend)
    bool found = false, bool up = false
    sz = array.size(pivotBars)
    if sz >= 6
        // Gather last 6 pivots
        b0 = array.get(pivotBars,  sz - 6)
        b1 = array.get(pivotBars,  sz - 5)
        b2 = array.get(pivotBars,  sz - 4)
        b3 = array.get(pivotBars,  sz - 3)
        b4 = array.get(pivotBars,  sz - 2)
        b5 = array.get(pivotBars,  sz - 1)

        p0 = array.get(pivotPrice, sz - 6)
        p1 = array.get(pivotPrice, sz - 5)
        p2 = array.get(pivotPrice, sz - 4)
        p3 = array.get(pivotPrice, sz - 3)
        p4 = array.get(pivotPrice, sz - 2)
        p5 = array.get(pivotPrice, sz - 1)

        t0 = array.get(pivotType,  sz - 6)
        t1 = array.get(pivotType,  sz - 5)
        t2 = array.get(pivotType,  sz - 4)
        t3 = array.get(pivotType,  sz - 3)
        t4 = array.get(pivotType,  sz - 2)
        t5 = array.get(pivotType,  sz - 1)

        // Alternation (+1/-1) and pattern checks
        altUp   = (t0 == -1 and t1 == +1 and t2 == -1 and t3 == +1 and t4 == -1 and t5 == +1)
        altDown = (t0 == +1 and t1 == -1 and t2 == +1 and t3 == -1 and t4 == +1 and t5 == -1)

        upOk = altUp   and isUpImpulse(p0, p1, p2, p3, p4, p5)
        dnOk = altDown and isDnImpulse(p0, p1, p2, p3, p4, p5)

        if (upOk or dnOk)
            col = upOk ? color.new(color.teal, 0) : color.new(color.orange, 0)
            // Label 1..5 at pivots 1..5
            makeLabel("1", b1, p1, col)
            makeLabel("2", b2, p2, col)
            makeLabel("3", b3, p3, col)
            makeLabel("4", b4, p4, col)
            makeLabel("5", b5, p5, col)
            found := true
            up := upOk
    [found, up]

// On any new pivot, try to detect impulse (tuple destructuring!)
if (newHigh or newLow)
    [found, up] = tryLabelImpulse()
    if found and (na(lastImpulseBar) or bar_index > lastImpulseBar)
        impulseFound   := true
        impulseUp      := up
        lastImpulseBar := bar_index
        alert("Elliott impulse (1–5) completed: " + (impulseUp ? "UP" : "DOWN"), alert.freq_once_per_bar_close)

// ── Try A–B–C after impulse ───────────────────────────────────────────────────
if showABC and impulseFound and (newHigh or newLow)
    sz = array.size(pivotBars)
    if sz >= 9
        pa = array.get(pivotPrice, sz - 3)
        pb = array.get(pivotPrice, sz - 2)
        pc = array.get(pivotPrice, sz - 1)
        ba = array.get(pivotBars,  sz - 3)
        bb = array.get(pivotBars,  sz - 2)
        bc = array.get(pivotBars,  sz - 1)

        if isABC(pa, pb, pc, impulseUp)
            ccol = color.new(color.fuchsia, 0)
            makeLabel("A", ba, pa, ccol)
            makeLabel("B", bb, pb, ccol)
            makeLabel("C", bc, pc, ccol)
            if na(lastABCBar) or bar_index > lastABCBar
                lastABCBar := bar_index
                alert("Elliott correction (A–B–C) detected", alert.freq_once_per_bar_close)

// ── Housekeeping ──────────────────────────────────────────────────────────────
trimOldDrawings() =>
    for i = array.size(lineArr) - 1 to 0
        ln = array.get(lineArr, i)
        x1 = line.get_x1(ln)
        if bar_index - x1 > maxBack
            line.delete(ln)
            array.remove(lineArr, i)
    for i = array.size(labelArr) - 1 to 0
        lb = array.get(labelArr, i)
        xb = label.get_x(lb)
        if bar_index - xb > maxBack
            label.delete(lb)
            array.remove(labelArr, i)

if barstate.islast
    trimOldDrawings()

// ── Visual hints ──────────────────────────────────────────────────────────────
plotshape(newHigh, title="New Pivot High",  style=shape.triangledown, color=colorDn, location=location.abovebar, size=size.tiny, text="PH")
plotshape(newLow,  title="New Pivot Low",   style=shape.triangleup,   color=colorUp, location=location.belowbar, size=size.tiny, text="PL")
Indicator Insider
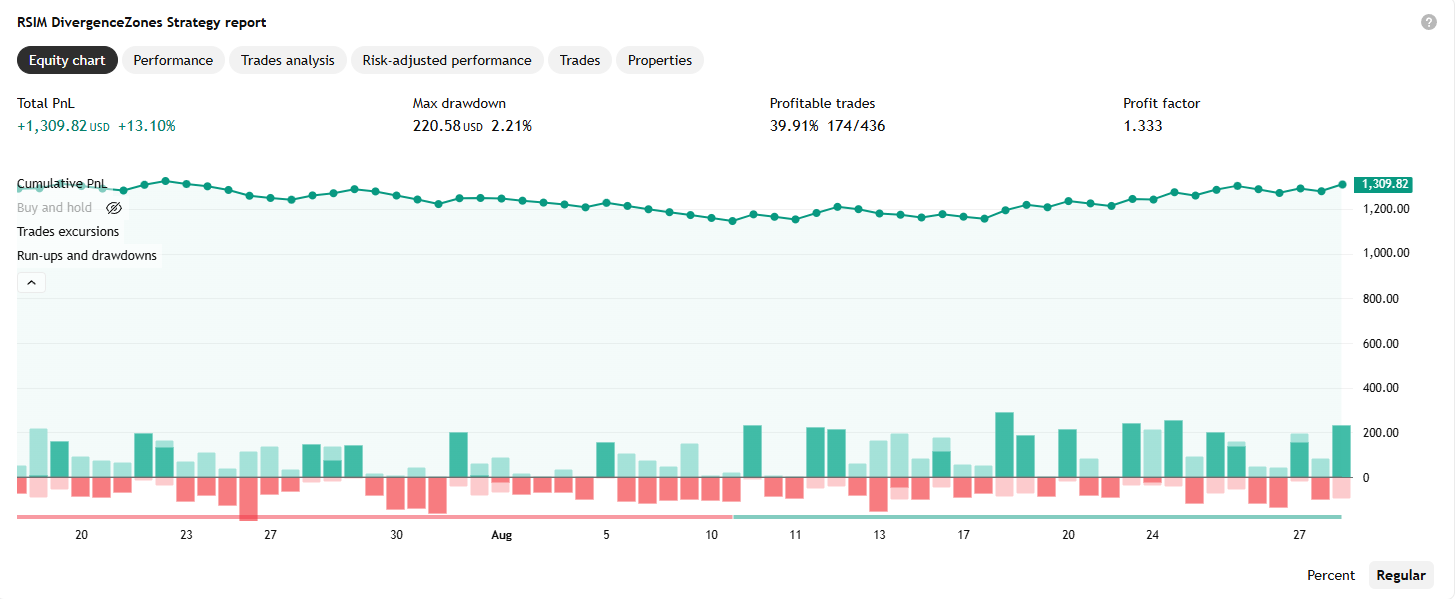
RSI Momentum Divergence Zones Indicator – Strategy
Finds divergences between price and an unusual RSI (an RSI computed on price momentum rather than on price itself), then turns every divergence into a horizontal price zone that stays alive until it is broken.
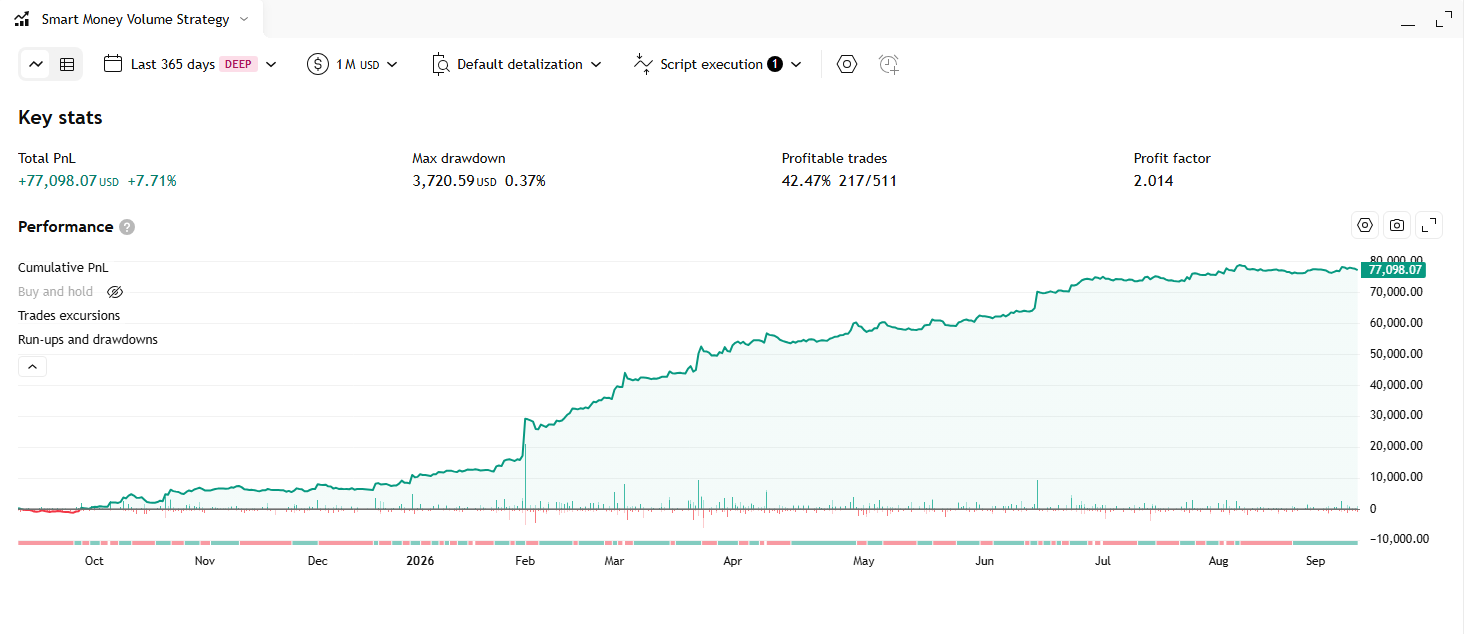
Smart Money Volume Activity Indicator – Strategy
An indicator that decomposes each chart candle into lower-timeframe volume, flags statistically abnormal volume spikes, and classifies each spike as a “Smart Money” or “Retail” footprint
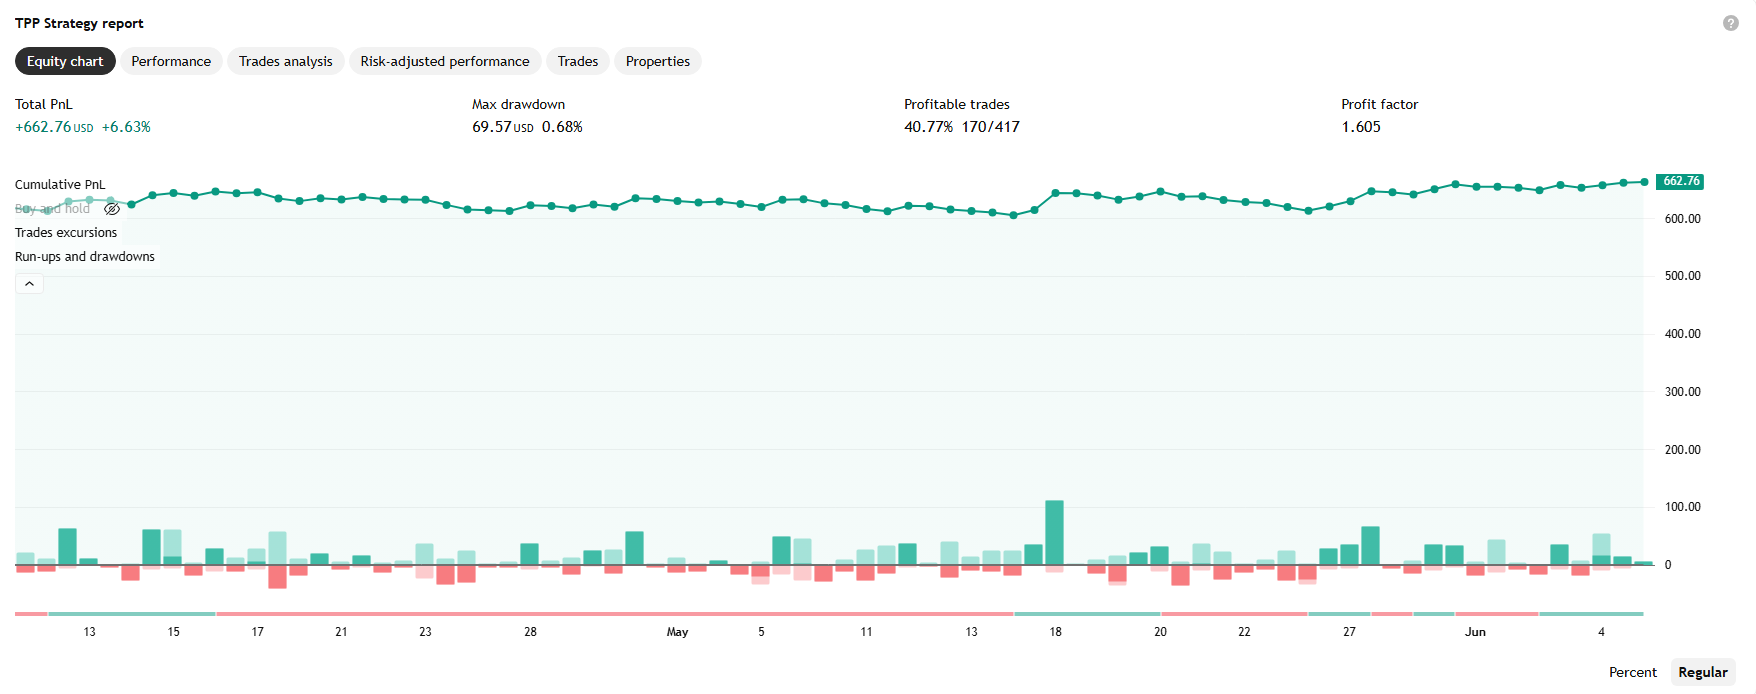
Trend Pivots Profile Indicator – Strategy
Draws a separate volume profile for each swing between two pivot reversal points, using intrabar volume pulled from a lower timeframe, plus a Donchian-channel-style trend line.