📊 FVG Quality Scorer | Flux Charts
Indicator Analysis · English Version · PineScript v6
1.1 Core Concept
The FVG Quality Scorer evaluates every Fair Value Gap (FVG / imbalance zone) across four independent scoring axes, each worth a maximum of 25 points, producing a weighted composite score of 0–100 and an A/B/C/D grade. Rather than treating all FVGs equally, the indicator surfaces only the highest-quality setups by filtering out low-grade zones from the chart.
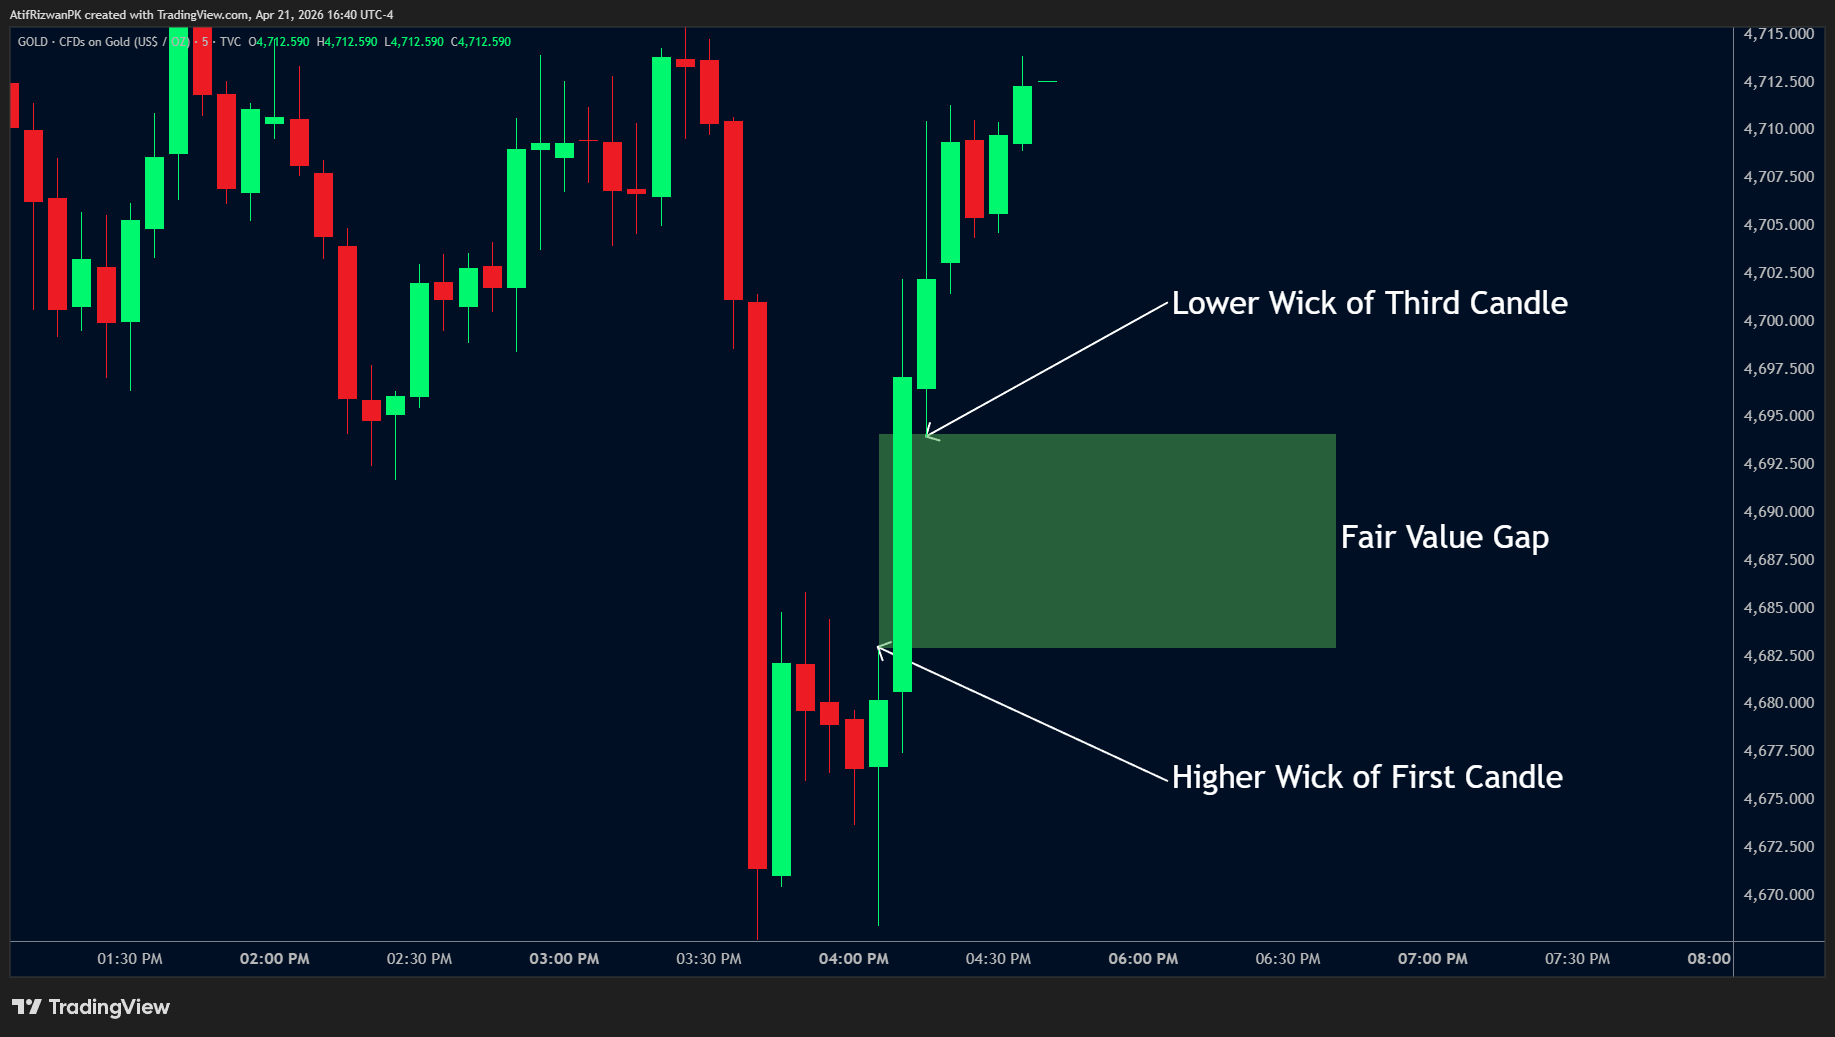
A bullish FVG forms when low > high[2] (gap between the current bar's low and the candle two bars back's high). A bearish FVG forms when high < low[2]. These are standard three-bar imbalance zones.
1.2 Key Features
- 📐 4-Axis scoring — Displacement · Volume Delta · Contextual · Structural, each 0–25 pts
- 🏆 A/B/C/D grading — configurable per-axis minimums and required-axis gates per grade
- ⚖️ Weighted composite — user-defined axis weights, sum-normalized to 100
- 📊 LTF volume delta — intrabar bull/bear volume ratio via request.security_lower_tf
- 🕰️ HTF FVG nesting — checks whether current FVG sits inside a higher-timeframe FVG for confluence
- 🎯 Killzone awareness — bonus points for FVGs formed during Asian/London/NY sessions
- 📈 BOS / CHoCH tracking — rewards FVGs aligned with a recent break of structure
- 🔄 State machine — Fresh → Tested / PartiallyFilled → Mitigated, with optional historic display
- 🖼️ Deferred drawing — all boxes and labels redrawn only at barstate.islast for performance
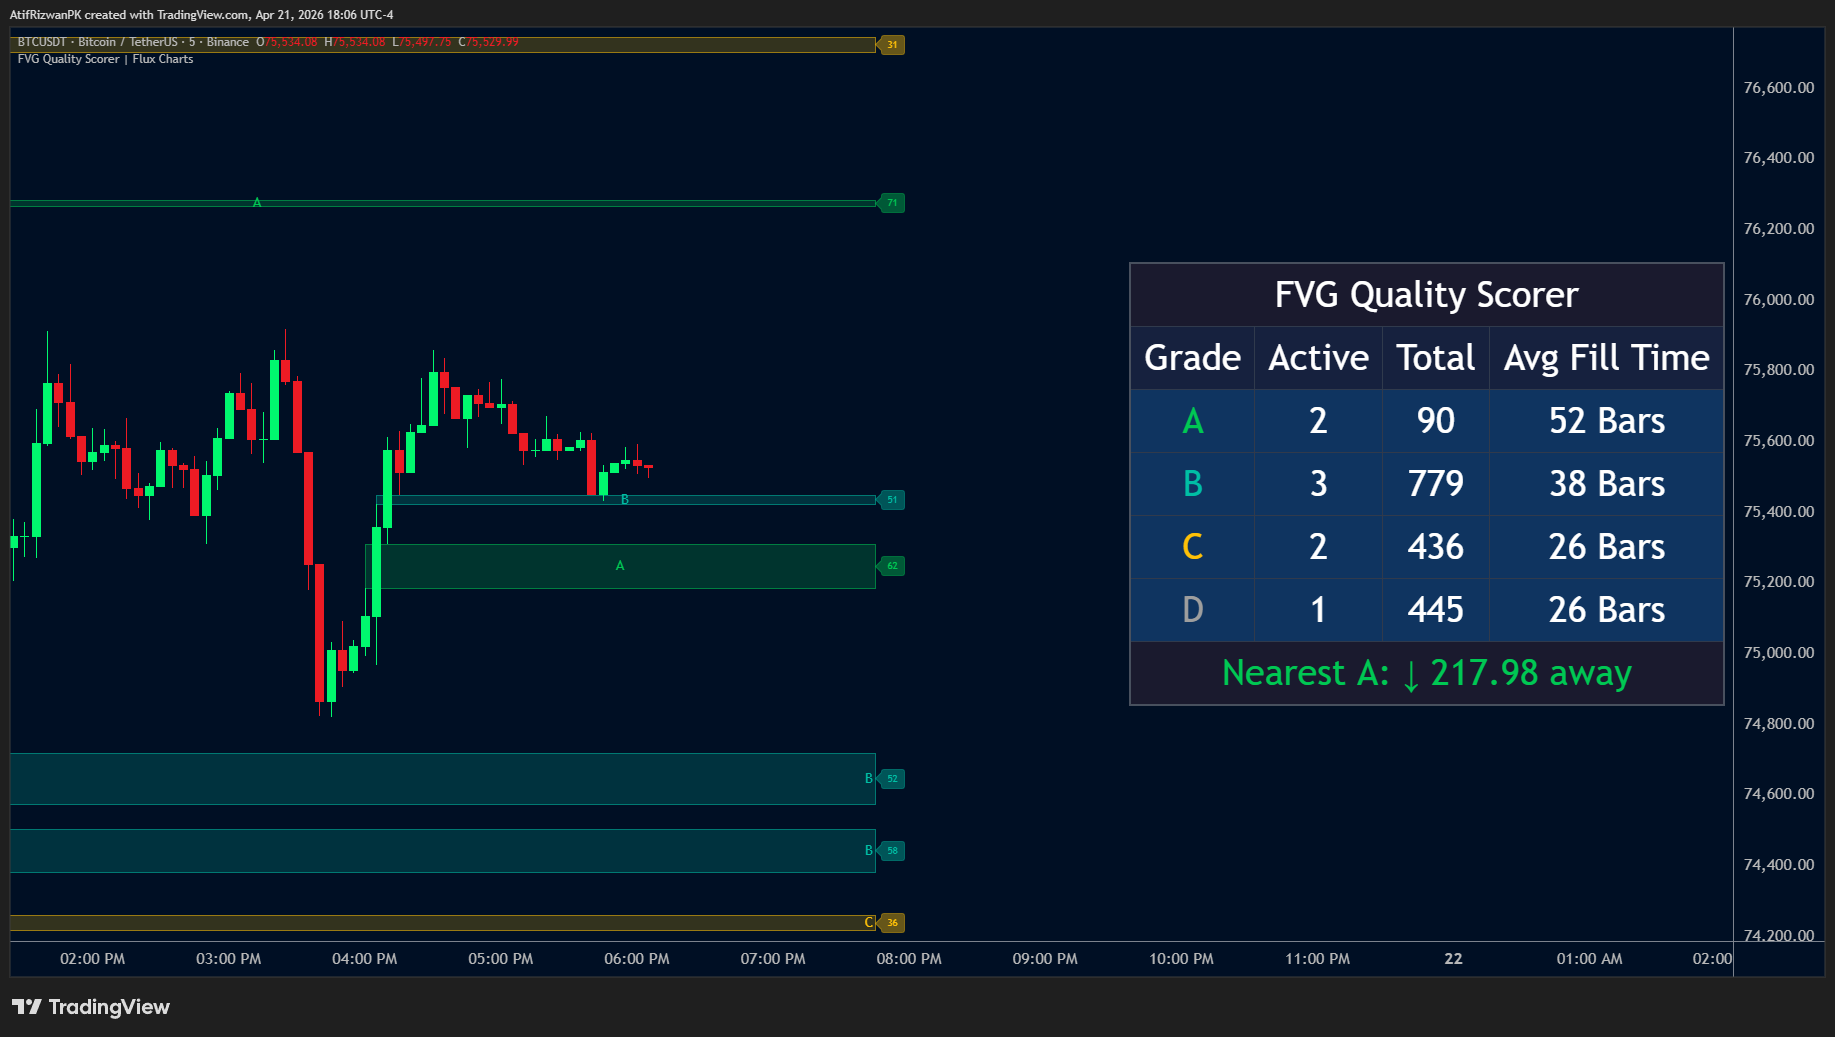
- 📋 Dashboard — per-grade active/total counts, average fill time, nearest A-grade distance
- 🚨 Alerts — new A-grade and new B-grade FVG detection
1.3 How to Use
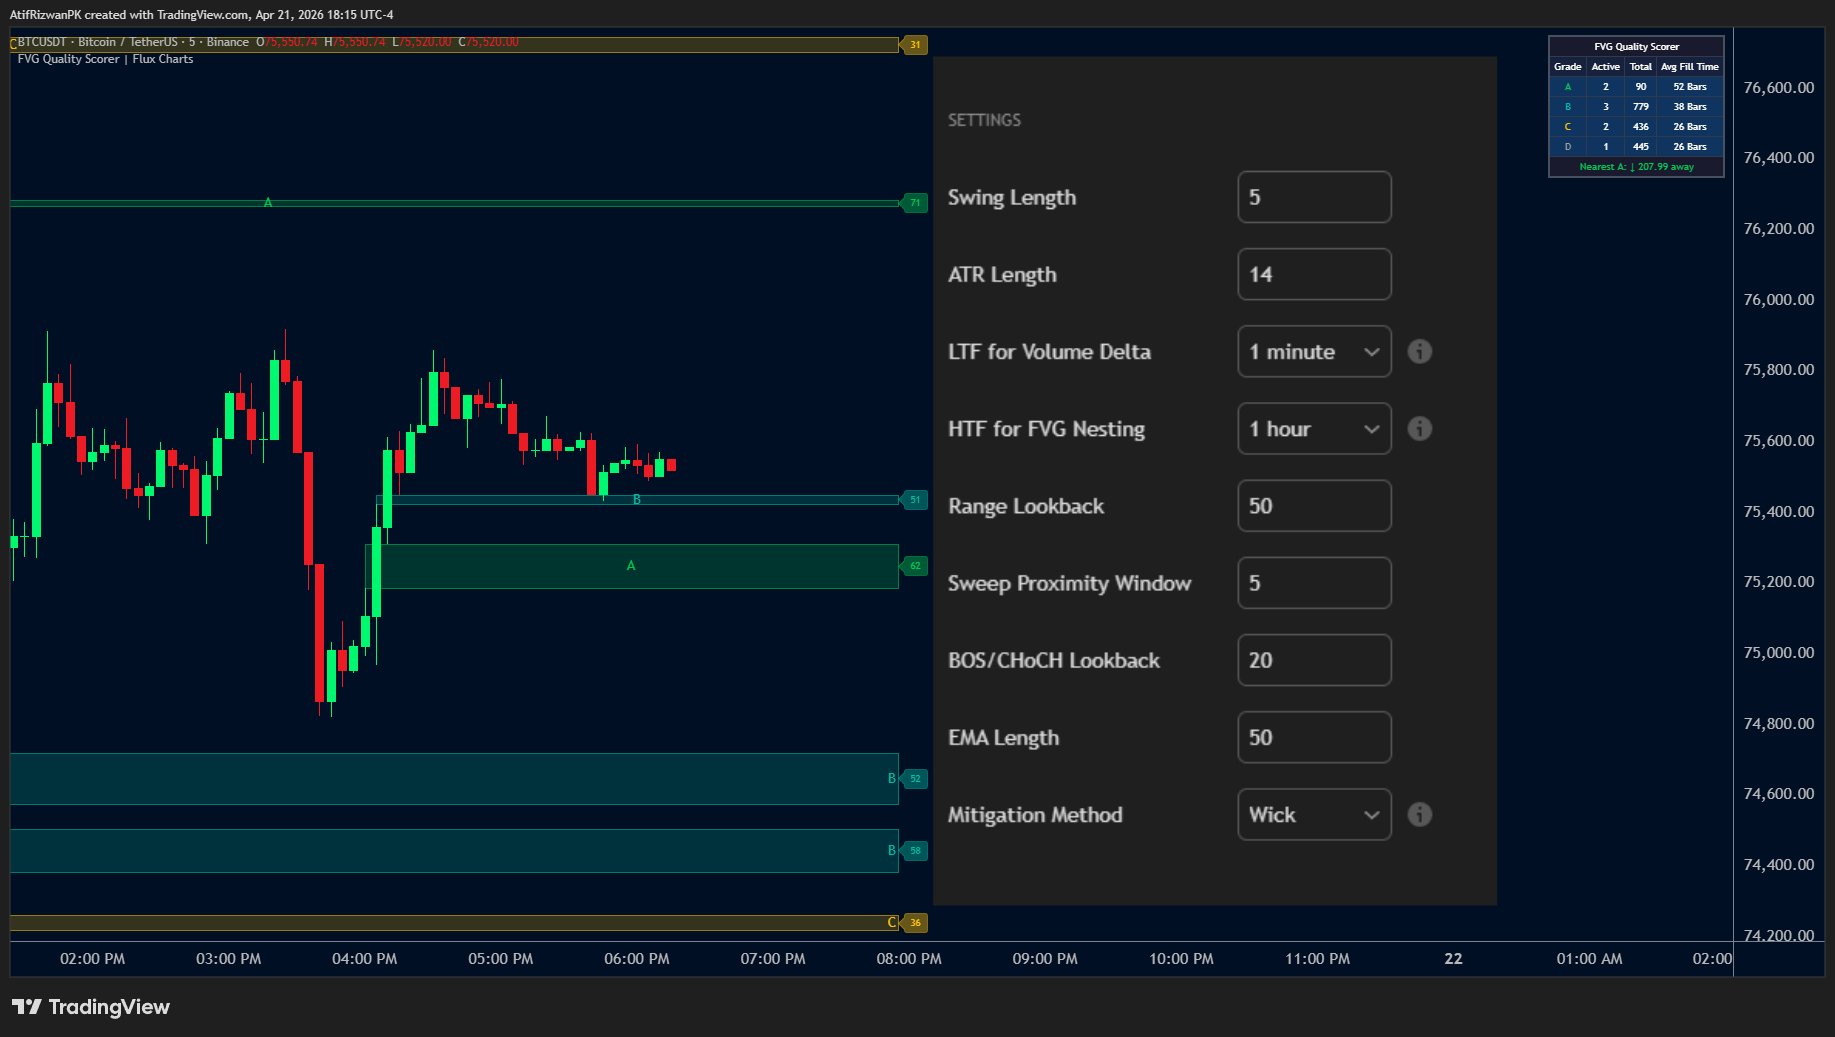
⚙️ Input Parameters| Parameter | Default | Description |
|---|---|---|
| swingLen | 5 | Bars each side to confirm a swing high/low for market structure |
| atrLen | 14 | ATR period for displacement scoring |
| ltfTf | "1" | Lower timeframe for intrabar volume delta (e.g. "1" = 1-minute) |
| htfTf | "60" | Higher timeframe to check for FVG nesting confluence |
| rangeLb | 50 | Lookback bars for premium/discount range calculation |
| sweepWin | 5 | Window in bars to look back for a liquidity sweep event |
| bosLb | 20 | Max bars since last BOS/CHoCH to award structural bonus points |
| emaLen | 50 | EMA period for trend alignment check |
| dispW / volW / ctxW / strW | 25 each | Relative weights for each axis (normalized to 100 total) |
| minGrade | "C" | Hide FVGs below this grade from the chart |
| mitMethod | "Wick" | Wick: mitigated when wick crosses zone; Close: when close crosses |
| showHist | false | Show mitigated FVGs as gray boxes (historical mode) |
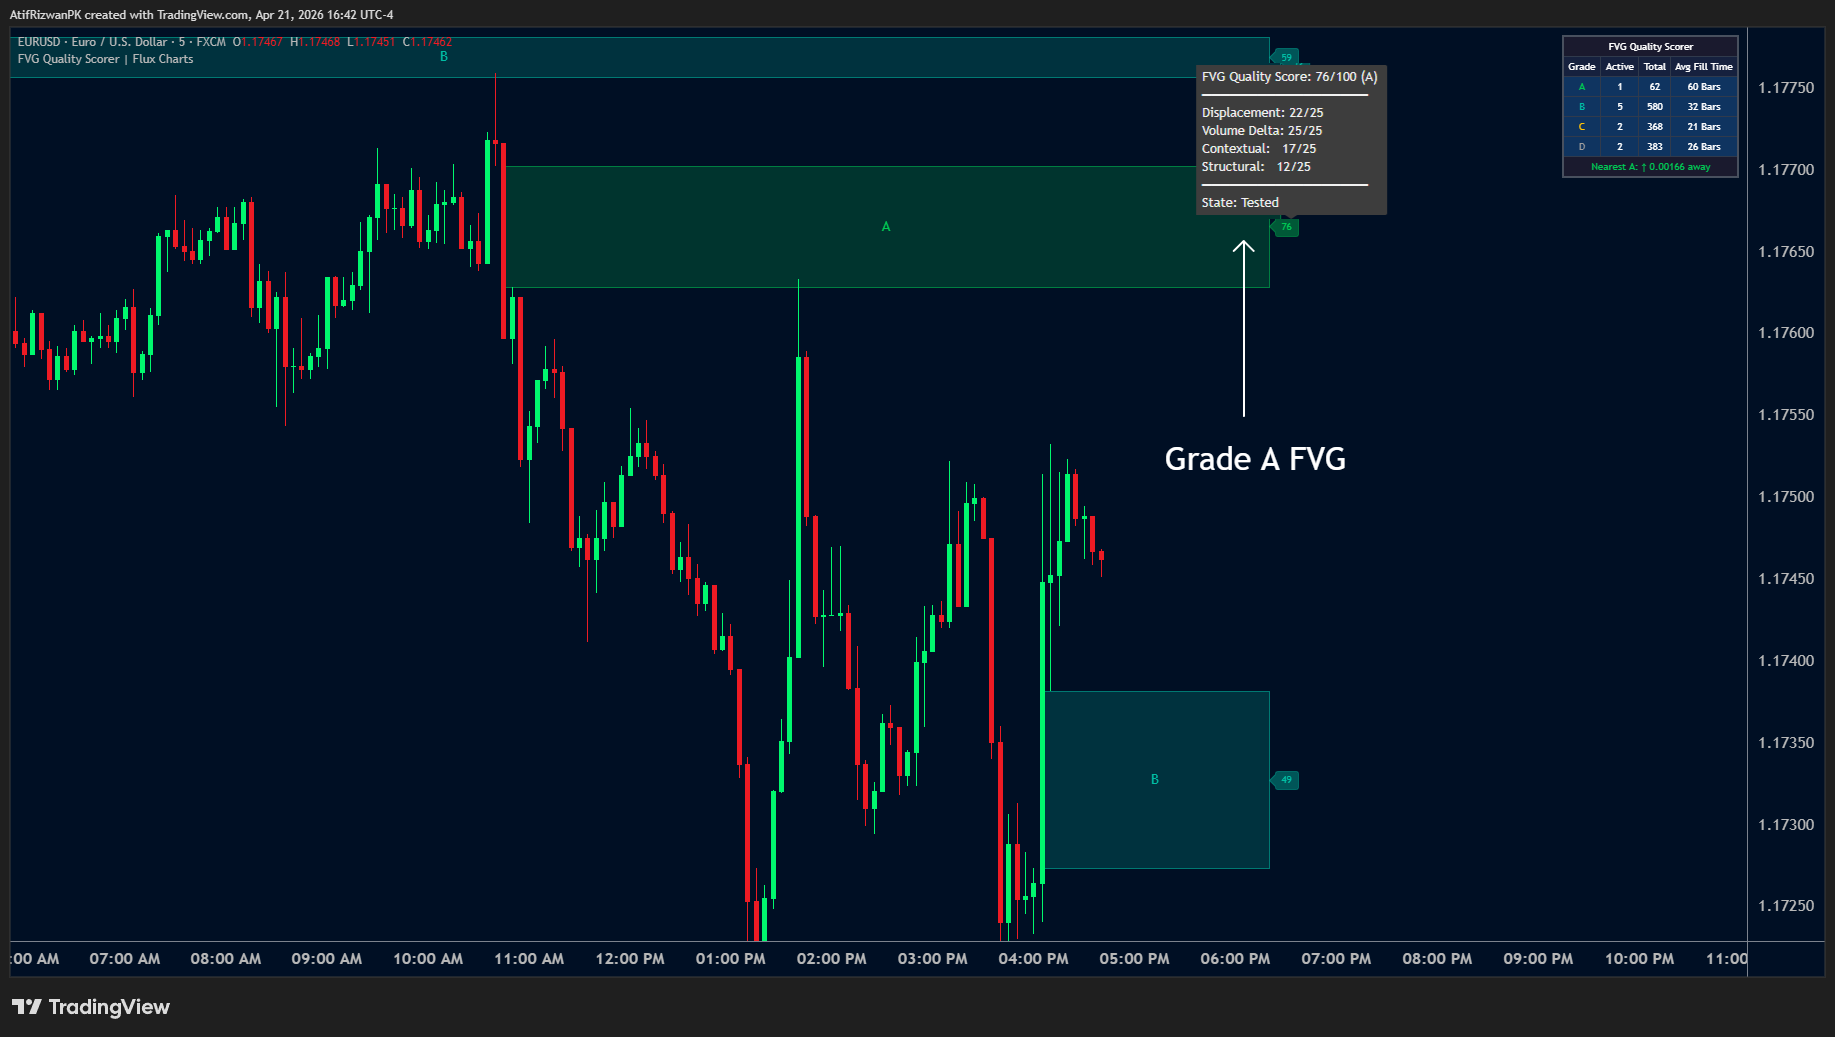
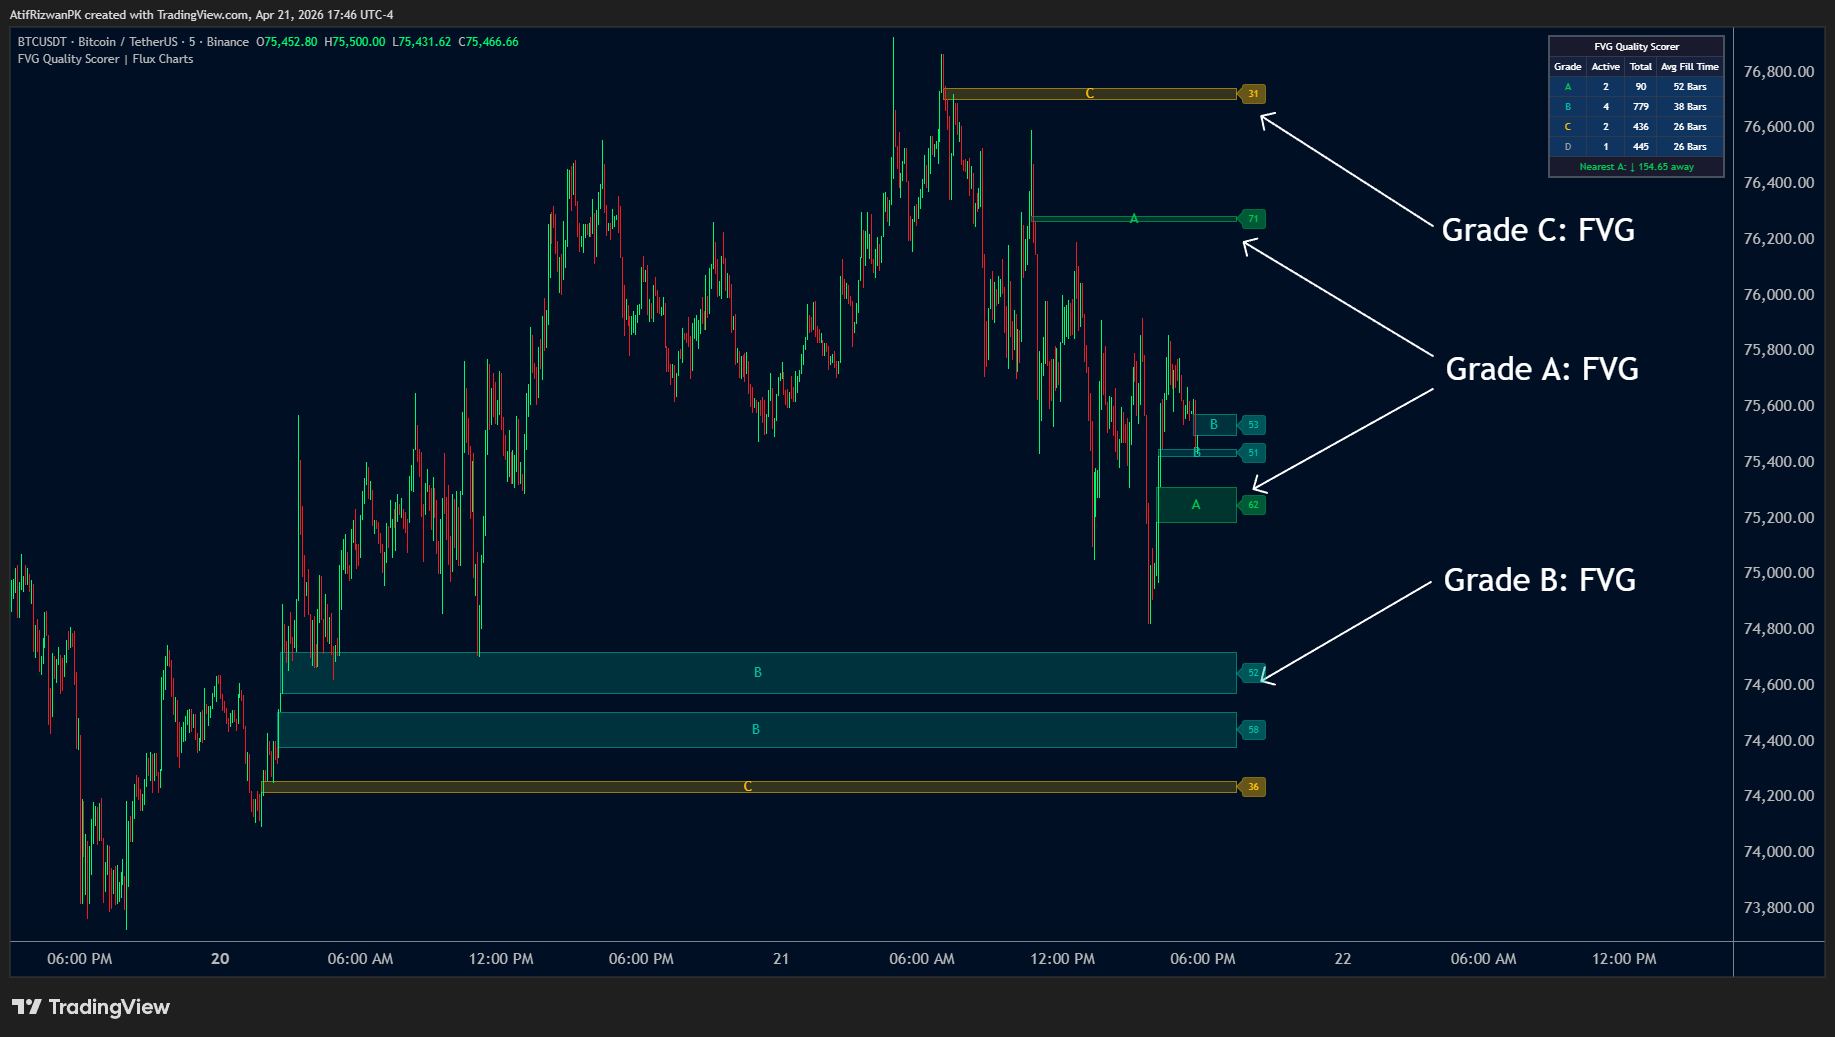
- Grade A box (green) — highest-quality FVG, all four axes strong, treat as primary setup zone
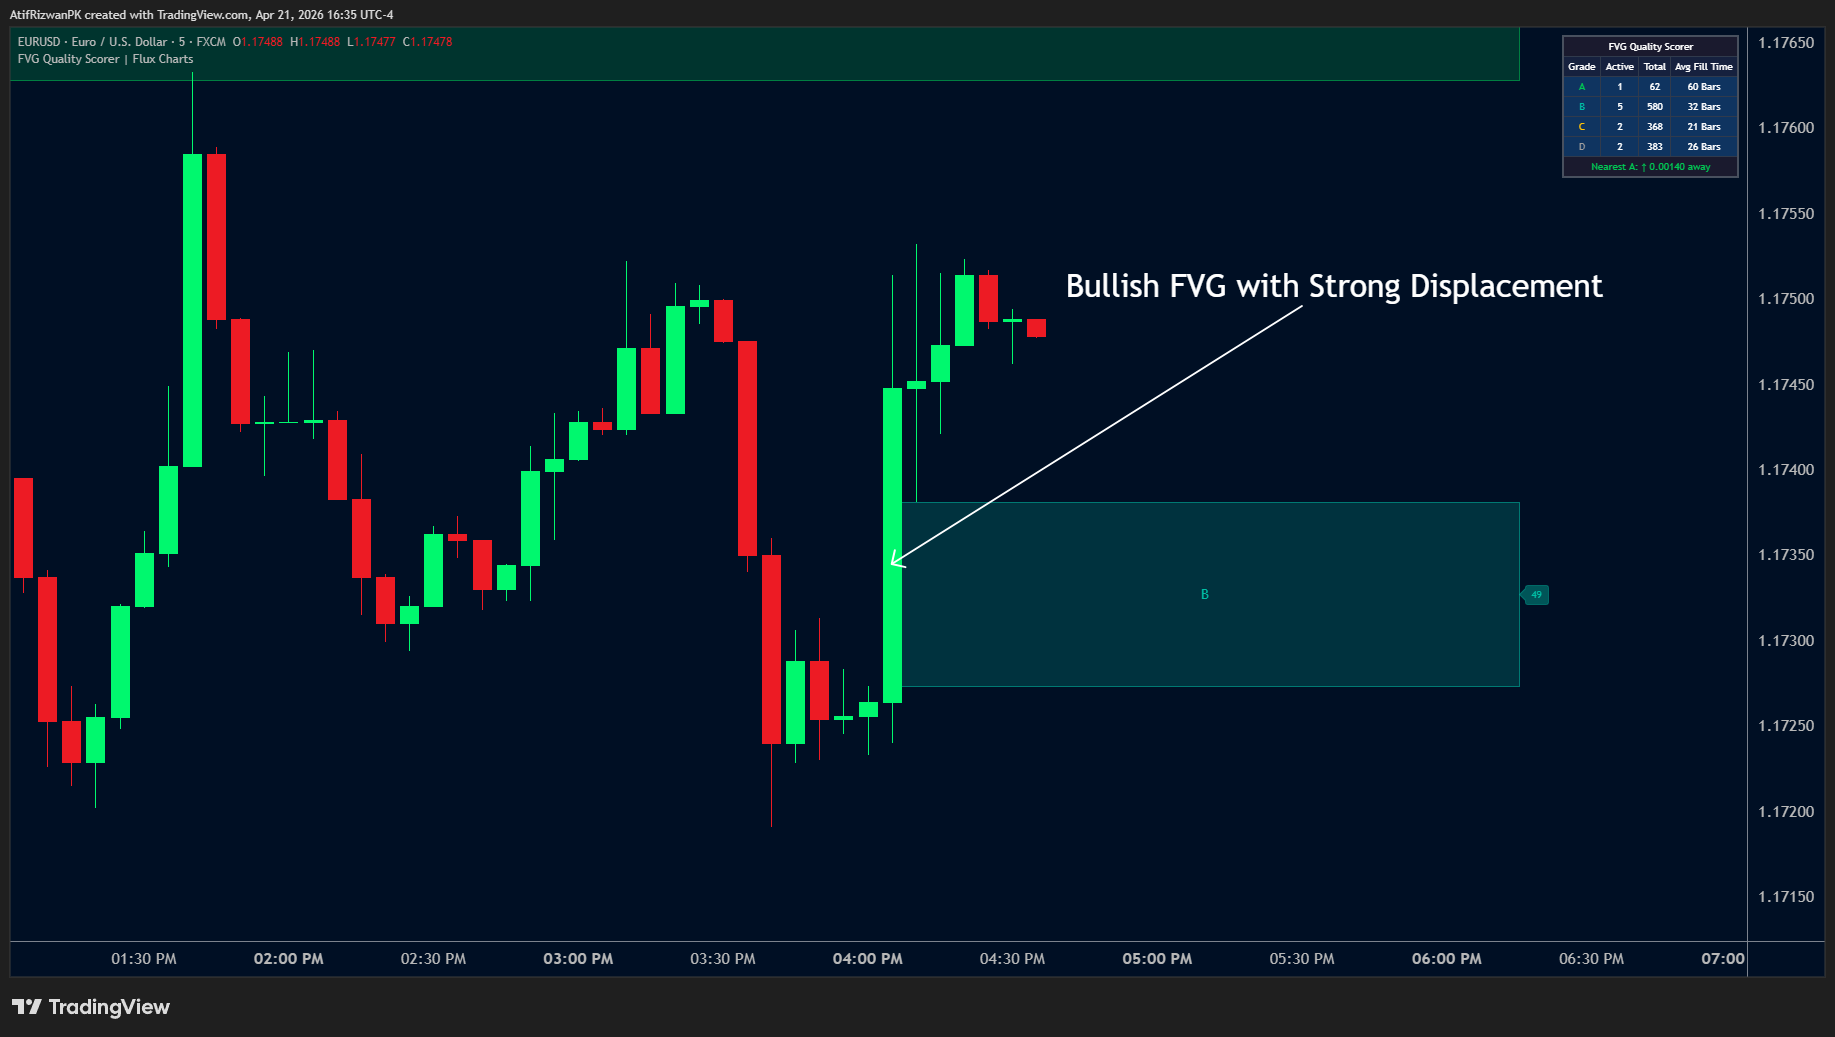
- Grade B box (teal) — solid setup, good displacement + volume, minor structural/contextual gap
- Grade C box (amber) — moderate quality, use with additional confirmation
- Grade D box (gray) — low quality, avoid or ignore unless grade filter hides them
- Score label — numeric 0–100 composite score shown at right edge of each box
- Faded box — PartiallyFilled state (price entered zone but didn't exit the other side)
- Gray box — Mitigated (showHist must be on to see)
- Set minGrade = "B" for high-conviction setups only — reduces chart clutter significantly
- Enable alerts for "New A-Grade FVG" to catch top-tier setups in real time
- Use dashboard "Avg Fill Time" per grade to calibrate hold periods: A-grade FVGs typically survive longer
- Combine with HTF bias: A-grade FVGs nested inside HTF FVGs receive the full 8-pt HTF bonus
- On lower timeframes, reduce ltfTf accordingly (e.g. use "1" on 5-minute charts)
1.4 How It Works (Output → Input)
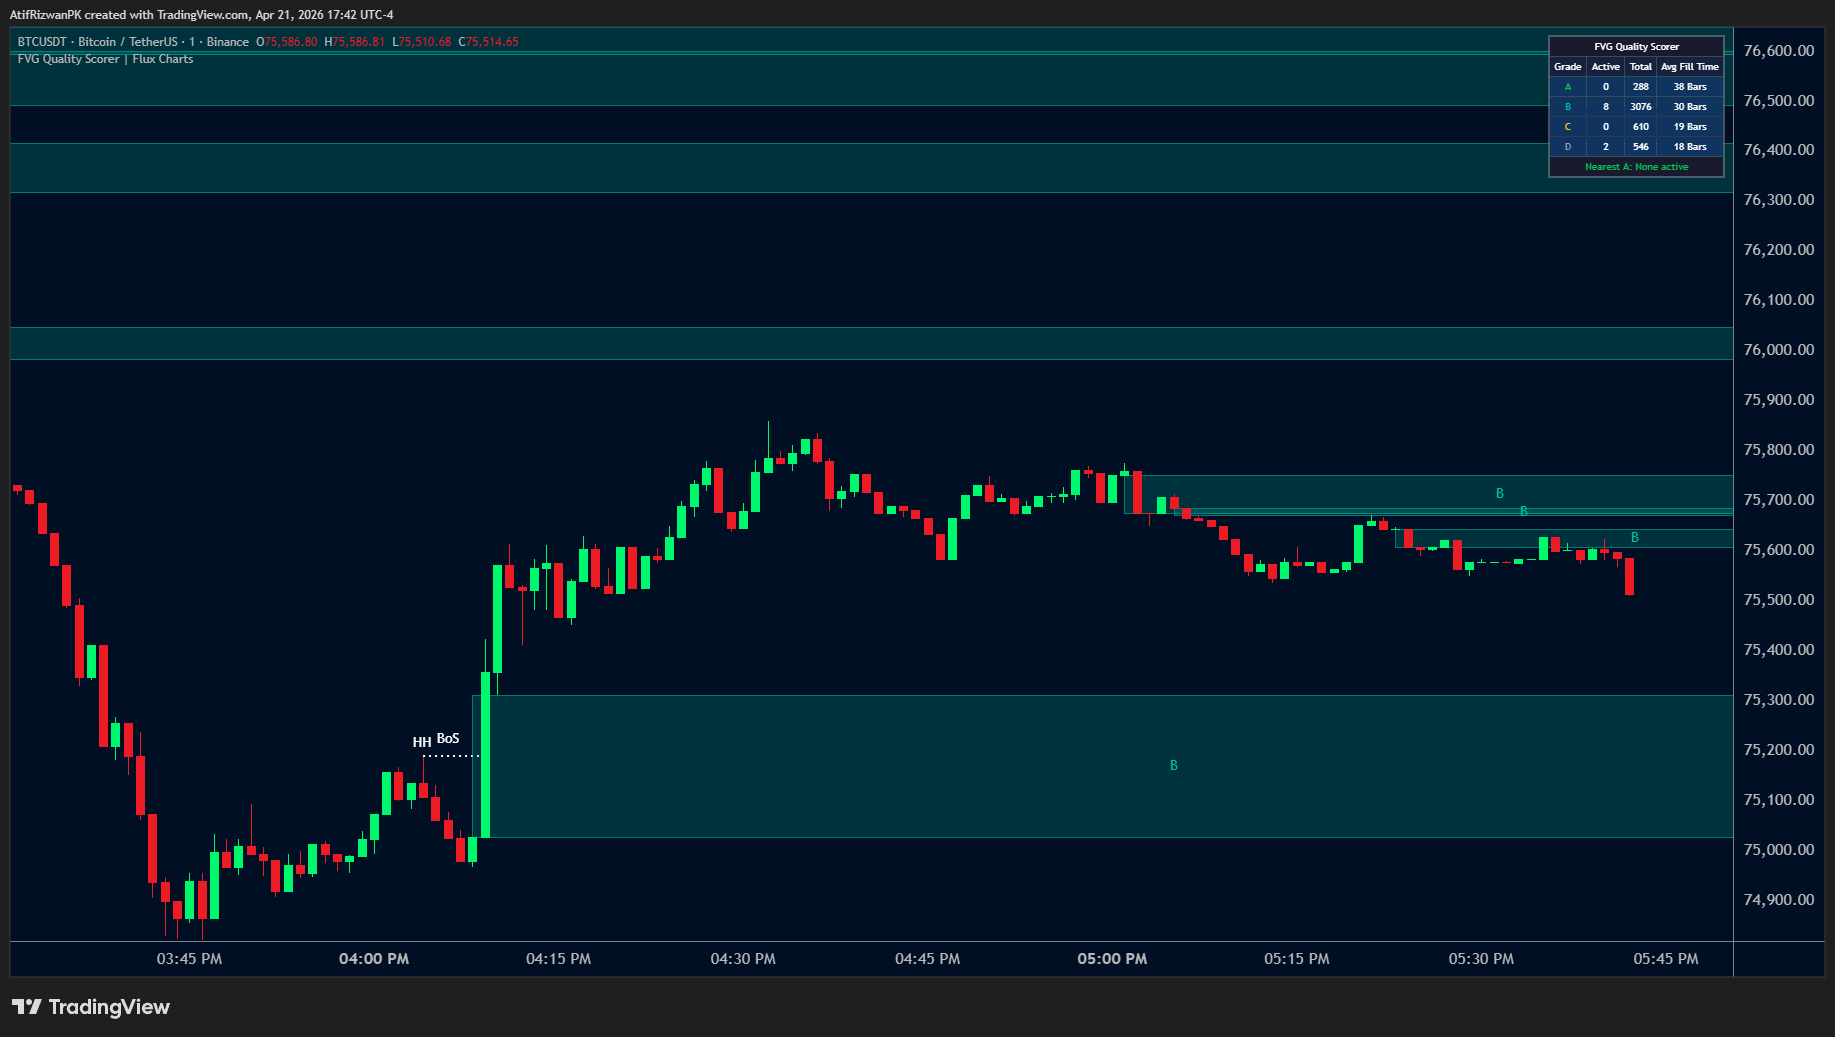
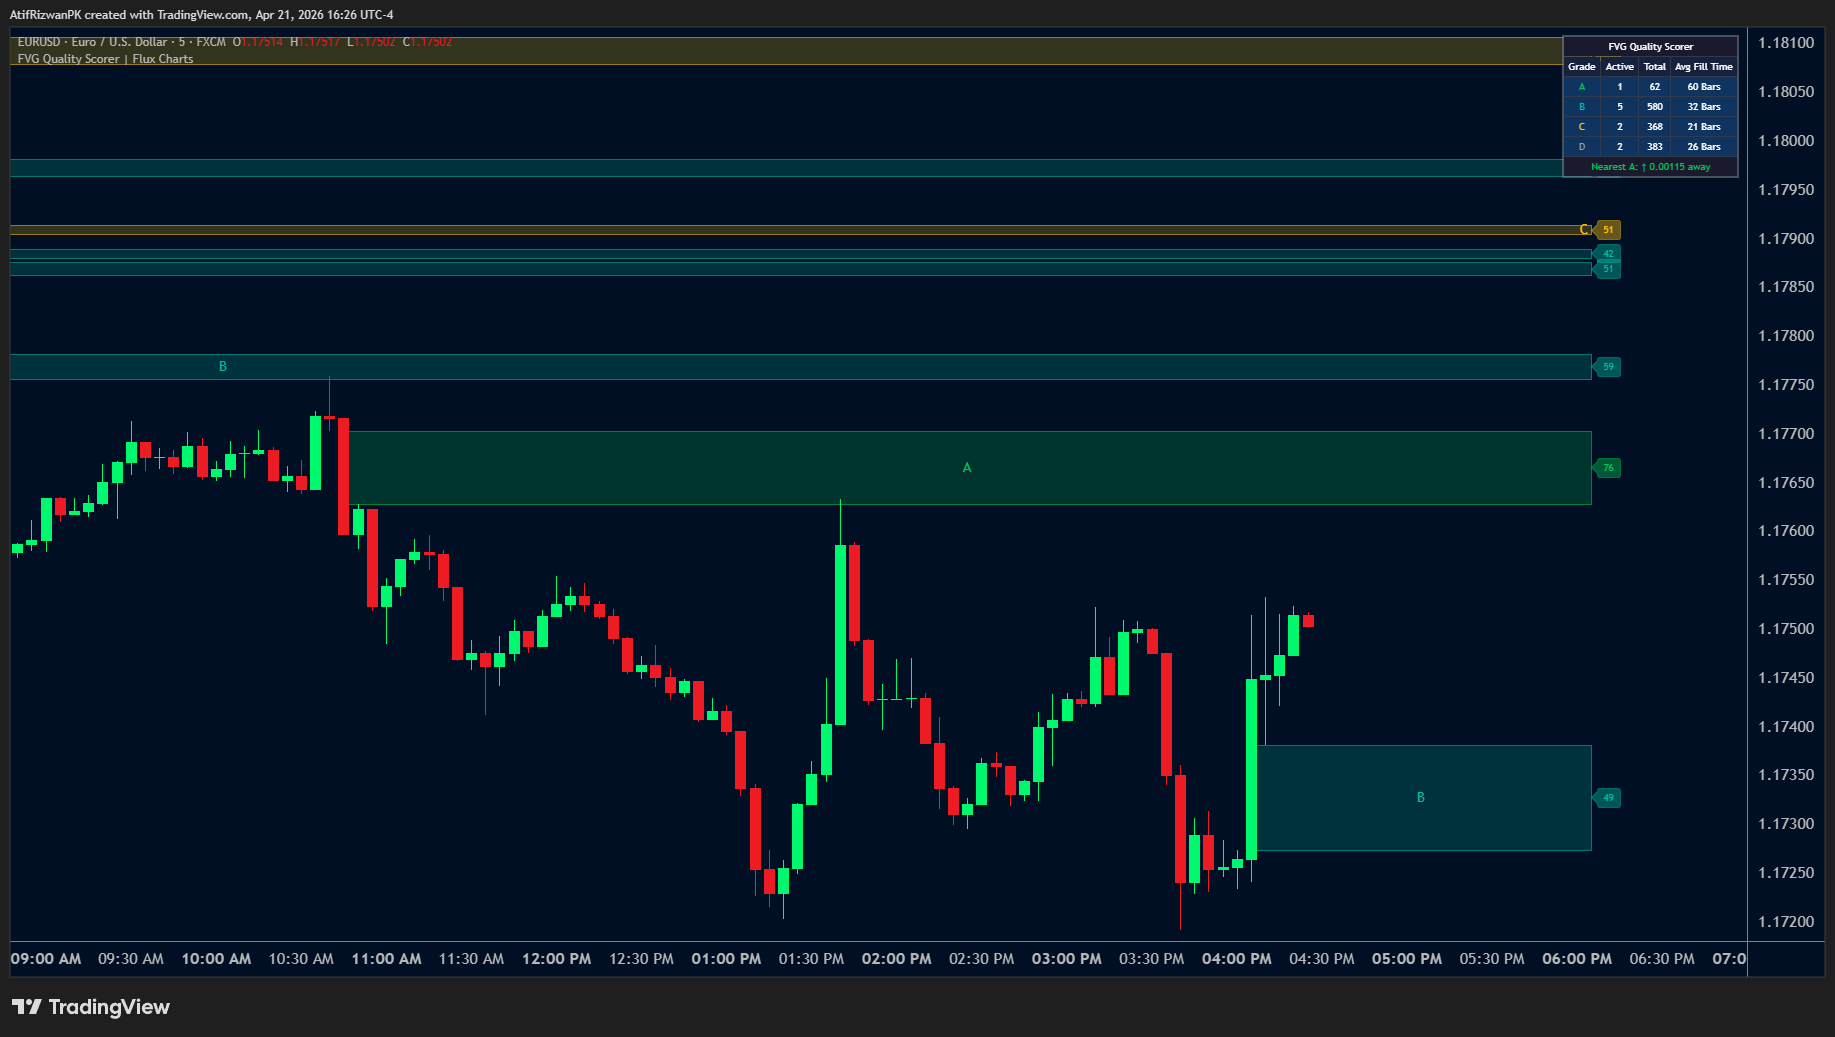
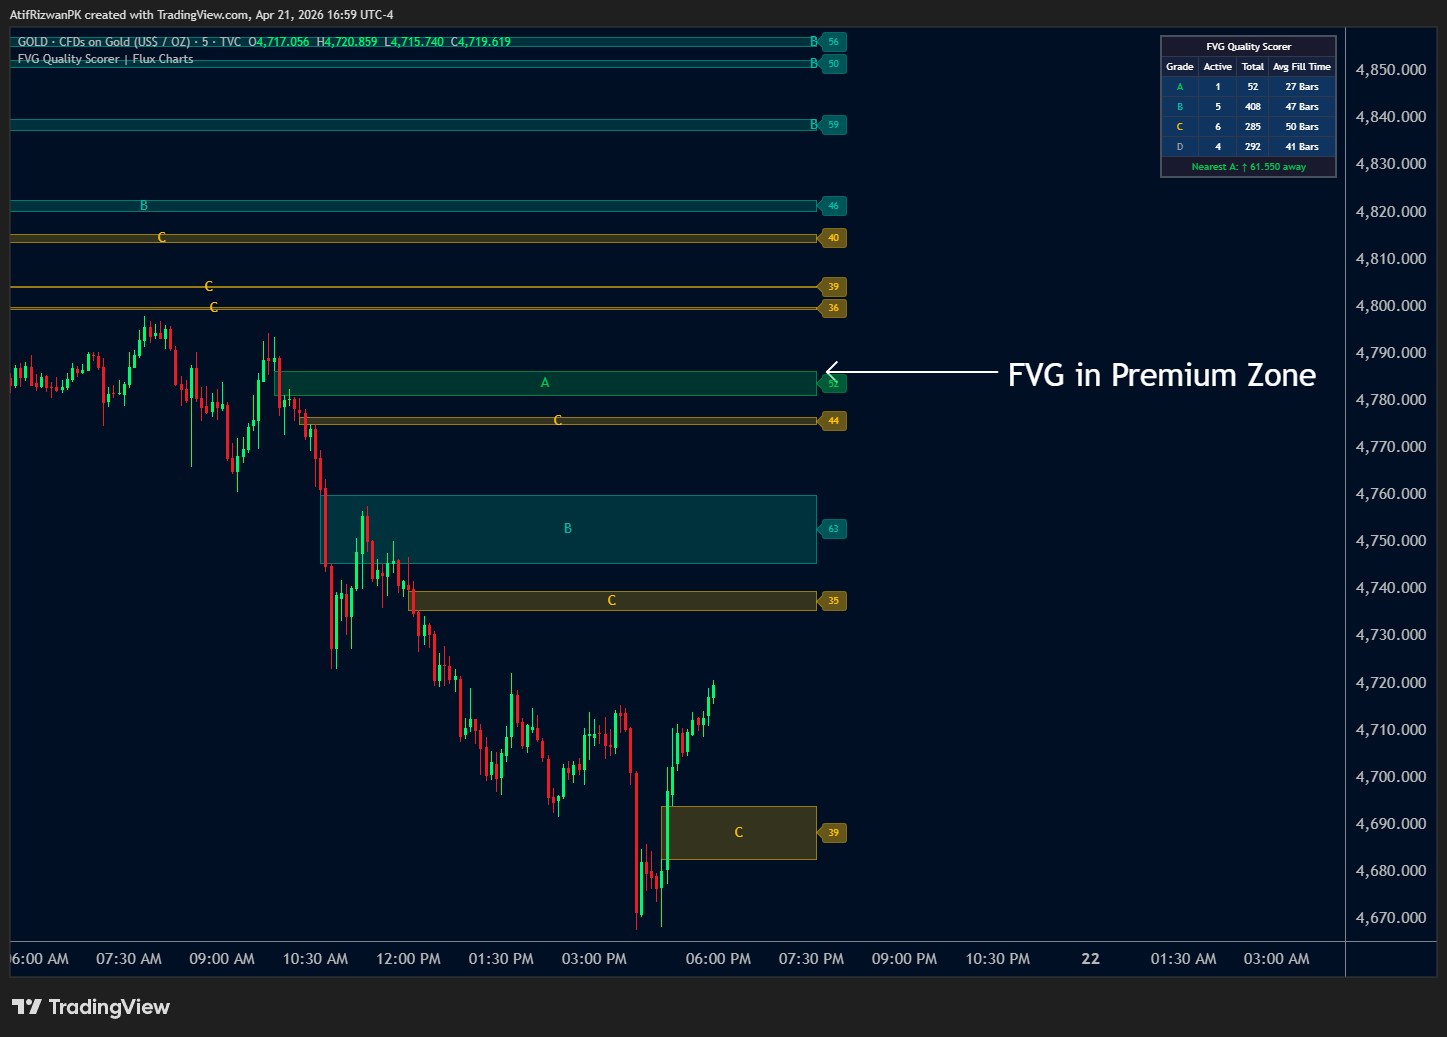
🖥️ Output — What Appears on Chart- Colored boxes (A=green / B=teal / C=amber / D=gray) spanning the FVG price zone
- Grade letter centered inside each box
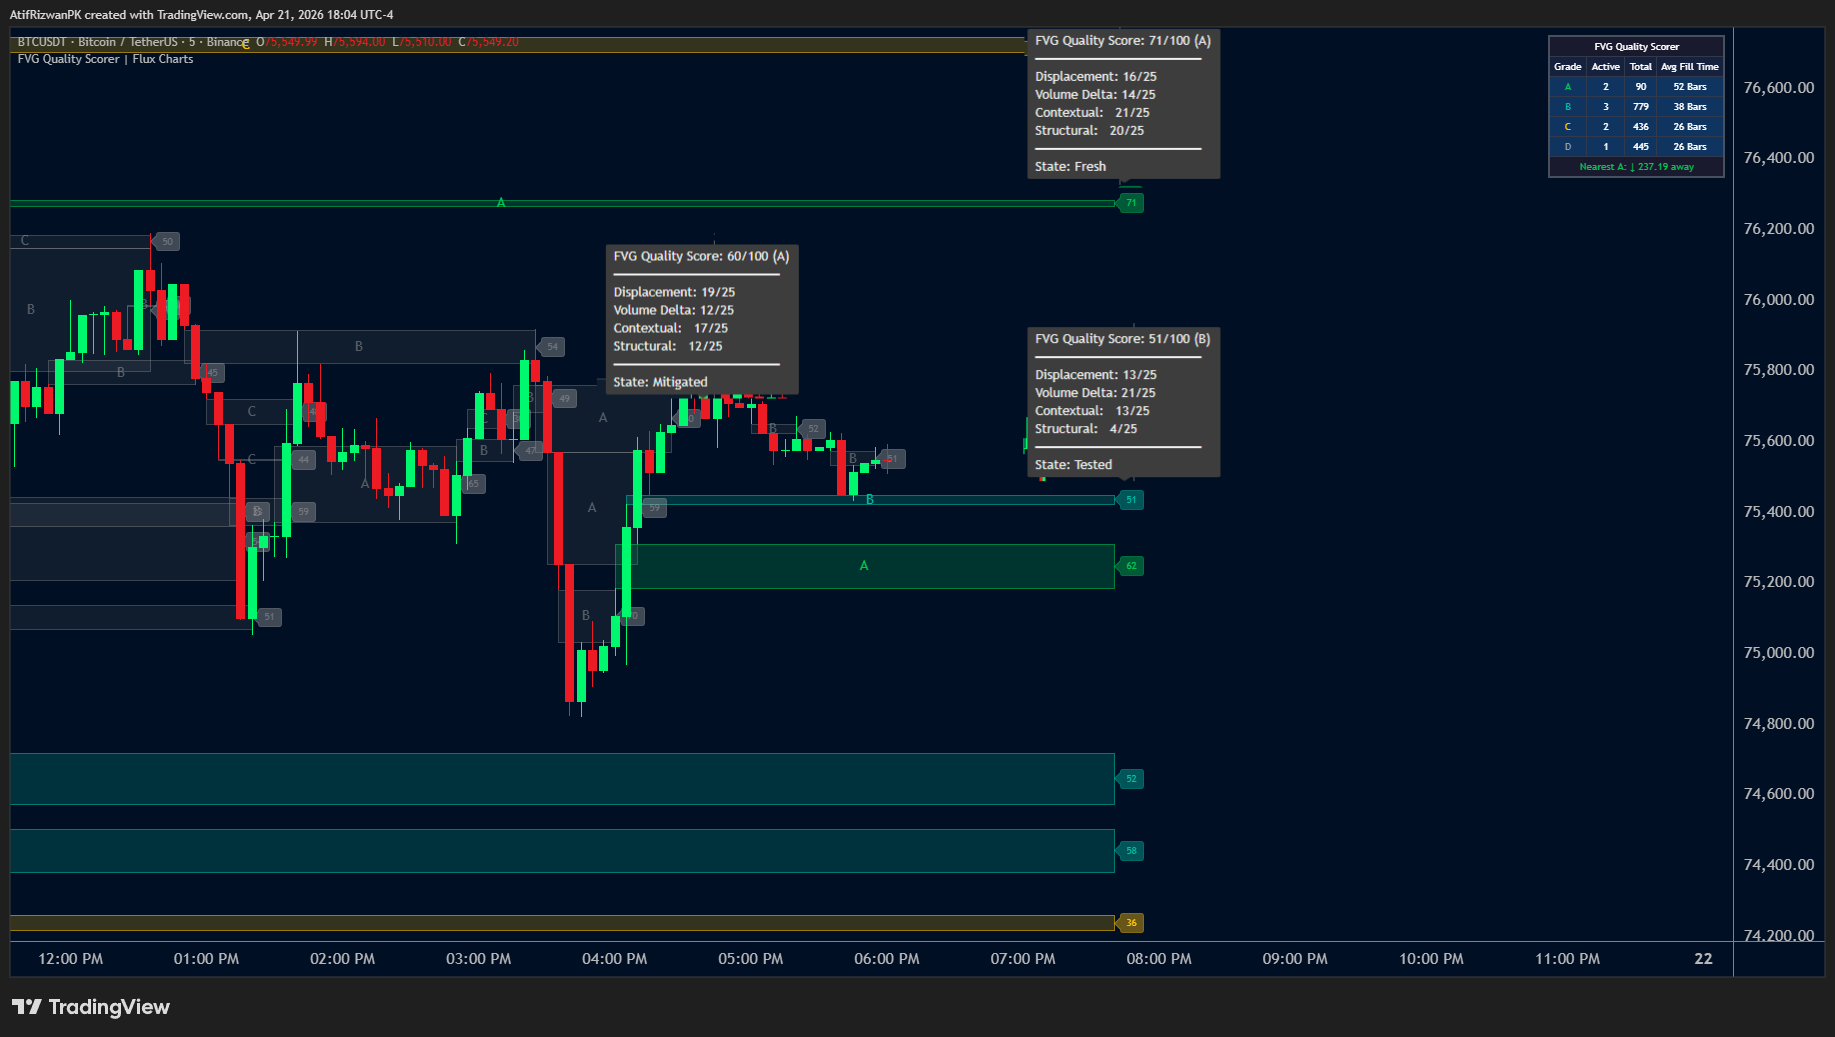
- Score label (0–100) at the right edge with hover tooltip showing per-axis breakdown
- Dashboard panel: per-grade active/total/avg-fill-time + nearest A-grade distance
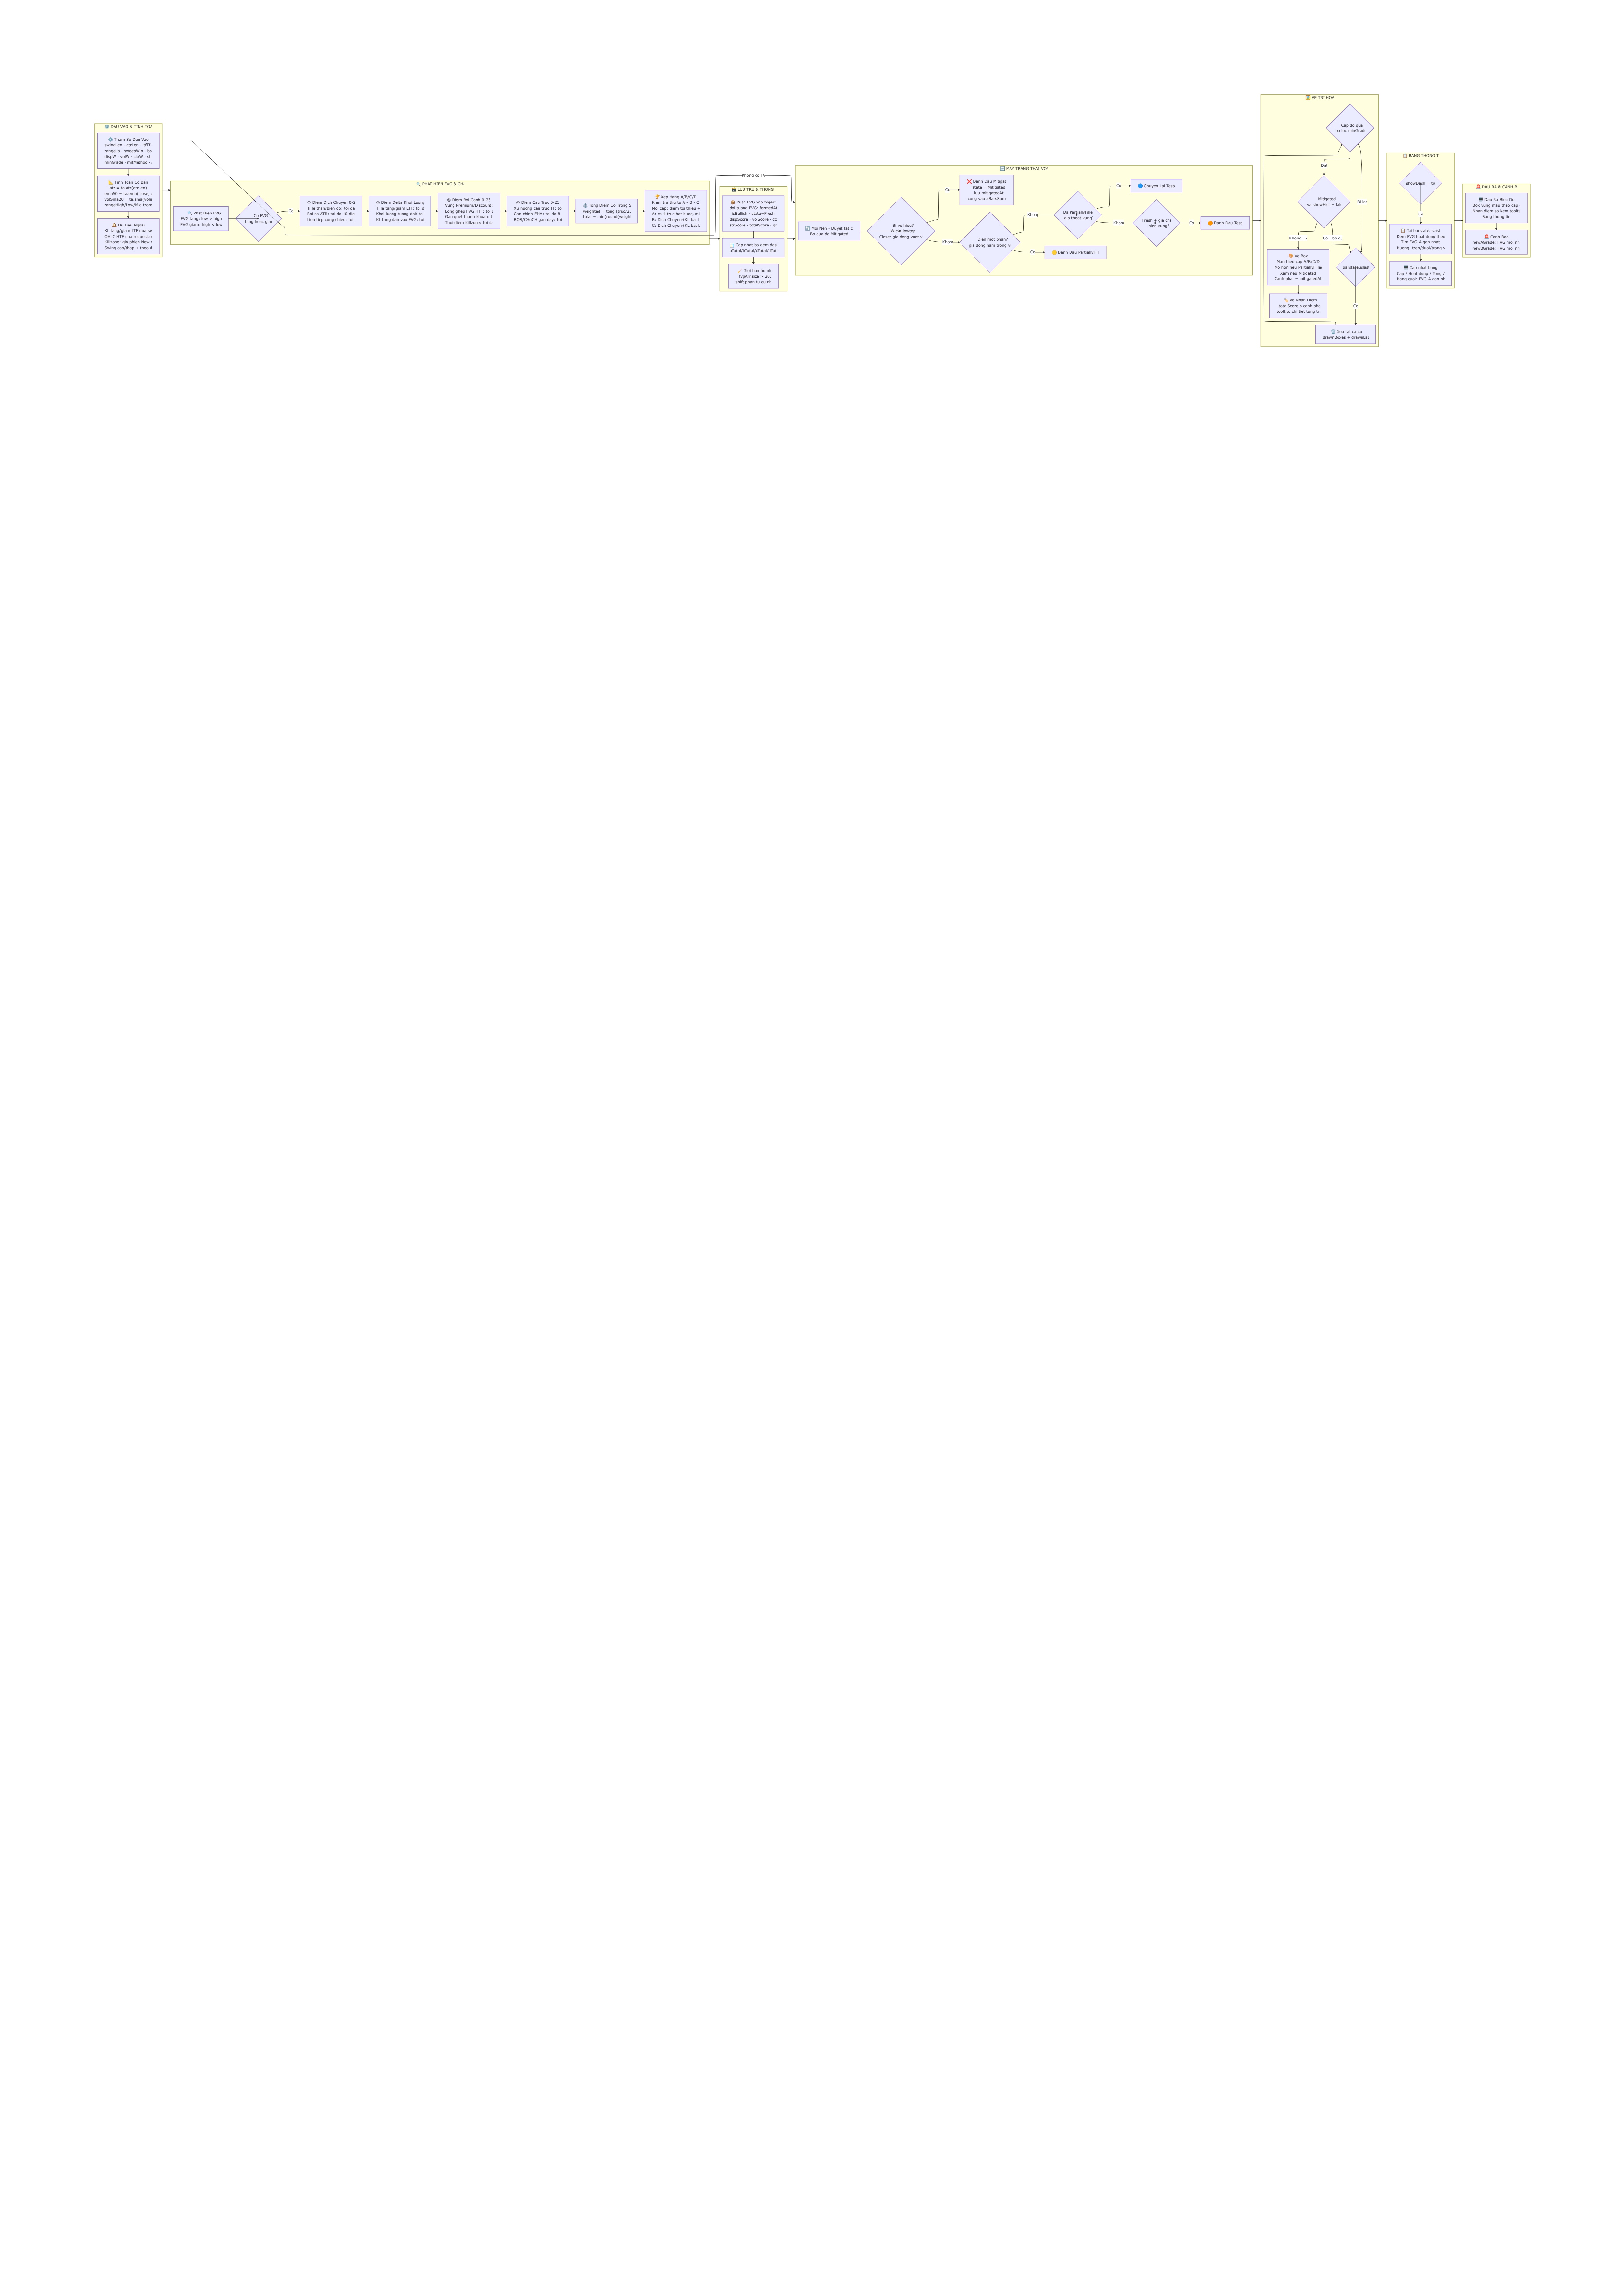
All visual objects are redrawn from scratch on every barstate.islast tick: previous boxes/labels are deleted, then the full fvgArr is iterated. FVGs below minGrade are skipped; mitigated FVGs are skipped unless showHist = true. Box color fades for PartiallyFilled state and turns fully gray for Mitigated state.
🔄 Tier 5 — State Machine (Lifecycle)Every bar, all non-mitigated FVGs in fvgArr are checked:
| Transition | Condition |
|---|---|
| → Mitigated | Wick method: low < fvg.bottom (bull) / high > fvg.top (bear); Close method: close crosses zone |
| → PartiallyFilled | Price enters zone but hasn't fully crossed: close < top and close > bottom |
| → Tested | Price touched zone boundary from outside: low ≤ top and low[1] ≥ top (bull) |
| PartiallyFilled → Tested | Price exits the zone without full mitigation |
New FVGs are pushed into fvgArr (array of FVG UDT objects). When the array exceeds 200 entries, the oldest entry is shifted out to prevent memory overflow. Dashboard counters (aTotal, aBarsSum, etc.) accumulate lifetime statistics and are never reset.
🏆 Tier 3 — Grading & Weighted Total
Weighted total:
weighted = (dsp/25)×dW + (vol/25)×vW + (ctx/25)×cW + (str/25)×sW
total = min(round(weighted × 100/wSum), 100)
Grade assignment — evaluated A → B → C → D in order; first passing grade wins. Each grade checks both a minimum per-axis score AND an optional "required" flag:
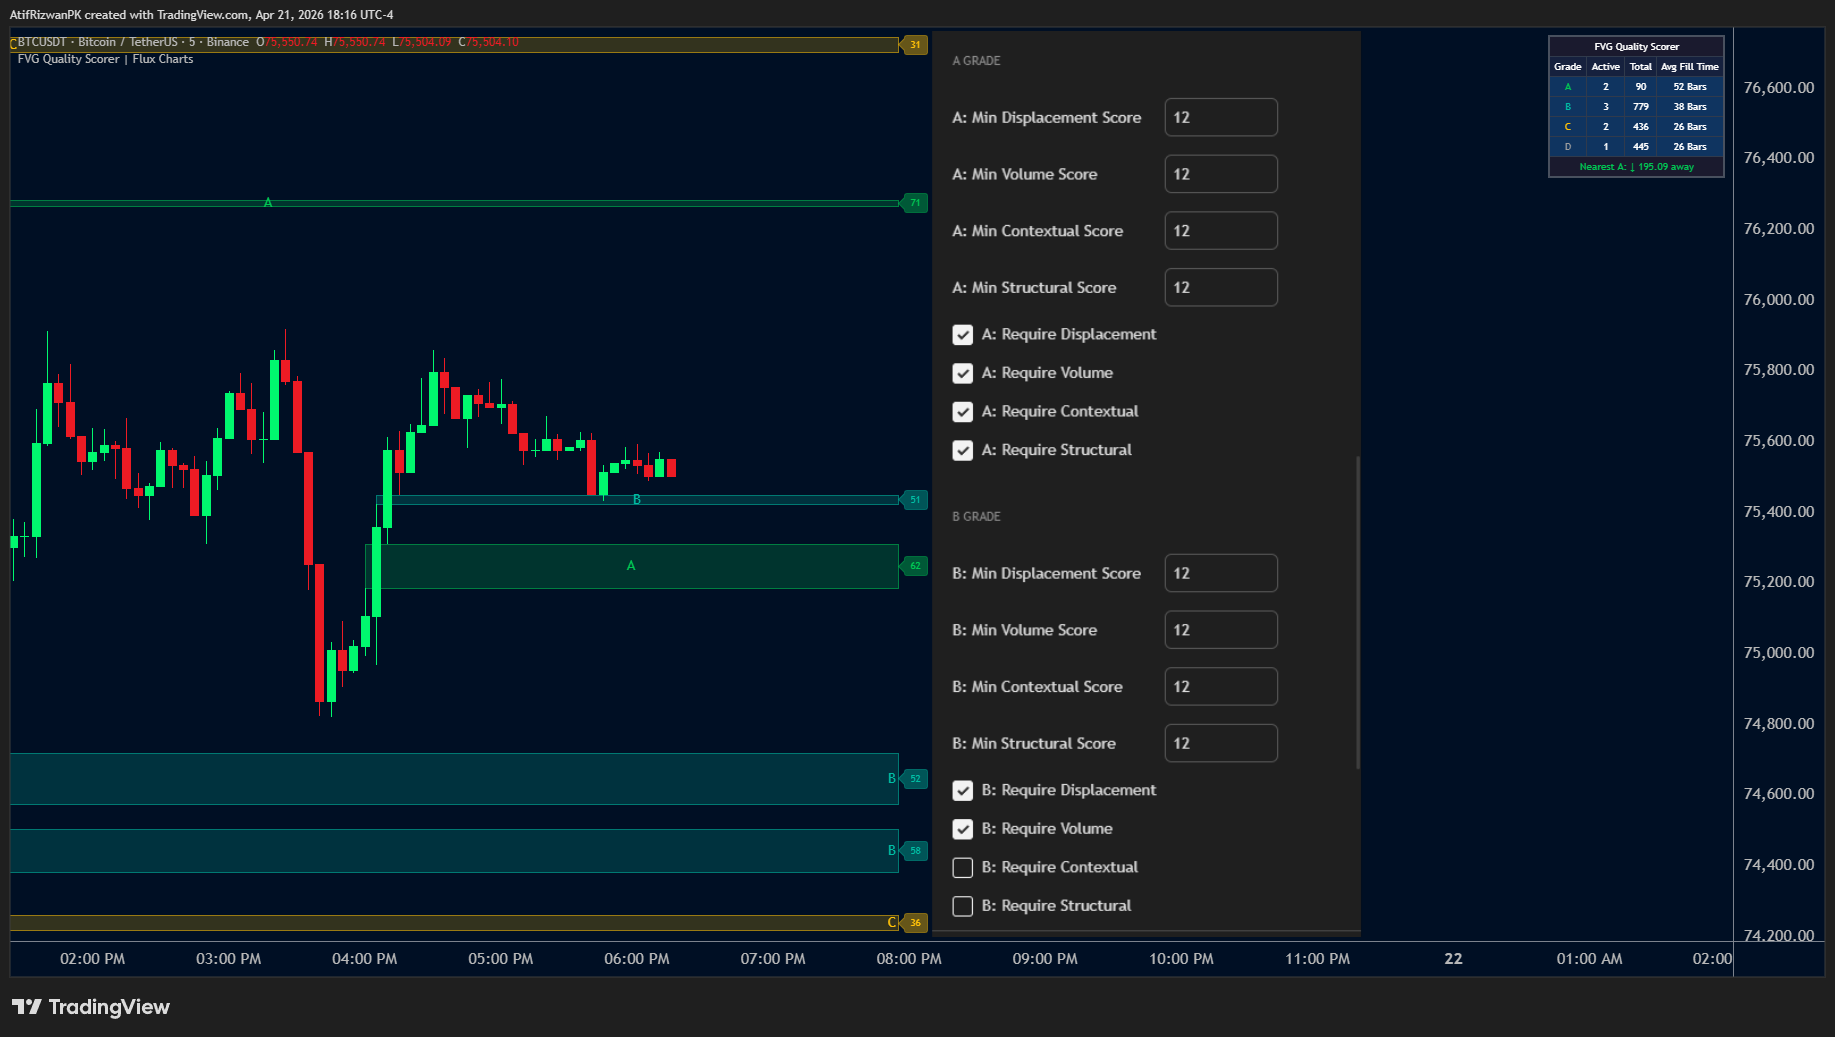
| Grade | Default Min per Axis | Required Axes |
|---|---|---|
| A | 12/25 each axis | All 4 required |
| B | 12/25 each axis | Displacement + Volume required |
| C | 8/25 each axis | Displacement + Volume required |
| D | (fallback) | None required |
| Component | Max Pts | Logic |
|---|---|---|
| Body-to-range ratio | 10 | ≥85% → 10 · ≥70% → 7 · ≥55% → 4 · else → 0 |
| ATR multiple | 10 | Body size ÷ ATR: ≥2× → 10 · ≥1.5× → 7 · ≥1× → 4 · else → 0 |
| Consecutive alignment | 5 | Candles at bar[2] and bar[0] both aligned with FVG direction: 5 · one aligned: 2 · none: 0 |
| Component | Max Pts | Logic |
|---|---|---|
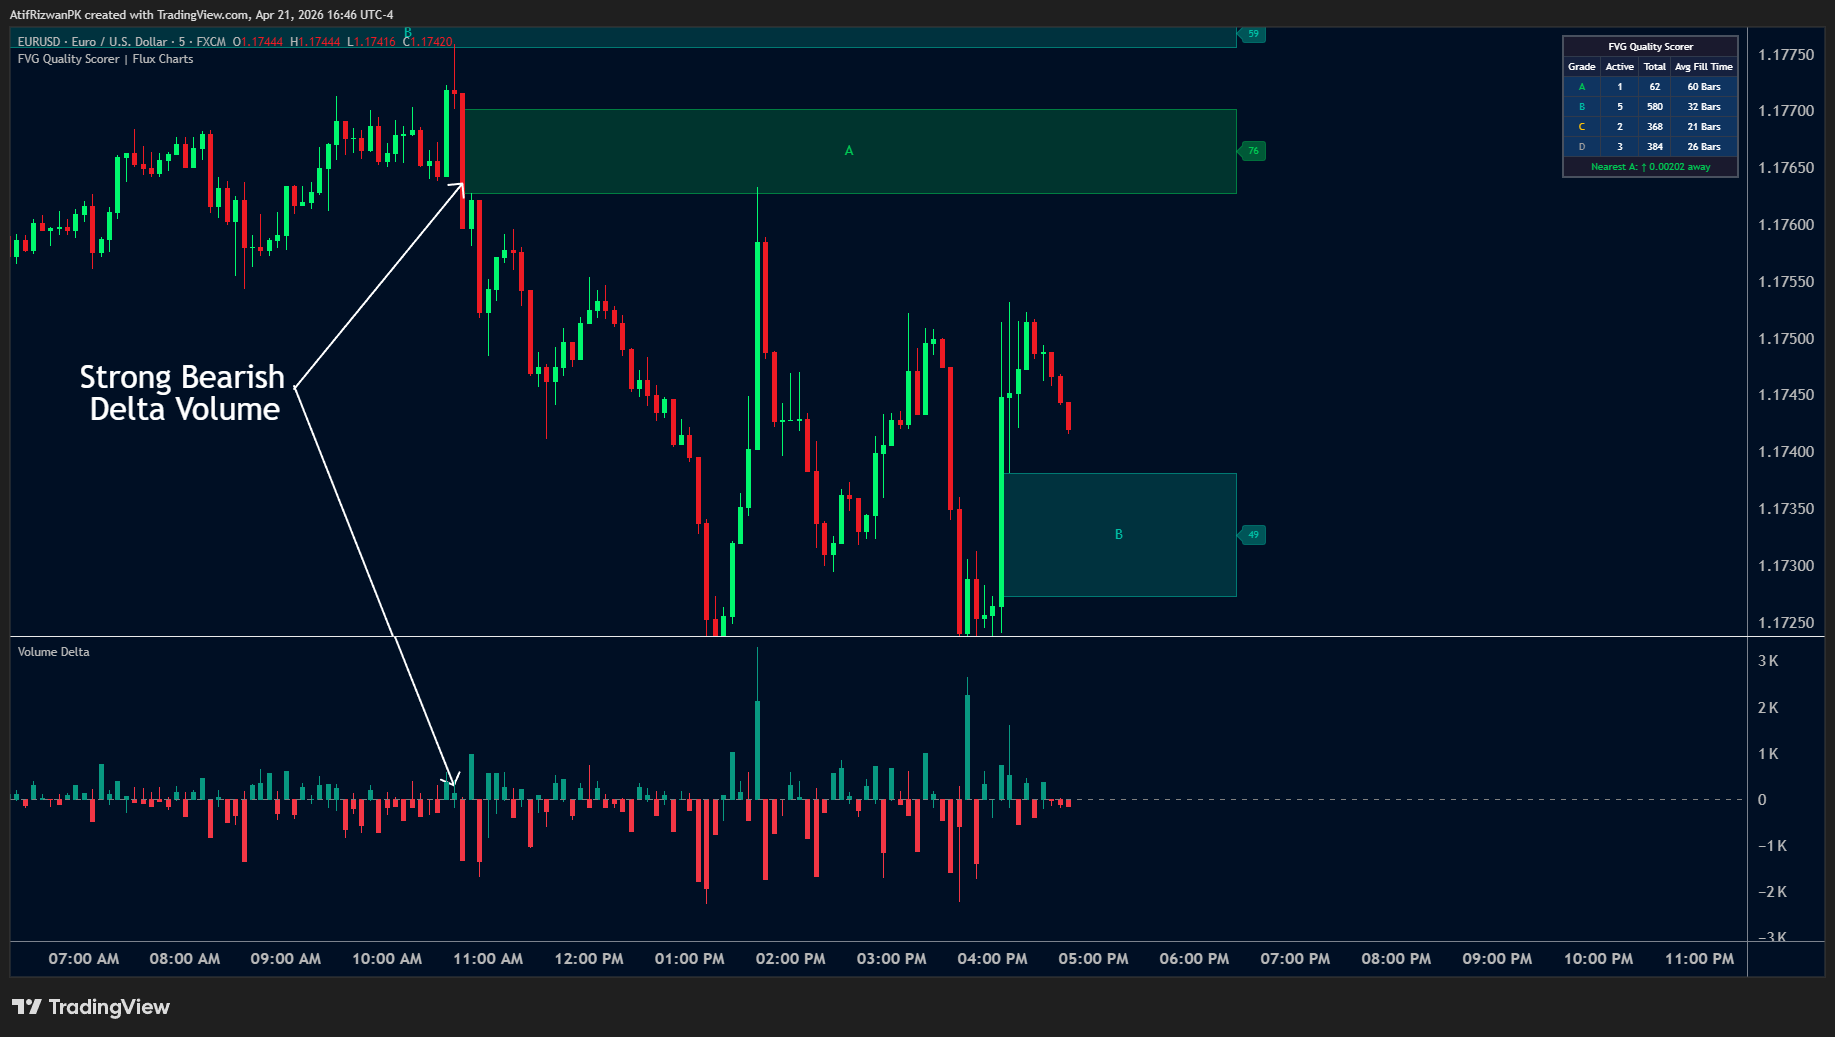
| LTF bull/bear dominance | 12 | Intrabar directional volume ratio on displacement candle: >75% → 12 · ≥60% → 8 · ≥50% → 4 |
| Relative volume | 8 | Bar volume ÷ 20-bar SMA: >2× → 8 · ≥1.5× → 5 · ≥1× → 2 |
| Volume rising into gap | 5 | vol[1] > vol[2] > vol[3] → 5 pts |
| Component | Max Pts | Logic |
|---|---|---|
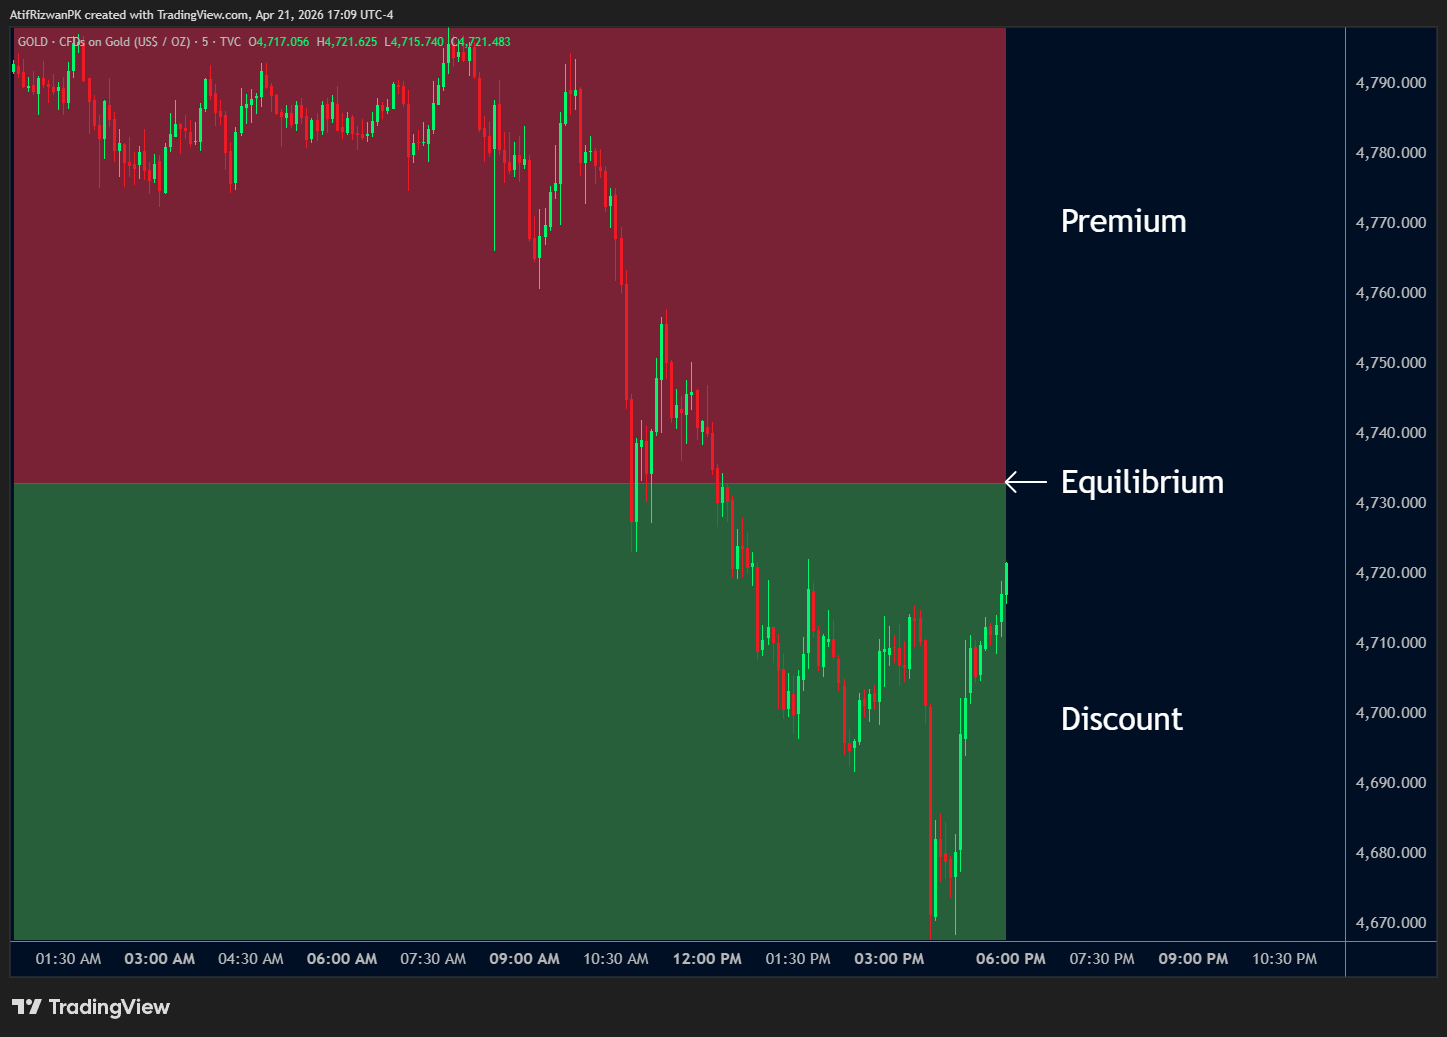
| Premium / Discount zone | 8 | Bull FVG in discount half (below 50% of rangeLb range) = 8 pts; above midpoint = gradient 4→0 |
| HTF FVG nesting | 8 | Current FVG fully inside an HTF FVG of same direction = 8 pts |
| Post-sweep proximity | 5 | Liquidity sweep (wick beyond swing then close back) within sweepWin bars = 5 pts |
| Killzone timing | 4 | FVG formed during Asian / London / NY AM / NY PM session = 4 pts |
| Component | Max Pts | Logic |
|---|---|---|
| Market structure bias | 10 | HH+HL (bull struct) with bullish FVG → 10 · opposing struct → 0 · neutral → 2 |
| EMA alignment | 8 | Bull FVG and close > EMA50 → 8 · Bear FVG and close < EMA50 → 8 · else → 0 |
| Recent BOS/CHoCH | 7 | BOS within bosLb bars, aligned direction → 7 · misaligned → 0 · no recent BOS → 2 |
- atrVal = ta.atr(atrLen) — ATR for displacement scoring
- ema50 = ta.ema(close, emaLen) — trend alignment baseline
- volSma20 = ta.sma(volume, 20) — relative volume baseline
- pivHi / pivLo = ta.pivothigh / pivotlow(swingLen, swingLen) — swing structure for BOS tracking
- request.security_lower_tf — collects per-LTF-bar bull/bear volume arrays, summed per current bar
- request.security(htfTf, [high, low, high[2], low[2]]) — HTF OHLC for nesting check
- inKillzone() — NY-time session detection (Asian ≥20:00, London 02:00–05:00, NY AM 09:30–11:00, NY PM 13:30–16:00)
- rangeHigh/Low/Mid — rolling highest/lowest over rangeLb bars for premium/discount zones

// This Pine Script™ code is subject to the terms of the Mozilla Public License 2.0 at https://mozilla.org/MPL/2.0/
// © fluxchart
//@version=6
indicator("FVG Quality Scorer | Flux Charts", overlay = true, max_boxes_count = 500, max_labels_count = 500, max_bars_back = 5000)
//#region CONSTANTS
GP_SCORE = "Settings"
GP_WEIGHT = "Axis Weights"
GP_DISP = "Display"
GP_DASH = "Dashboard"
TT_LTF = "Lower timeframe used to calculate intrabar volume delta. Use '1' for 1-minute."
TT_HTF = "Higher timeframe to check for FVG nesting confluence."
TT_WEIGHT = "Relative weight for this scoring axis. All weights are normalized to 100."
TT_GRADE = "Hide FVGs below this grade threshold."
TT_MIT = "Wick: invalidated when wick crosses zone. Close: invalidated when close crosses zone."
TT_HIST = "When enabled, mitigated FVGs remain visible as gray boxes."
STATE_FRESH = "Fresh"
STATE_TESTED = "Tested"
STATE_PARTIAL = "PartiallyFilled"
STATE_MIT = "Mitigated"
EXTEND_BARS = 20
GREEN = #00C853
TEAL = #00BFA5
AMBER = #FFC107
GRAY = #9E9E9E
DASH_DARK = #1a1a2e
DASH_MID = #16213e
DASH_ROW = #0f3460
//#endregion CONSTANTS
//#region INPUTS
//#region Settings
swingLen = input.int(5, "Swing Length", minval = 2, maxval = 50, group = GP_SCORE, display = display.none)
atrLen = input.int(14, "ATR Length", minval = 5, maxval = 50, group = GP_SCORE, display = display.none)
ltfTf = input.timeframe("1", "LTF for Volume Delta", group = GP_SCORE, display = display.none, tooltip = TT_LTF)
htfTf = input.timeframe("60", "HTF for FVG Nesting", group = GP_SCORE, display = display.none, tooltip = TT_HTF)
rangeLb = input.int(50, "Range Lookback", minval = 10, maxval = 200, group = GP_SCORE, display = display.none)
sweepWin = input.int(5, "Sweep Proximity Window", minval = 1, maxval = 20, group = GP_SCORE, display = display.none)
bosLb = input.int(20, "BOS/CHoCH Lookback", minval = 5, maxval = 50, group = GP_SCORE, display = display.none)
emaLen = input.int(50, "EMA Length", minval = 10, maxval = 200, group = GP_SCORE, display = display.none)
//#endregion Settings
//#region Axis Weights
dispW = input.int(25, "Displacement Weight", minval = 0, maxval = 100, group = GP_WEIGHT, display = display.none, tooltip = TT_WEIGHT)
volW = input.int(25, "Volume Delta Weight", minval = 0, maxval = 100, group = GP_WEIGHT, display = display.none, tooltip = TT_WEIGHT)
ctxW = input.int(25, "Contextual Weight", minval = 0, maxval = 100, group = GP_WEIGHT, display = display.none, tooltip = TT_WEIGHT)
strW = input.int(25, "Structural Weight", minval = 0, maxval = 100, group = GP_WEIGHT, display = display.none, tooltip = TT_WEIGHT)
//#endregion Axis Weights
//#region Display
minGrade = input.string("C", "Minimum Display Grade", options = ["A", "B", "C", "D"], group = GP_DISP, display = display.none, tooltip = TT_GRADE)
showHist = input.bool(false, "Show Historic (Mitigated)", group = GP_DISP, display = display.none, tooltip = TT_HIST)
showLabels = input.bool(true, "Show Score Labels", group = GP_DISP, display = display.none)
colA = input.color(GREEN, "Grade Colors (A → D)", inline = "gradeColors", group = GP_DISP, display = display.none)
colB = input.color(TEAL, "", inline = "gradeColors", group = GP_DISP, display = display.none)
colC = input.color(AMBER, "", inline = "gradeColors", group = GP_DISP, display = display.none)
colD = input.color(GRAY, "", inline = "gradeColors", group = GP_DISP, display = display.none)
//#endregion Display
mitMethod = input.string("Wick", "Mitigation Method", options = ["Close", "Wick"], group = GP_SCORE, display = display.none, tooltip = TT_MIT)
//#region Dashboard
showDash = input.bool(true, "Show Dashboard", group = GP_DASH)
dashPos = input.string("Top Right", "Dashboard Position", options = ["Top Right", "Top Center", "Top Left", "Middle Right", "Middle Center", "Middle Left", "Bottom Right", "Bottom Center", "Bottom Left"], group = GP_DASH, display = display.none)
dashSize = input.string("Small", "Dashboard Size", options = ["Tiny", "Small", "Normal", "Large", "Huge"], group = GP_DASH, display = display.none)
//#endregion Dashboard
//#region A-Grade Requirements
aMinDisp = input.int(12, "A: Min Displacement Score", minval = 0, maxval = 25, group = "A Grade", display = display.none)
aMinVol = input.int(12, "A: Min Volume Score", minval = 0, maxval = 25, group = "A Grade", display = display.none)
aMinCtx = input.int(12, "A: Min Contextual Score", minval = 0, maxval = 25, group = "A Grade", display = display.none)
aMinStr = input.int(12, "A: Min Structural Score", minval = 0, maxval = 25, group = "A Grade", display = display.none)
aReqDisp = input.bool(true, "A: Require Displacement", group = "A Grade", display = display.none)
aReqVol = input.bool(true, "A: Require Volume", group = "A Grade", display = display.none)
aReqCtx = input.bool(true, "A: Require Contextual", group = "A Grade", display = display.none)
aReqStr = input.bool(true, "A: Require Structural", group = "A Grade", display = display.none)
//#endregion A-Grade Requirements
//#region B-Grade Requirements
bMinDisp = input.int(12, "B: Min Displacement Score", minval = 0, maxval = 25, group = "B Grade", display = display.none)
bMinVol = input.int(12, "B: Min Volume Score", minval = 0, maxval = 25, group = "B Grade", display = display.none)
bMinCtx = input.int(12, "B: Min Contextual Score", minval = 0, maxval = 25, group = "B Grade", display = display.none)
bMinStr = input.int(12, "B: Min Structural Score", minval = 0, maxval = 25, group = "B Grade", display = display.none)
bReqDisp = input.bool(true, "B: Require Displacement", group = "B Grade", display = display.none)
bReqVol = input.bool(true, "B: Require Volume", group = "B Grade", display = display.none)
bReqCtx = input.bool(false, "B: Require Contextual", group = "B Grade", display = display.none)
bReqStr = input.bool(false, "B: Require Structural", group = "B Grade", display = display.none)
//#endregion B-Grade Requirements
//#region C-Grade Requirements
cMinDisp = input.int(8, "C: Min Displacement Score", minval = 0, maxval = 25, group = "C Grade", display = display.none)
cMinVol = input.int(8, "C: Min Volume Score", minval = 0, maxval = 25, group = "C Grade", display = display.none)
cMinCtx = input.int(8, "C: Min Contextual Score", minval = 0, maxval = 25, group = "C Grade", display = display.none)
cMinStr = input.int(8, "C: Min Structural Score", minval = 0, maxval = 25, group = "C Grade", display = display.none)
cReqDisp = input.bool(true, "C: Require Displacement", group = "C Grade", display = display.none)
cReqVol = input.bool(true, "C: Require Volume", group = "C Grade", display = display.none)
cReqCtx = input.bool(false, "C: Require Contextual", group = "C Grade", display = display.none)
cReqStr = input.bool(false, "C: Require Structural", group = "C Grade", display = display.none)
//#endregion C-Grade Requirements
//#endregion INPUTS
//#region DECLARATIONS
//#region USER-DEFINED TYPES
type FVG
int formedAt
float top
float bottom
bool isBullish
string state
int dispScore
int volScore
int ctxScore
int strScore
int totalScore
string grade
int mitigatedAt = na
//#endregion USER-DEFINED TYPES
//#endregion DECLARATIONS
//#region CALCULATIONS
//#region GLOBAL CALCULATIONS
atrVal = ta.atr(atrLen)
ema50 = ta.ema(close, emaLen)
volSma20 = ta.sma(volume, 20)
//#region Swing Highs / Lows for Market Structure
pivHi = ta.pivothigh(high, swingLen, swingLen)
pivLo = ta.pivotlow(low, swingLen, swingLen)
var float lastSwingHigh = na
var float prevSwingHigh = na
var int lastSwingHighBar = na
var float lastSwingLow = na
var float prevSwingLow = na
var int lastSwingLowBar = na
if not na(pivHi)
prevSwingHigh := lastSwingHigh
lastSwingHigh := pivHi
lastSwingHighBar := bar_index - swingLen
if not na(pivLo)
prevSwingLow := lastSwingLow
lastSwingLow := pivLo
lastSwingLowBar := bar_index - swingLen
//#endregion Swing Highs / Lows for Market Structure
//#region BOS Tracking
var int lastBosBar = na
var bool lastBosBull = false
var float brokenSwingHigh = na
var float brokenSwingLow = na
if not na(lastSwingHigh) and close > lastSwingHigh and close[1] <= lastSwingHigh and lastSwingHigh != brokenSwingHigh
lastBosBar := bar_index
lastBosBull := true
brokenSwingHigh := lastSwingHigh
if not na(lastSwingLow) and close < lastSwingLow and close[1] >= lastSwingLow and lastSwingLow != brokenSwingLow
lastBosBar := bar_index
lastBosBull := false
brokenSwingLow := lastSwingLow
//#endregion BOS Tracking
//#region LTF Volume Delta via request.security_lower_tf
[ltfBullVol, ltfBearVol] = request.security_lower_tf(syminfo.tickerid, ltfTf, [close > open ? volume : 0.0, close <= open ? volume : 0.0])
sumBullVol = 0.0
sumBearVol = 0.0
if not na(ltfBullVol) and ltfBullVol.size() > 0
for i = 0 to ltfBullVol.size() - 1
sumBullVol += ltfBullVol.get(i)
sumBearVol += ltfBearVol.get(i)
// sumBullVol[1] / sumBearVol[1] used in scoreVolumeDelta for displacement candle
//#endregion LTF Volume Delta via request.security_lower_tf
//#region HTF FVG Nesting Data
[htfHigh0, htfLow0, htfHigh2, htfLow2] = request.security(syminfo.tickerid, htfTf, [high, low, high[2], low[2]], lookahead = barmerge.lookahead_off)
//#endregion HTF FVG Nesting Data
//#region Killzone Detection (New York Time)
nyHour = hour(time, "America/New_York")
nyMinute = minute(time, "America/New_York")
nyTime = nyHour * 100 + nyMinute
inKillzone() =>
inAsian = nyTime >= 2000
inLondon = nyTime >= 200 and nyTime < 500
inNYAM = nyTime >= 930 and nyTime < 1100
inNYPM = nyTime >= 1330 and nyTime < 1600
inAsian or inLondon or inNYAM or inNYPM
isKillzone = inKillzone()
//#endregion Killzone Detection (New York Time)
//#region Range for Premium / Discount
rangeHigh = ta.highest(high, rangeLb)
rangeLow = ta.lowest(low, rangeLb)
rangeMid = (rangeHigh + rangeLow) / 2.0
//#endregion Range for Premium / Discount
//#endregion GLOBAL CALCULATIONS
//#region FVG STORAGE
var fvgArr = array.new<FVG>()
// Dashboard stats
var aTotal = 0
var aBarsSum = 0
var aBarsCount = 0
var bTotal = 0
var bBarsSum = 0
var bBarsCount = 0
var cTotal = 0
var cBarsSum = 0
var cBarsCount = 0
var dTotal = 0
var dBarsSum = 0
var dBarsCount = 0
//#endregion FVG STORAGE
//#endregion CALCULATIONS
//#region FUNCTIONS
//#region HELPER FUNCTIONS
gradeColor(string g) =>
switch g
"A" => colA
"B" => colB
"C" => colC
=> colD
gradeMinScore(string g) =>
switch g
"A" => 75
"B" => 50
"C" => 25
=> 0
passesFilter(string g) =>
minS = gradeMinScore(minGrade)
gScore = gradeMinScore(g)
gScore >= minS
dashPosition() =>
switch dashPos
"Top Right" => position.top_right
"Top Center" => position.top_center
"Top Left" => position.top_left
"Middle Right" => position.middle_right
"Middle Center" => position.middle_center
"Middle Left" => position.middle_left
"Bottom Right" => position.bottom_right
"Bottom Center" => position.bottom_center
=> position.bottom_left
dashTextSize() =>
switch dashSize
"Tiny" => size.tiny
"Small" => size.small
"Normal" => size.normal
"Large" => size.large
=> size.huge
avgBars(int sumBars, int count) =>
count > 0 ? str.tostring(math.round(sumBars / count)) + " Bars" : "—"
//#endregion HELPER FUNCTIONS
//#region Axis 1: Displacement Strength
scoreDisplacement(bool isBull) =>
// Body-to-range ratio (0-10)
bodyRange = high[1] - low[1]
ratio = bodyRange > 0 ? math.abs(close[1] - open[1]) / bodyRange : 0.0
ptsBody = ratio >= 0.85 ? 10 : ratio >= 0.70 ? 7 : ratio >= 0.55 ? 4 : 0
// ATR multiple (0-10)
mult = atrVal > 0 ? bodyRange / atrVal : 0.0
ptsATR = mult >= 2.0 ? 10 : mult >= 1.5 ? 7 : mult >= 1.0 ? 4 : 0
// Consecutive displacement (0-5)
bar3Aligned = isBull ? close[2] > open[2] : close[2] < open[2]
bar1Aligned = isBull ? close > open : close < open
alignCount = (bar3Aligned ? 1 : 0) + (bar1Aligned ? 1 : 0)
ptsConsec = alignCount == 2 ? 5 : alignCount == 1 ? 2 : 0
ptsBody + ptsATR + ptsConsec
//#endregion Axis 1: Displacement Strength
//#region Axis 2: Volume Delta
scoreVolumeDelta(bool isBull) =>
// LTF bull/bear dominance (0-12) — displacement candle's (bar N-1) LTF data
totalVol = sumBullVol[1] + sumBearVol[1]
dominance = totalVol > 0 ? (isBull ? sumBullVol[1] / totalVol : sumBearVol[1] / totalVol) : 0.0
ptsDom = dominance > 0.75 ? 12 : dominance >= 0.60 ? 8 : dominance >= 0.50 ? 4 : 0
// Relative volume (0-8)
relVol = volSma20 > 0 ? volume[1] / volSma20 : 0.0
ptsRel = relVol > 2.0 ? 8 : relVol >= 1.5 ? 5 : relVol >= 1.0 ? 2 : 0
// Volume rising into gap (0-5)
rising = volume[1] > volume[2] and volume[2] > volume[3]
ptsRise = rising ? 5 : 0
ptsDom + ptsRel + ptsRise
//#endregion Axis 2: Volume Delta
//#region Axis 3: Contextual Location
scoreContextual(bool isBull, float fvgTop, float fvgBottom) =>
fvgMid = (fvgTop + fvgBottom) / 2.0
// Premium/Discount zone (0-8)
// Full points in favorable half, gradient in unfavorable half
rangeSize = rangeHigh - rangeLow
ptsPD = 0
if rangeSize > 0
pos = (fvgMid - rangeLow) / rangeSize
if isBull
// Below midpoint = discount = 8 pts, above midpoint = gradient 4→0
ptsPD := pos <= 0.5 ? 8 : math.round((1.0 - pos) * 8.0)
else
// Above midpoint = premium = 8 pts, below midpoint = gradient 4→0
ptsPD := pos >= 0.5 ? 8 : math.round(pos * 8.0)
// HTF FVG nesting (0-8)
ptsHTF = 0
htfBullFvg = not na(htfLow0) and not na(htfHigh2) and htfLow0 > htfHigh2
htfBearFvg = not na(htfHigh0) and not na(htfLow2) and htfHigh0 < htfLow2
if isBull and htfBullFvg
htfFvgTop = htfLow0
htfFvgBot = htfHigh2
if fvgTop <= htfFvgTop and fvgBottom >= htfFvgBot
ptsHTF := 8
else if not isBull and htfBearFvg
htfFvgTop = htfLow2
htfFvgBot = htfHigh0
if fvgTop <= htfFvgTop and fvgBottom >= htfFvgBot
ptsHTF := 8
// Post-sweep proximity (0-5)
ptsSweep = 0
for i = 1 to sweepWin
if isBull
swingLowAtI = lastSwingLow[i]
if not na(swingLowAtI) and low[i] < swingLowAtI and close[i] > swingLowAtI
ptsSweep := 5
break
if not isBull
swingHighAtI = lastSwingHigh[i]
if not na(swingHighAtI) and high[i] > swingHighAtI and close[i] < swingHighAtI
ptsSweep := 5
break
// Killzone timing (0-4)
ptsKZ = isKillzone ? 4 : 0
ptsPD + ptsHTF + ptsSweep + ptsKZ
//#endregion Axis 3: Contextual Location
//#region Axis 4: Structural Alignment
scoreStructural(bool isBull) =>
// Market structure bias (0-10)
bullStruct = not na(prevSwingHigh) and not na(prevSwingLow) and lastSwingHigh > prevSwingHigh and lastSwingLow > prevSwingLow
bearStruct = not na(prevSwingHigh) and not na(prevSwingLow) and lastSwingHigh < prevSwingHigh and lastSwingLow < prevSwingLow
ptsMkt = 0
if isBull
ptsMkt := bullStruct ? 10 : bearStruct ? 0 : 2
else
ptsMkt := bearStruct ? 10 : bullStruct ? 0 : 2
// EMA alignment (0-8)
ptsEma = 0
if isBull and close > ema50
ptsEma := 8
else if not isBull and close < ema50
ptsEma := 8
// Recent BOS/CHoCH (0-7)
ptsBos = 2
if not na(lastBosBar) and (bar_index - lastBosBar) <= bosLb
if isBull and lastBosBull
ptsBos := 7
else if not isBull and not lastBosBull
ptsBos := 7
else
ptsBos := 0
ptsMkt + ptsEma + ptsBos
//#endregion Axis 4: Structural Alignment
//#region Weighted Total
calcWeightedTotal(int dsp, int vol, int ctx, int str_score) =>
wSum = dispW + volW + ctxW + strW
dW = wSum > 0 ? dispW : 25.0
vW = wSum > 0 ? volW : 25.0
cW = wSum > 0 ? ctxW : 25.0
sW = wSum > 0 ? strW : 25.0
ws = wSum > 0 ? wSum : 100.0
weighted = (dsp / 25.0) * dW + (vol / 25.0) * vW + (ctx / 25.0) * cW + (str_score / 25.0) * sW
result = math.round(weighted * (100.0 / ws))
math.min(result, 100)
getGrade(int dsp, int vol, int ctx, int str_score) =>
aPass = (not aReqDisp or dsp >= aMinDisp) and (not aReqVol or vol >= aMinVol) and (not aReqCtx or ctx >= aMinCtx) and (not aReqStr or str_score >= aMinStr)
bPass = (not bReqDisp or dsp >= bMinDisp) and (not bReqVol or vol >= bMinVol) and (not bReqCtx or ctx >= bMinCtx) and (not bReqStr or str_score >= bMinStr)
cPass = (not cReqDisp or dsp >= cMinDisp) and (not cReqVol or vol >= cMinVol) and (not cReqCtx or ctx >= cMinCtx) and (not cReqStr or str_score >= cMinStr)
aPass ? "A" : bPass ? "B" : cPass ? "C" : "D"
//#endregion Weighted Total
//#region FVG DETECTION
bullFVG = low > high[2]
bearFVG = high < low[2]
//#endregion FVG DETECTION
//#region TOOLTIP BUILDER
buildTooltip(int dsp, int vol, int ctx, int str_score, int total, string g, string st) =>
str.format("FVG Quality Score: {0}/100 ({1})\n──────────────────\nDisplacement: {2}/25\nVolume Delta: {3}/25\nContextual: {4}/25\nStructural: {5}/25\n──────────────────\nState: {6}", total, g, dsp, vol, ctx, str_score, st)
//#endregion TOOLTIP BUILDER
//#endregion FUNCTIONS
//#region EXECUTION
//#region CREATE NEW FVGs
isBullDetect = bullFVG
fvgTop = isBullDetect ? low : low[2]
fvgBottom = isBullDetect ? high[2] : high
// Call scoring functions on every bar for series consistency
dspScore = scoreDisplacement(isBullDetect)
volScore = scoreVolumeDelta(isBullDetect)
ctxScore = scoreContextual(isBullDetect, fvgTop, fvgBottom)
strScore = scoreStructural(isBullDetect)
totalScore = calcWeightedTotal(dspScore, volScore, ctxScore, strScore)
gradeVal = getGrade(dspScore, volScore, ctxScore, strScore)
if bullFVG or bearFVG
// Dashboard tracking
switch gradeVal
"A" => aTotal += 1
"B" => bTotal += 1
"C" => cTotal += 1
"D" => dTotal += 1
newFvg = FVG.new(bar_index, fvgTop, fvgBottom, isBullDetect, STATE_FRESH, dspScore, volScore, ctxScore, strScore, totalScore, gradeVal)
fvgArr.push(newFvg)
//#endregion CREATE NEW FVGs
//#region LIFECYCLE STATE MANAGEMENT
if fvgArr.size() > 0
for i = fvgArr.size() - 1 to 0
fvg = fvgArr.get(i)
if fvg.state == STATE_MIT
continue
isBull = fvg.isBullish
top = fvg.top
bot = fvg.bottom
// Check mitigation
mitigated = false
if mitMethod == "Close"
mitigated := isBull ? close < bot : close > top
else
mitigated := isBull ? low < bot : high > top
if mitigated
fvg.state := STATE_MIT
fvg.mitigatedAt := bar_index
barsAlive = bar_index - fvg.formedAt
switch fvg.grade
"A" =>
aBarsSum += barsAlive
aBarsCount += 1
"B" =>
bBarsSum += barsAlive
bBarsCount += 1
"C" =>
cBarsSum += barsAlive
cBarsCount += 1
"D" =>
dBarsSum += barsAlive
dBarsCount += 1
continue
// Check partially filled
partial = false
if isBull
partial := close < top and close > bot
else
partial := close > bot and close < top
if partial and fvg.state != STATE_PARTIAL
fvg.state := STATE_PARTIAL
// Check tested (price touched zone boundary but didn't enter)
else if not partial and fvg.state == STATE_FRESH
tested = false
if isBull
tested := low <= top and low[1] >= top
else
tested := high >= bot and high[1] <= bot
if tested
fvg.state := STATE_TESTED
// Revert from partial to tested if price exits
else if not partial and fvg.state == STATE_PARTIAL
fvg.state := STATE_TESTED
//#endregion LIFECYCLE STATE MANAGEMENT
//#region MEMORY MANAGEMENT
while fvgArr.size() > 200
fvgArr.shift()
//#endregion MEMORY MANAGEMENT
//#endregion EXECUTION
//#region VISUALS
//#region DEFERRED DRAWING (barstate.islast only)
var drawnBoxes = array.new<box>()
var drawnLabels = array.new<label>()
if barstate.islast
// Clean up previous drawings
if drawnBoxes.size() > 0
for i = 0 to drawnBoxes.size() - 1
box.delete(drawnBoxes.get(i))
if drawnLabels.size() > 0
for i = 0 to drawnLabels.size() - 1
label.delete(drawnLabels.get(i))
drawnBoxes.clear()
drawnLabels.clear()
// Draw all FVGs from array
if fvgArr.size() > 0
for i = 0 to fvgArr.size() - 1
fvg = fvgArr.get(i)
if not passesFilter(fvg.grade)
continue
if fvg.state == STATE_MIT and not showHist
continue
gradeCol = gradeColor(fvg.grade)
bgCol = color.new(gradeCol, 80)
borderCol = color.new(gradeCol, 50)
// Dim for partial fill
if fvg.state == STATE_PARTIAL
bgCol := color.new(gradeCol, 90)
// Gray out mitigated
if fvg.state == STATE_MIT
bgCol := color.new(colD, 90)
borderCol := color.new(colD, 70)
gradeCol := color.new(colD, 50)
// Right edge: mitigated = freeze at mitigatedAt, active = extend
rightEdge = not na(fvg.mitigatedAt) ? fvg.mitigatedAt : bar_index + EXTEND_BARS
box bx = box.new(fvg.formedAt - 2, fvg.top, rightEdge, fvg.bottom, border_color = borderCol, bgcolor = bgCol, border_width = 1, text = fvg.grade, text_color = gradeCol, text_size = size.normal, text_halign = text.align_center, text_valign = text.align_center)
drawnBoxes.push(bx)
if showLabels
ttText = buildTooltip(fvg.dispScore, fvg.volScore, fvg.ctxScore, fvg.strScore, fvg.totalScore, fvg.grade, fvg.state)
label lb = label.new(rightEdge, (fvg.top + fvg.bottom) / 2.0, str.tostring(fvg.totalScore), style = label.style_label_left, color = color.new(gradeCol, 60), textcolor = gradeCol, size = size.small, tooltip = ttText)
drawnLabels.push(lb)
//#endregion DEFERRED DRAWING (barstate.islast only)
//#region DASHBOARD
var table dash = na
if showDash and na(dash)
dash := table.new(dashPosition(), 4, 7, border_width = 1, border_color = color.new(color.gray, 60), frame_width = 2, frame_color = color.new(color.gray, 40))
txtSize = dashTextSize()
// Header
table.cell(dash, 0, 0, "FVG Quality Scorer", text_color = color.white, text_size = txtSize, bgcolor = color.new(DASH_DARK, 0), text_halign = text.align_center)
table.merge_cells(dash, 0, 0, 3, 0)
// Column headers
table.cell(dash, 0, 1, "Grade", text_color = color.white, text_size = txtSize, bgcolor = color.new(DASH_MID, 0), text_halign = text.align_center)
table.cell(dash, 1, 1, "Active", text_color = color.white, text_size = txtSize, bgcolor = color.new(DASH_MID, 0), text_halign = text.align_center)
table.cell(dash, 2, 1, "Total", text_color = color.white, text_size = txtSize, bgcolor = color.new(DASH_MID, 0), text_halign = text.align_center)
table.cell(dash, 3, 1, "Avg Fill Time", text_color = color.white, text_size = txtSize, bgcolor = color.new(DASH_MID, 0), text_halign = text.align_center, tooltip = "Average number of bars from FVG creation to mitigation (mitigated FVGs only)")
// Grade letter cells (static)
rowBg = color.new(DASH_ROW, 0)
table.cell(dash, 0, 2, "A", text_color = colA, text_size = txtSize, bgcolor = rowBg, text_halign = text.align_center)
table.cell(dash, 0, 3, "B", text_color = colB, text_size = txtSize, bgcolor = rowBg, text_halign = text.align_center)
table.cell(dash, 0, 4, "C", text_color = colC, text_size = txtSize, bgcolor = rowBg, text_halign = text.align_center)
table.cell(dash, 0, 5, "D", text_color = colD, text_size = txtSize, bgcolor = rowBg, text_halign = text.align_center)
if showDash and barstate.islast
txtSize = dashTextSize()
rowBg = color.new(DASH_ROW, 0)
// Count active per grade
aActive = 0
bActive = 0
cActive = 0
dActive = 0
float nearestADist = na
nearestAAbove = false
for i = 0 to fvgArr.size() - 1
fvg = fvgArr.get(i)
if fvg.state != STATE_MIT
switch fvg.grade
"A" => aActive += 1
"B" => bActive += 1
"C" => cActive += 1
"D" => dActive += 1
// Track nearest A-grade
if fvg.grade == "A"
isInside = close <= fvg.top and close >= fvg.bottom
dist = 0.0
isAbove = false
if isInside
dist := 0.0
else
isAbove := fvg.bottom > close
edge = isAbove ? fvg.bottom : fvg.top
dist := math.abs(close - edge)
if na(nearestADist) or dist < nearestADist
nearestADist := dist
nearestAAbove := isAbove
// Update dynamic cells
table.cell(dash, 1, 2, str.tostring(aActive), text_color = color.white, text_size = txtSize, bgcolor = rowBg, text_halign = text.align_center)
table.cell(dash, 2, 2, str.tostring(aTotal), text_color = color.white, text_size = txtSize, bgcolor = rowBg, text_halign = text.align_center)
table.cell(dash, 3, 2, avgBars(aBarsSum, aBarsCount), text_color = color.white, text_size = txtSize, bgcolor = rowBg, text_halign = text.align_center)
table.cell(dash, 1, 3, str.tostring(bActive), text_color = color.white, text_size = txtSize, bgcolor = rowBg, text_halign = text.align_center)
table.cell(dash, 2, 3, str.tostring(bTotal), text_color = color.white, text_size = txtSize, bgcolor = rowBg, text_halign = text.align_center)
table.cell(dash, 3, 3, avgBars(bBarsSum, bBarsCount), text_color = color.white, text_size = txtSize, bgcolor = rowBg, text_halign = text.align_center)
table.cell(dash, 1, 4, str.tostring(cActive), text_color = color.white, text_size = txtSize, bgcolor = rowBg, text_halign = text.align_center)
table.cell(dash, 2, 4, str.tostring(cTotal), text_color = color.white, text_size = txtSize, bgcolor = rowBg, text_halign = text.align_center)
table.cell(dash, 3, 4, avgBars(cBarsSum, cBarsCount), text_color = color.white, text_size = txtSize, bgcolor = rowBg, text_halign = text.align_center)
table.cell(dash, 1, 5, str.tostring(dActive), text_color = color.white, text_size = txtSize, bgcolor = rowBg, text_halign = text.align_center)
table.cell(dash, 2, 5, str.tostring(dTotal), text_color = color.white, text_size = txtSize, bgcolor = rowBg, text_halign = text.align_center)
table.cell(dash, 3, 5, avgBars(dBarsSum, dBarsCount), text_color = color.white, text_size = txtSize, bgcolor = rowBg, text_halign = text.align_center)
// Nearest A row
nearestTxt = "Nearest A: "
if not na(nearestADist)
if nearestADist == 0.0
nearestTxt += "Inside zone"
else
arrow = nearestAAbove ? "↑" : "↓"
nearestTxt += arrow + " " + str.tostring(nearestADist, format.mintick) + " away"
else
nearestTxt += "None active"
table.cell(dash, 0, 6, nearestTxt, text_color = colA, text_size = txtSize, bgcolor = color.new(DASH_DARK, 0), text_halign = text.align_center)
table.merge_cells(dash, 0, 6, 3, 6)
//#endregion DASHBOARD
//#endregion VISUALS
//#region ALERTS
newAGrade = false
newBGrade = false
if bullFVG or bearFVG
if fvgArr.size() > 0
latest = fvgArr.last()
if latest.formedAt == bar_index
newAGrade := latest.grade == "A"
newBGrade := latest.grade == "B"
alertcondition(newAGrade, "New A-Grade FVG", "New A-Grade FVG detected on {{ticker}} {{interval}}")
alertcondition(newBGrade, "New B-Grade FVG", "New B-Grade FVG detected on {{ticker}} {{interval}}")
//#endregion ALERTS
Indicator Insider
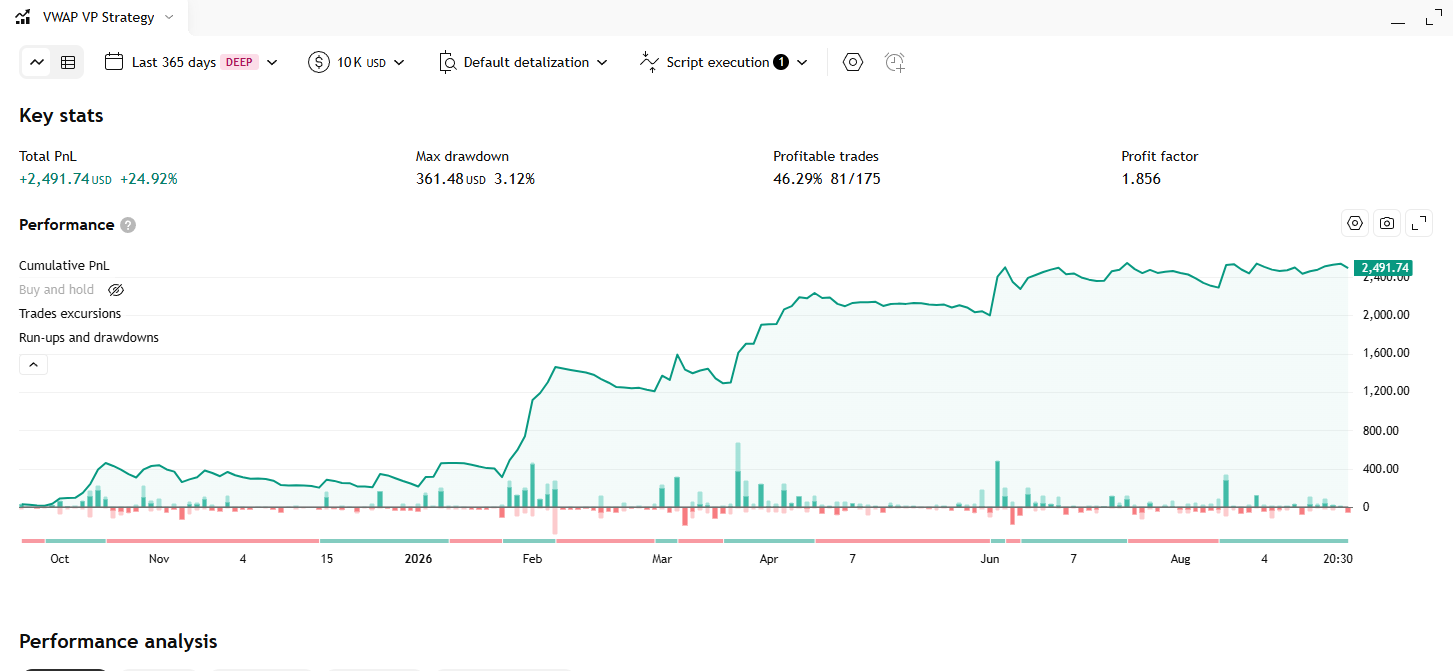
VWAP Volume Profile Indicator – Strategy
Một hồ sơ khối lượng hai chiều dựng trên đường VWAP thay vì trên giá: khối lượng của mỗi nến được gắn dấu cộng hoặc trừ tuỳ VWAP đang lên hay xuống, rồi gom lại thành biểu đồ cột nằm ngang chìa ra cả hai phía ở mép phải chart.
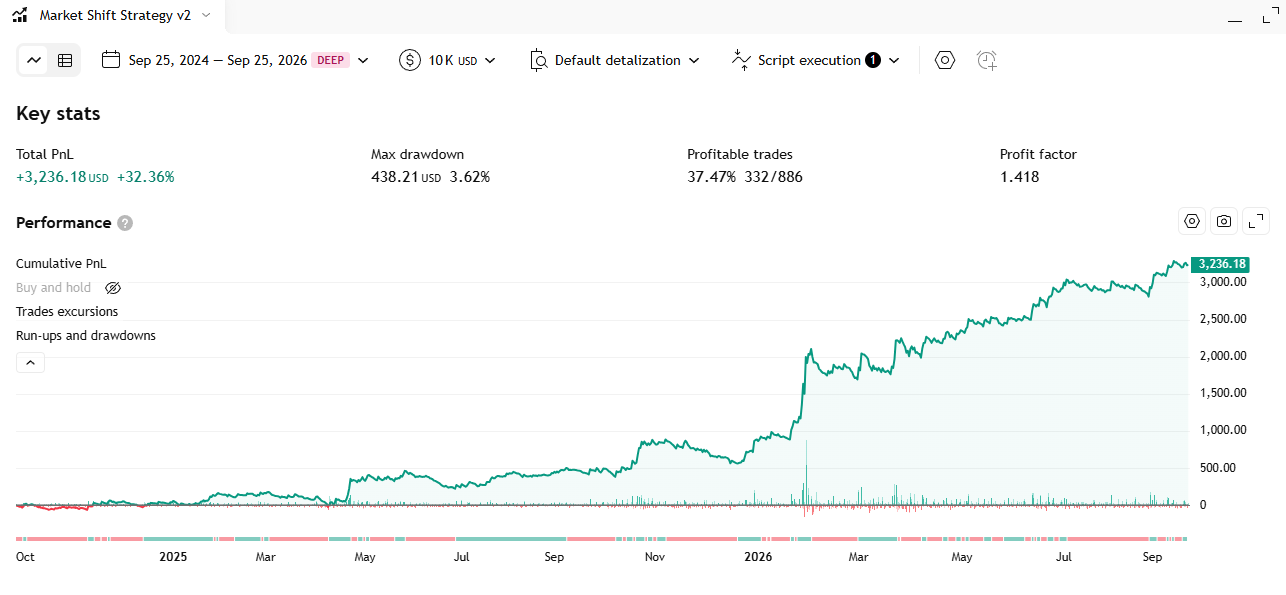
Market Shift Levels Indicator – Strategy
Every time the HMA moving average flips its slope, the indicator locks in the high or the low of that exact candle as a “boundary level”, colors every candle relative to it, and flags the moments price pokes through the level and immediately fails.
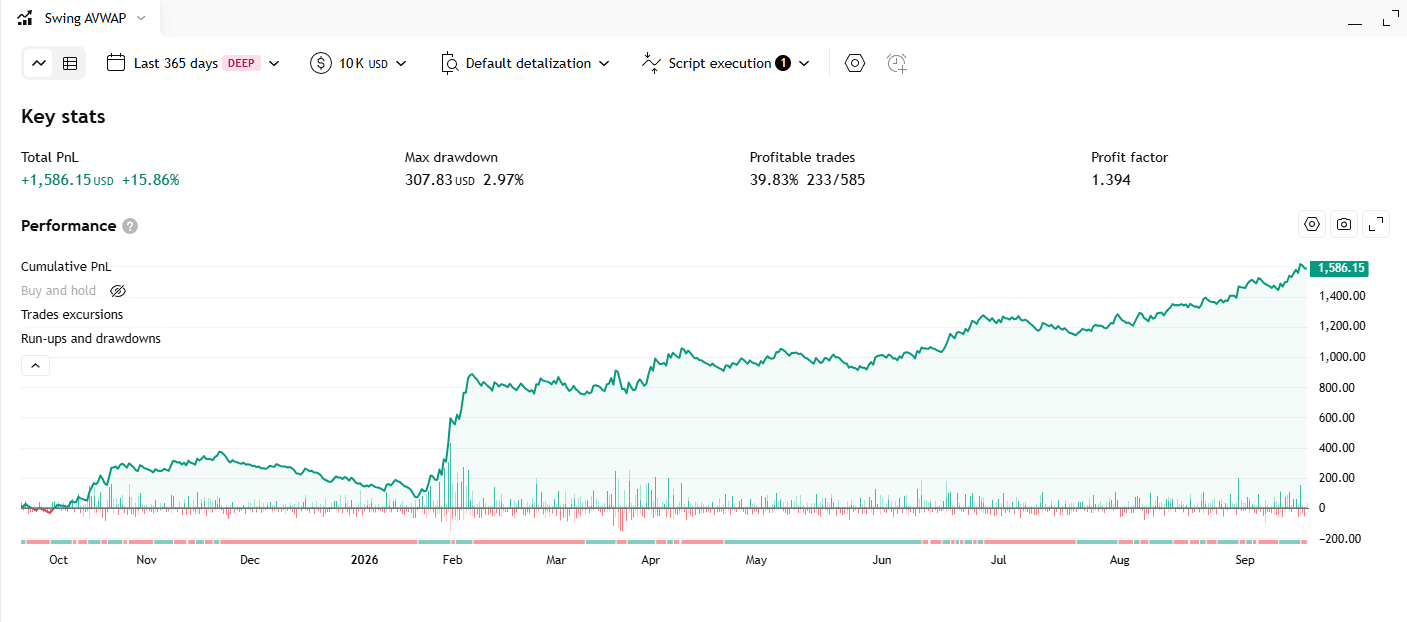
Dynamic Swing Anchored VWAP Indicator – Strategy
Automatically anchors a VWAP line to the most recent swing reversal point, rebuilds the whole line from that anchor every time market structure flips, and tags each anchor with an HH / HL / LH / LL structure label.