1. TP RSI Strategy Description (TrendlineProject)
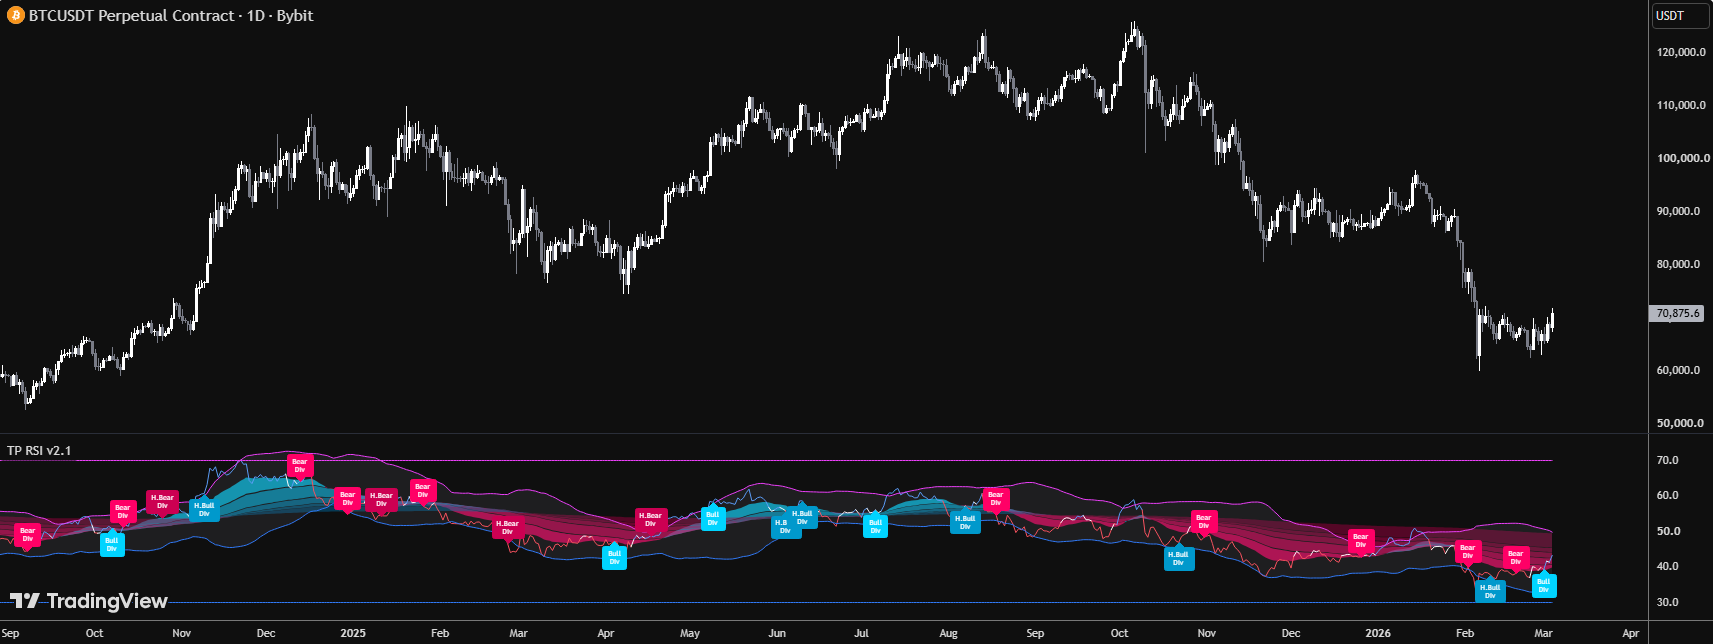
An extended RSI: an adaptive neutral zone based on the RSI's own volatility, a 5-layer EMA ribbon drawn on top of RSI itself, a Regular/Hidden divergence detector, and a second, fully independent Bollinger Bands overlay for visual reference.
1.1 Indicator Concept
The foundation is the RSI (Relative Strength Index) — a momentum indicator measuring the speed and magnitude of price changes, oscillating between 0-100. The traditional way to use RSI is to compare it against 2 fixed thresholds (usually 70/30). This indicator goes further along 3 parallel extensions:
- Adaptive neutral zone: instead of comparing RSI against a fixed level, the indicator measures "the RSI's own volatility" (like plotting Bollinger Bands on the RSI line instead of on price), then treats a narrow band around the RSI's moving average as the "neutral zone". Only when RSI fully escapes this narrow band is it counted as a bullish/bearish signal — filtering out more noise than watching RSI oscillate around a single fixed number.
- 5-layer ribbon on RSI itself: applies the "multi-MA ribbon" idea (usually seen on price) but to the RSI value — producing a "trend of momentum" picture across 5 different speeds (5 fast/slow MA pairs), letting you see whether momentum is accelerating or decelerating across multiple layers, instead of a single flat RSI line.
- Divergence between price and RSI: when price highs/lows and RSI highs/lows "disagree" (price makes a higher high but RSI makes a lower high, or vice versa), that signals momentum is genuinely weakening/strengthening even though price hasn't reflected it yet — split into two types: Regular (warns of a possible reversal) and Hidden (confirms the trend is likely to continue after a pullback).
1.2 Indicator Features
-
Display:
- RSI line: turns blue (bullish, RSI has clearly moved above the neutral zone), red (bearish, RSI has clearly dropped below the neutral zone), or off-white (still inside the neutral zone).
- 5-layer ribbon (cloud): 5 shaded areas between 5 fast/slow MA pairs applied to RSI (defaults EMA 21/48, 51/98, 103/149, 155/199, 206/499). Each layer changes color under 2 style modes (Gradient Fade — 5 distinct shades by layer, or Classic — just 2 flat colors). Faster layers are drawn more solid, slower layers more transparent (creating a sense of depth). The 10 individual MA lines can also be shown (hidden by default).
- Second Bollinger Bands (direct display): an independent BB drawn on RSI (default period 50, multiplier 2.0) — purely a visual reference for how "stretched" RSI is relative to its recent volatility, NOT related to the neutral zone above (see the technical note in section 1.4).
- Divergence labels: 4 types — "Bull Div" / "Bear Div" (Regular) and "H.Bull Div" / "H.Bear Div" (Hidden), placed directly at the RSI line.
- Overbought/Oversold/Midline levels: 3 customizable horizontal lines, hidden by default (Overbought=70, Oversold=30, Midline=50).
- Alerts: The indicator has 8 alertcondition() calls: "RSI Bullish/Bearish Signal" (RSI exits the neutral zone), 4 divergence alerts (Regular Bull/Bear, Hidden Bull/Bear), and "RSI Overbought"/"RSI Oversold" (RSI crosses the 70/30 level — these work independently of whether the two level lines are actually displayed on the chart).
1.3 How to Use the Indicator
- Watch the RSI line's color changes to catch momentum signals exiting the neutral zone earlier than waiting for RSI to hit the fixed 70/30 — useful when RSI is chopping in a narrow range for a long time.
- Read the 5-layer ribbon as a "multi-layer consensus" of momentum: all 5 layers pointing the same direction (all bullish or all bearish) → strong, synchronized momentum; the fastest layer (Ribbon 1, MA 21/48) reversing before the slower layers → early warning that momentum on a bigger scale may be about to turn.
- Use the displayed second BB to notice when RSI is "stretched" hard relative to its own recent swings (RSI touching the upper/lower band of the second BB), which is different from just watching RSI vs. a static 70/30.
- Regular Divergence (Bull/Bear Div): consider looking for a potential reversal point when price makes a new high/low but RSI fails to confirm.
- Hidden Divergence (H.Bull/H.Bear Div): use it to confirm the current trend is likely to continue after a pullback/correction, rather than as a reversal signal.
- Alerts can be set for all 8 events above instead of watching the chart manually.
1.4 How the Indicator Works
Inputs & their role
- src (price source, default close): the price used to compute the base RSI.
- for_rsi (integer, default 50): the RSI period — much larger than the common default of 14, producing a smoother/slower RSI line, less noisy but more lagging than a traditional RSI 14.
- for_ma (integer, default 50): the EMA period used to smooth RSI into the "basis" line — the central axis of the adaptive neutral zone. Increasing it → the neutral zone reacts more "slowly" to recent changes in volatility.
- for_mult (decimal, default 1.0): the standard-deviation multiplier of RSI used to compute the outer envelope (upper/lower) — this envelope is never plotted directly, it's only an intermediate step used to derive the narrower neutral zone (see Flow 1). Increasing mult → wider neutral zone → RSI must move more strongly before the color changes / a signal fires.
- i_rsi_line_width, i_bull_color, i_bear_color, i_neutral_color: line thickness and the 3 colors of the RSI line per zone state.
- matype (choice EMA/SMA/WMA/HMA/RMA/ALMA, default EMA): the moving-average type used for ALL 10 ribbon lines — applied to the RSI value, not to price.
- ma_len1…ma_len10 (defaults 21/48, 51/98, 103/149, 155/199, 206/499): 5 short/long period pairs forming the 5 ribbon layers. Smaller pairs (e.g. 21/48) react faster to recent RSI changes; larger pairs (e.g. 206/499) reflect longer-term momentum trend, slower to change.
- showLine (on/off, default OFF): show/hide the 10 individual ribbon MA lines (by default only the colored cloud is shown, not the lines).
- i_show_ribbon (on/off, default ON): master switch for the whole ribbon (both lines and cloud). To see the ribbon MA lines you need BOTH showLine and i_show_ribbon turned on; the cloud only needs i_show_ribbon on.
- i_ribbon_style (Gradient Fade / Classic, default Gradient Fade): Gradient Fade gives each layer its own shade (darker to lighter by layer); Classic uses only 2 flat colors for every layer regardless of layer number.
- i_cloud_transparency (integer, default 40, range 20-90): the cloud's base transparency — each layer additionally adds/subtracts 5-10 units by layer order (layer 1 darker by −10, layer 5 lighter by +10) to create a sense of depth.
- i_show_divergence (on/off, default ON): master switch for the entire divergence feature.
- i_show_regular / i_show_hidden (on/off, default ON for both): toggle Regular / Hidden divergence types individually.
- i_pivot_lookback (integer, default 5, range 1-20): number of bars on each side used to confirm a swing high/low — used for BOTH the RSI pivots AND the price pivots (high/low). Increasing it → fewer but "stronger" pivots.
- i_max_lookback (integer, default 60, range 10-200): the maximum bar distance between two consecutive pivots for them to still qualify as a valid divergence pair — too far apart and they're considered unrelated, comparison is skipped.
- i_bull_reg_color, i_bear_reg_color, i_bull_hid_color, i_bear_hid_color, i_div_label_size: colors and font size of the 4 divergence label types.
- i_show_bb (on/off, default ON): show/hide the second Bollinger Bands (displayed directly on the chart).
- i_bb_length (integer, default 50): the period for the second BB — fully independent of for_ma even though both default to 50.
- i_bb_mult (decimal, default 2.0): the standard-deviation multiplier for the second BB — independent of for_mult even though both play the same "stdev multiplier" role.
- i_bb_upper_color, i_bb_lower_color, i_bb_width, i_show_bb_fill, i_bb_fill_transp: color/thickness/fill of the second BB.
- i_show_ob_os (on/off, default OFF): show/hide the 2 Overbought/Oversold level lines.
- i_ob_level / i_os_level (defaults 70 / 30): the values of these 2 levels — note that the Overbought/Oversold alerts still fire even when the lines are hidden (see the Alerts section).
- i_show_mid / i_mid_level (defaults OFF / 50): the midline, purely a visual reference.
Main logic blocks
🎨 Flow 1 — RSI & Adaptive Neutral Zone (every bar)
- current_rsi = RSI(src, for_rsi).
- basis = EMA(current_rsi, for_ma) — the center line; dev = for_mult × stdev(current_rsi, for_ma); upper = basis+dev, lower = basis−dev — this is a complete Bollinger envelope computed on RSI but never plotted on the chart, it's only an intermediate step.
- The neutral zone actually used to trigger signals: disp_up = basis + (upper−lower)×0.1; disp_down = basis − (upper−lower)×0.1. Since (upper−lower) = 2×dev, disp_up/disp_down are only 0.2×dev away from basis on each side — i.e. only 10% of the full Bollinger envelope's width above, NOT the entire upper/lower range.
- Concrete example: basis=50, dev=8 (for_mult=1.0) → upper=58, lower=42, envelope width=16. disp_up = 50 + 16×0.1 = 51.6; disp_down = 50 − 1.6 = 48.4. The actual neutral zone is only 3.2 RSI points wide around basis, much narrower than the 42-58 envelope that for_ma/for_mult directly produce.
- RSI line color: current_rsi ≥ disp_up → blue (bull); current_rsi ≤ disp_down → red (bear); otherwise → off-white (neutral). rsi_Green = RSI crosses above disp_up; rsi_Red = RSI crosses below disp_down — these two events are the source of the two "RSI Bullish/Bearish Signal" alerts.
📊 Flow 2 — 5-Layer Ribbon on RSI (every bar)
- The f_ma() function computes one of 6 MA types (per matype) applied to current_rsi — producing 10 lines: mashort1-5, malong1-5, following the 5 period pairs declared in Inputs.
- 3 independent color decisions share the same color table f_get_ribbon_colors(style, condition, layer):
- Cloud color (layer X): based on mashortX ≥ malongX (whether the short/long pair is currently "bullish" or not) — determines the fill color between the two lines.
- Short line color (layer X): based on mashortX ≥ mashortX 1 bar ago (whether the short line itself is rising or falling).
- Long line color (layer X): based on malongX ≥ malongX 1 bar ago (whether the long line itself is rising or falling).
- Drawing: 10 plot() calls with color=na (invisible) unless BOTH showLine AND i_show_ribbon are on; 5 fill() calls connect each short-long pair, shown when i_show_ribbon is on, with transparency = i_cloud_transparency ± an offset per layer (layer 1 most solid, layer 5 most transparent).
🔍 Flow 3 — Divergence Detection (every bar)
- 4 separate pivot arrays are maintained (max 10 elements each, newest always at index 0): RSI highs, RSI lows, price highs (high), price lows (low) — every time ta.pivothigh/pivotlow (lagged by i_pivot_lookback bars) confirms a new point, it's pushed to the front of the matching array.
- When a new RSI pivot appears (is_new_low/is_new_high, based on the RSI arrays), the two most recent entries (index 0 = current, index 1 = previous) of BOTH the RSI array and the corresponding price array are compared, with the distance between the two pivots required to be > i_pivot_lookback (a distinct pivot) and ≤ i_max_lookback (not too old/far).
- Bullish Regular: the later price low < the earlier low (Lower Low) BUT the later RSI low > the earlier low (Higher Low) → price keeps falling but downward momentum has already weakened.
- Bearish Regular: the later price high > the earlier high (Higher High) BUT the later RSI high < the earlier high (Lower High) → price keeps rising but upward momentum has already weakened.
- Bullish Hidden: the later price low > the earlier low (Higher Low, a pullback within an uptrend) BUT the later RSI low < the earlier low (Lower Low) → the uptrend is likely to continue after the pullback.
- Bearish Hidden: the later price high < the earlier high (Lower High, a pullback within a downtrend) BUT the later RSI high > the earlier high (Higher High) → the downtrend is likely to continue after the pullback.
- The matching label is drawn at (bar_index, current_rsi) if i_show_divergence plus the relevant type toggle (Regular/Hidden) are on.
📏 Flow 4 — Second Bollinger Bands & Level Lines (every bar)
- basi/dev1/upper1/lower1 = a COMPLETELY SEPARATE SMA+stdev pair computed on current_rsi, using i_bb_length/i_bb_mult — drawn directly as 2 Upper/Lower lines plus an optional fill, if i_show_bb is on.
- 3 stepline level lines Overbought/Oversold/Midline drawn per i_ob_level/i_os_level/i_mid_level, each hidden by its own toggle.
Outputs & how they're used
- 3-color RSI line: the main momentum signal, already filtered through the adaptive neutral zone instead of a fixed threshold.
- 5-layer ribbon cloud: a multi-layer picture of the momentum trend — used to gauge consensus/divergence across different momentum "speeds".
- Divergence labels: early warning of a possible reversal (Regular) or confirmation of trend continuation (Hidden).
- Second BB + level lines: additional visual reference for how "stretched" RSI is, independent of the neutral-zone mechanism that actually drives color/alerts.
- 8 Alerts: allow full automation of monitoring all the events above without watching the chart directly.