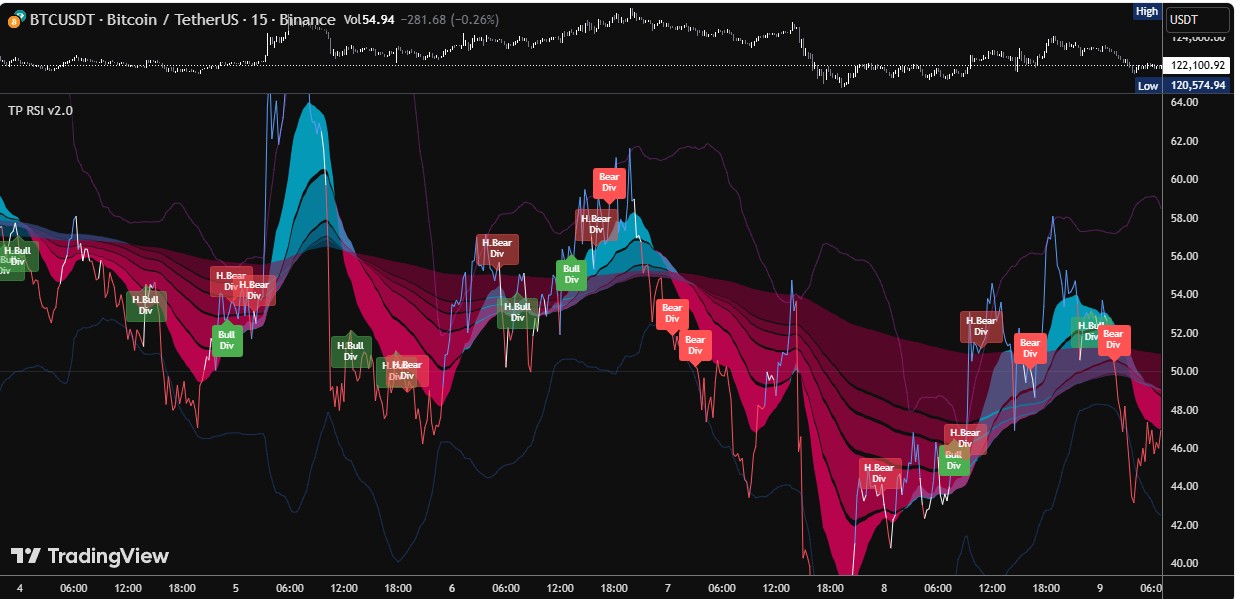
TP RSI Indicator
TP RSI indicator for TradingView: how it works, settings, signals and strategy logic.
TP RSI indicator for TradingView: how it works, settings, signals and strategy logic.
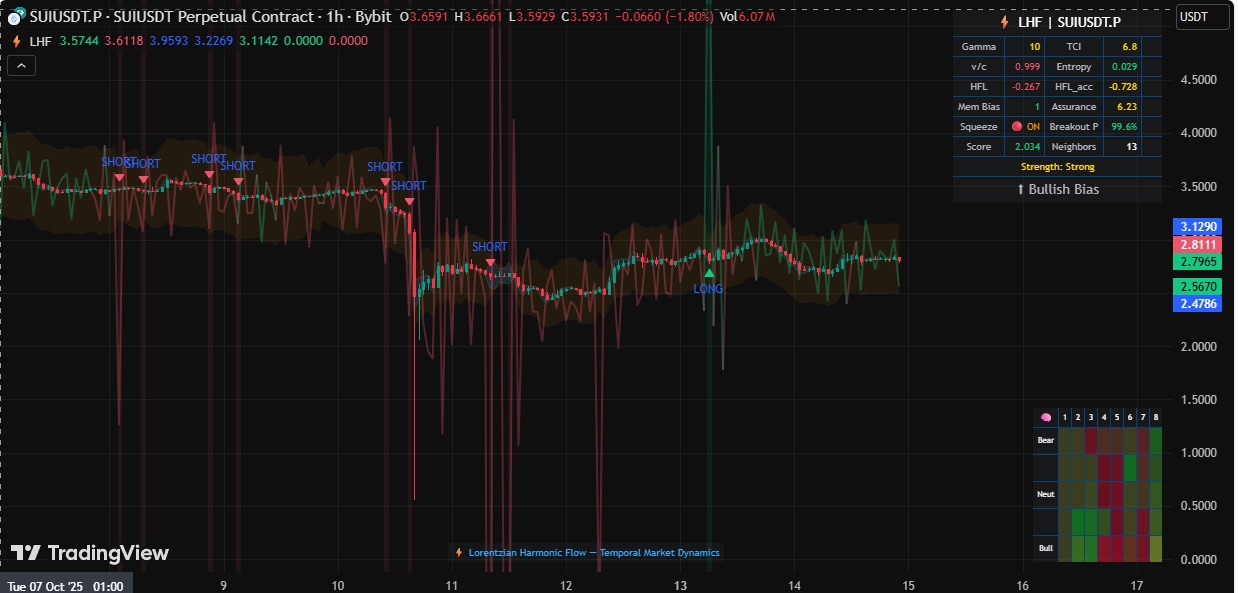
Lorentzian Harmonic Flow: an indicator that treats market time as uneven, stretching it when volatility spikes. How it works and settings.
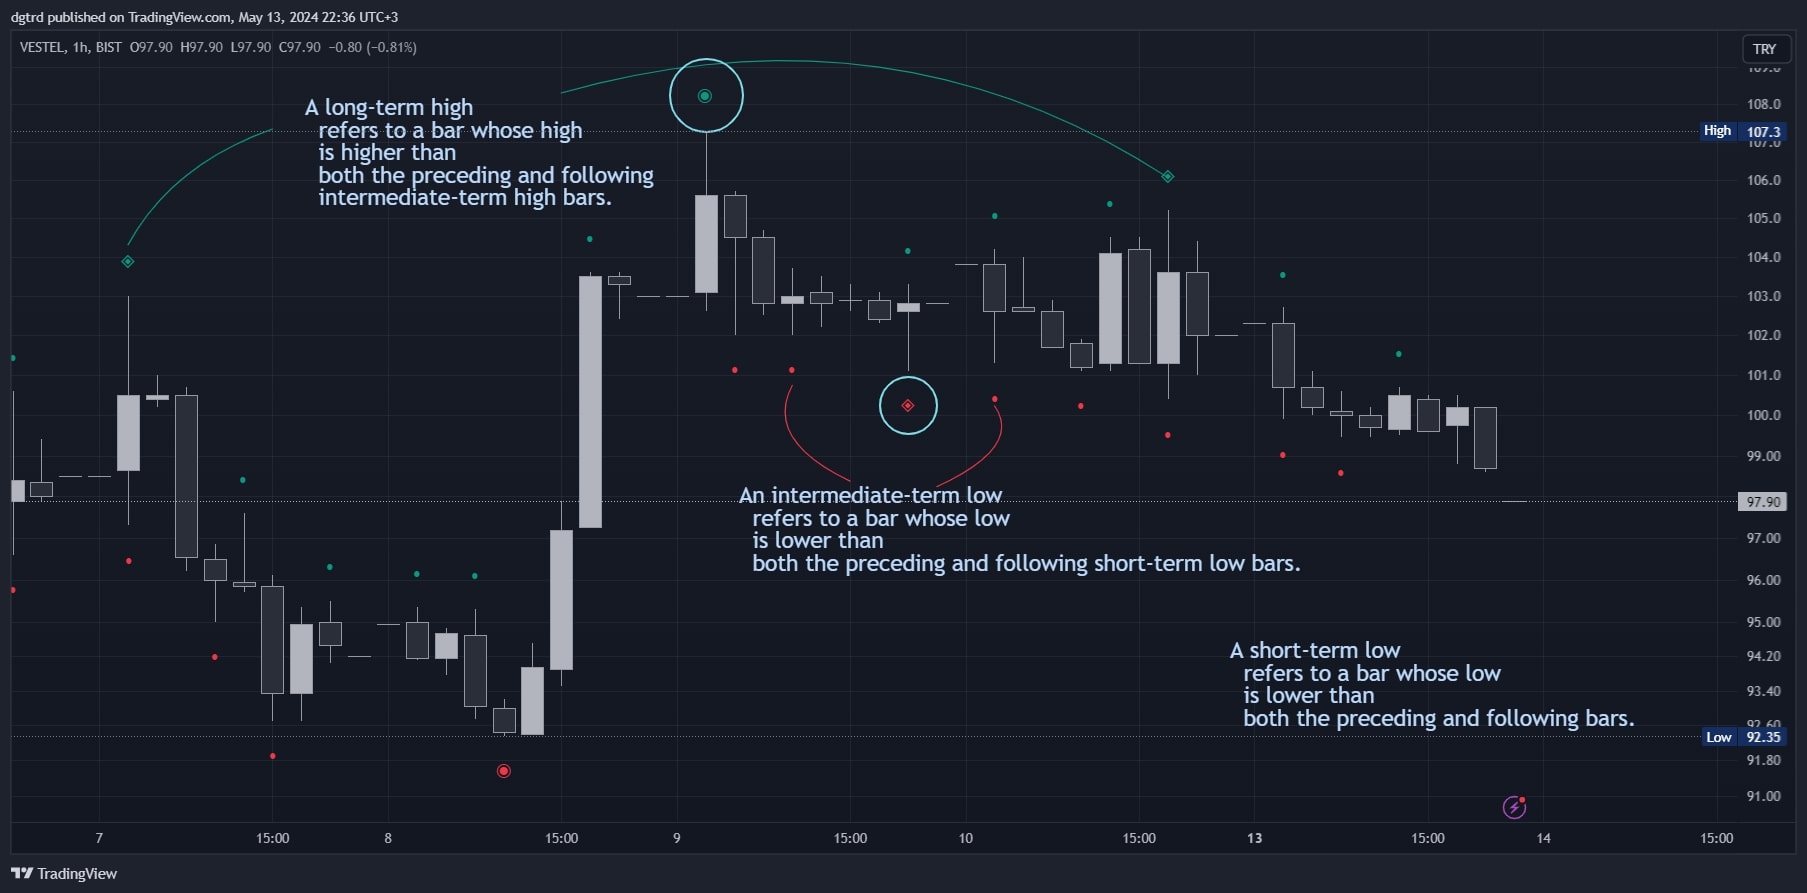
ICT Anchored Market Structures: an indicator built on ICT market structure theory that marks anchored structure shifts. How it works.
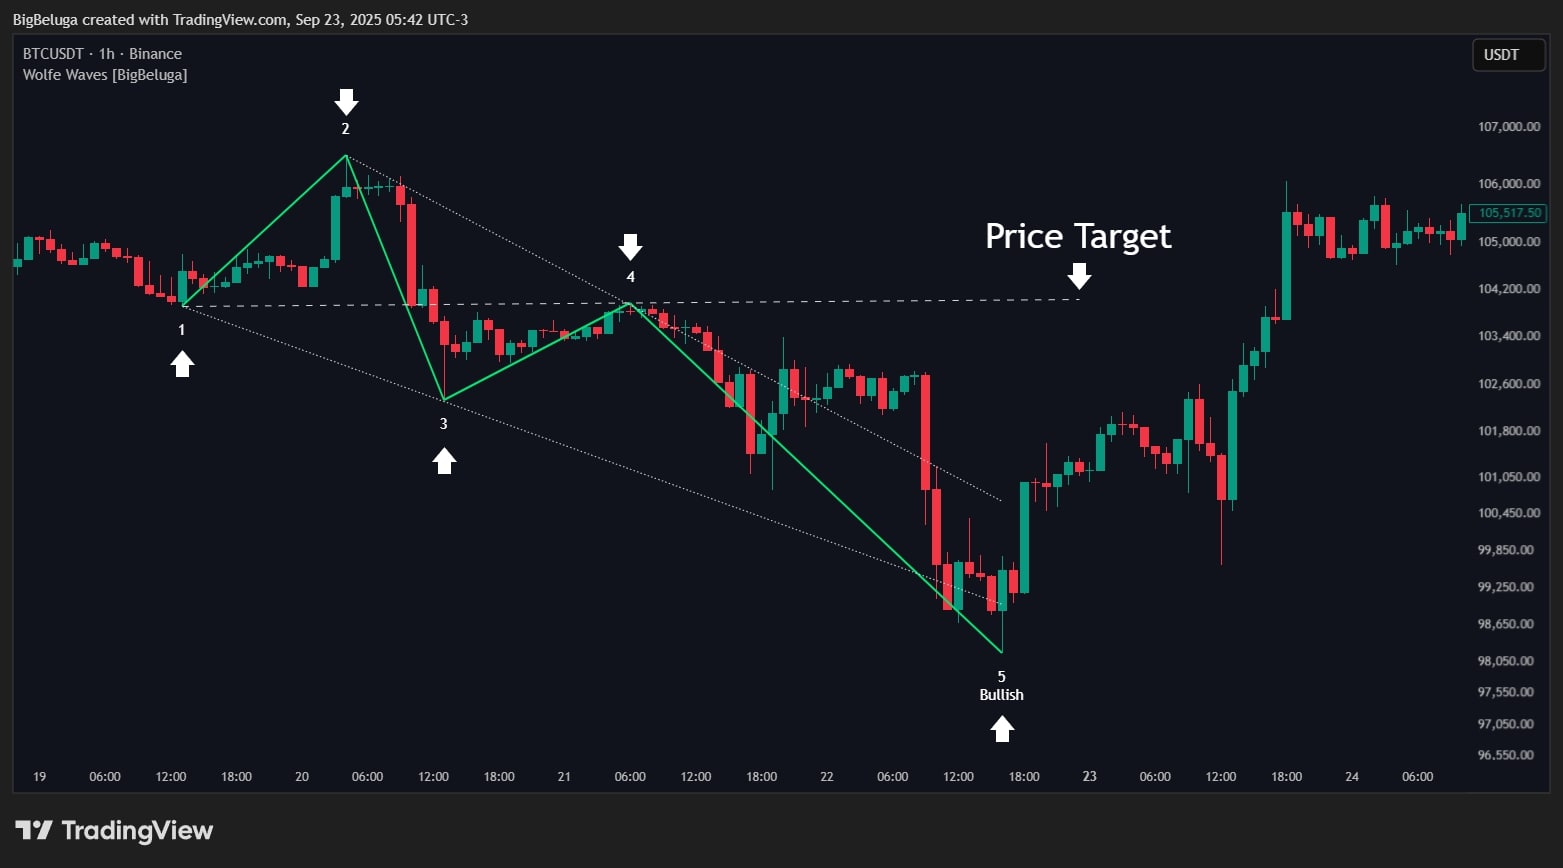
Wolfe Waves indicator: the Wolfe Waves indicator is based on the theory developed by Bill Wolfe during the 1980s–1990s. How it works and settings.
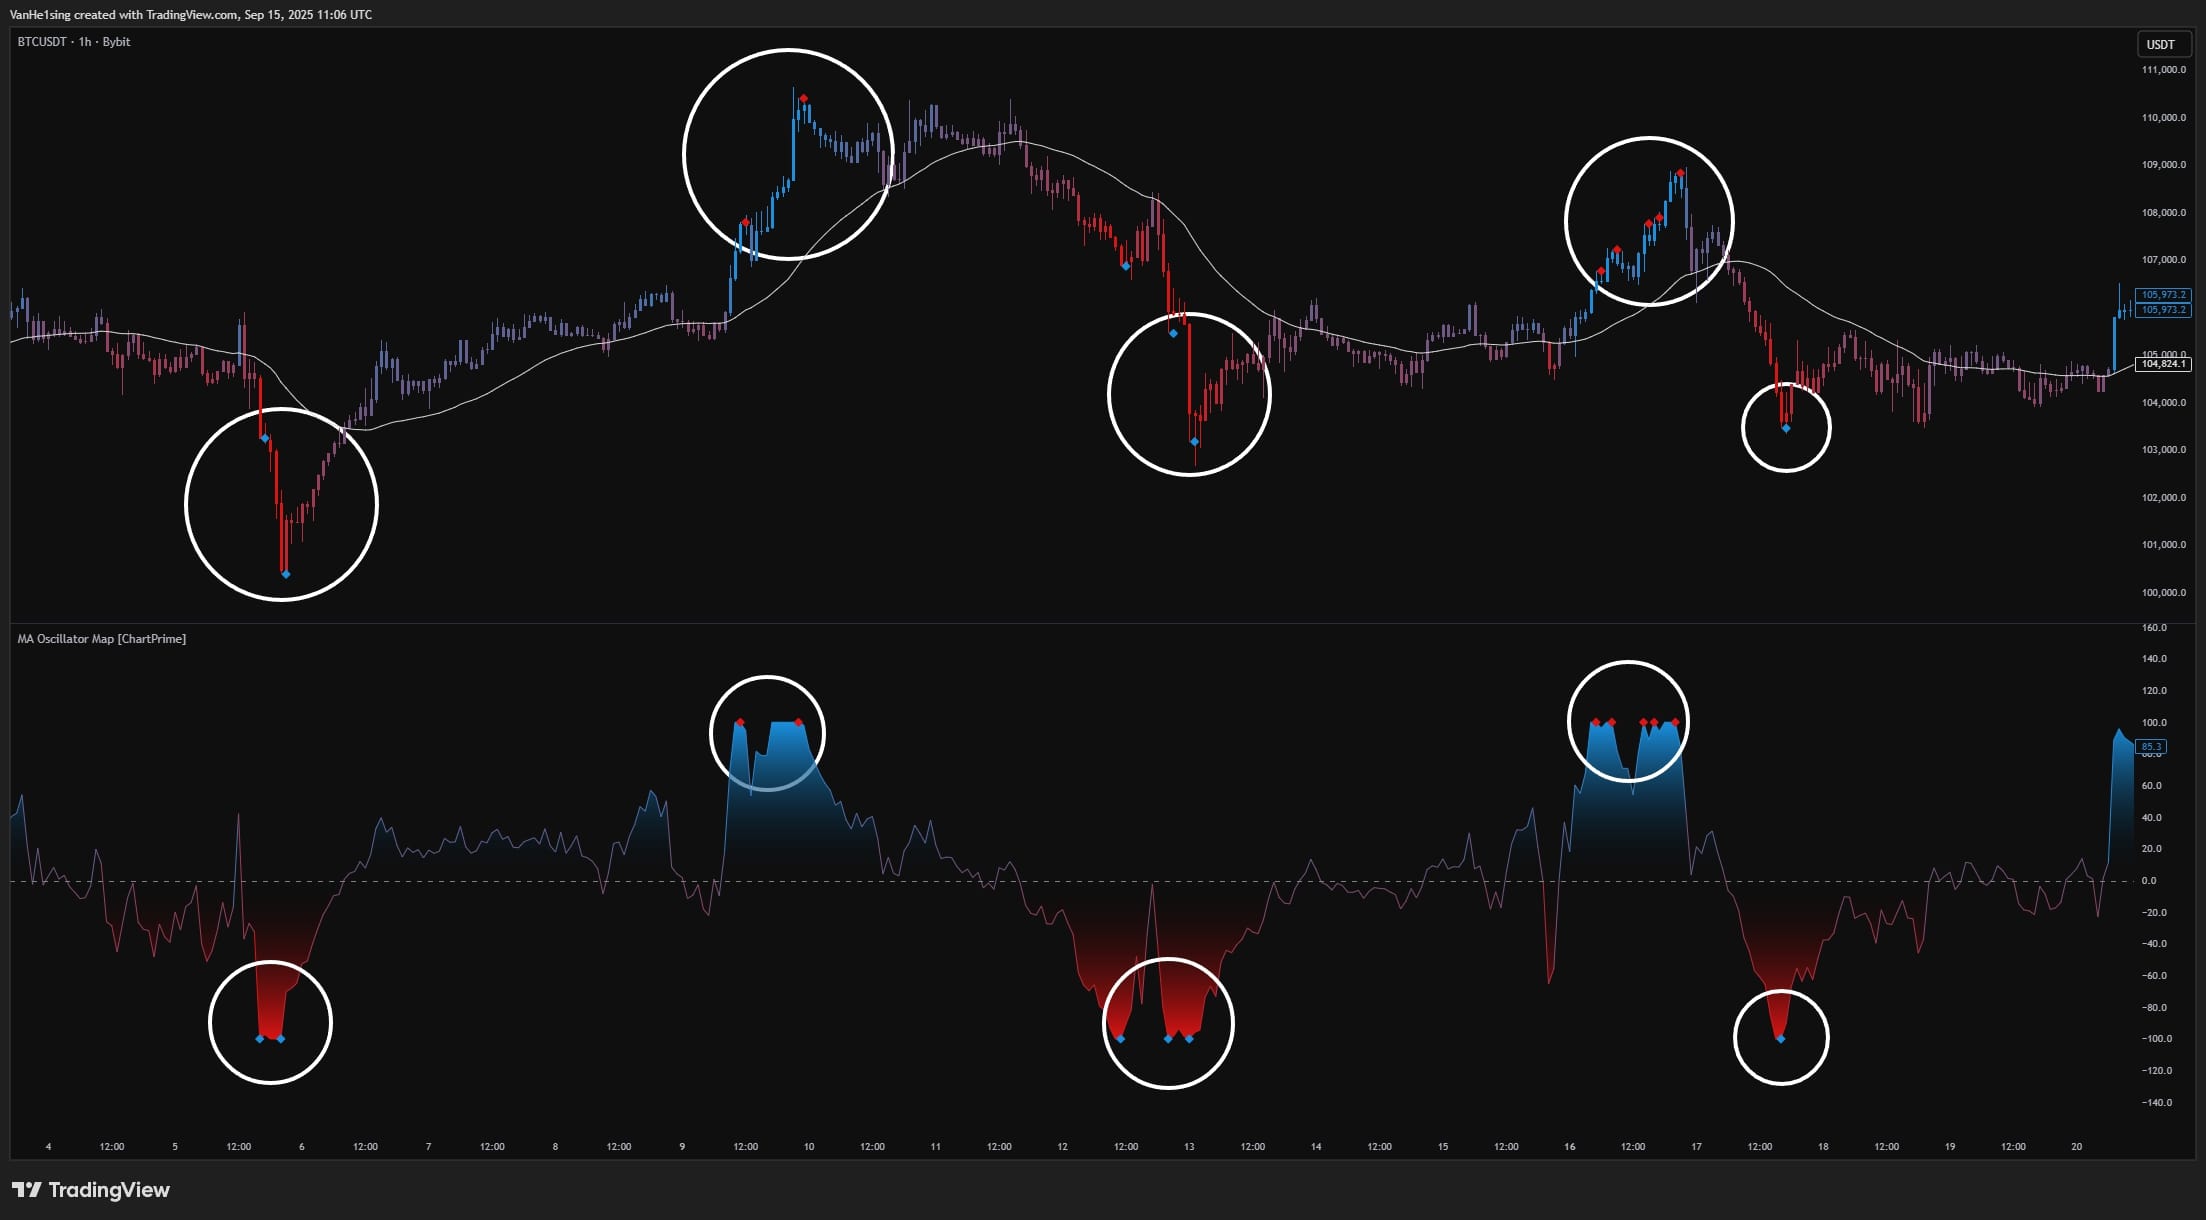
MA Oscillator Map by ChartPrime: price deviation from a moving average normalized to a ±100 scale to spot extremes. How it works.