1. Cup & Handle Indicator Description (Zeiierman)
An indicator that automatically detects the Cup & Handle pattern - one of the most classic chart patterns in technical analysis
1.1 Indicator Concept
The Cup & Handle indicator is based on the theory of market psychology patterns discovered by William O'Neil. This pattern believes that:
- Cup Phase: Represents the process where price gradually declines, forms a bottom, then recovers back to the initial level. This is the market "consolidation" phase after a previous uptrend, where weak sellers exit and strong buyers accumulate.
- Handle Phase: After the cup forms, price has a small pullback creating the handle. This is the final "test" before the breakout.
- Breakout: When price breaks above the cup's rim, this signals a strong uptrend is about to occur, with a price target equal to the cup's depth.
This indicator automatically detects both bullish patterns (Cup & Handle) and bearish patterns (Inverted Cup & Handle) based on price pivot points (swing highs/lows).
1.2 Indicator Features
-
Display Cup & Handle Pattern:
- Cup Curve: Drawn with curved polyline connecting 3 points: left rim → cup bottom → right rim. Green for bullish pattern, red for bearish pattern.
- Handle Curve: Drawn from right rim → handle low → projected breakout point. Same color as cup.
- Filled Area: Light color fill inside cup and handle for easy identification.
- Pattern Label: Displays "Cup+Handle" or "Inv Cup+Handle" text at cup center.
- Target Line: Horizontal line showing price target after breakout, calculated as: Rim Price ± (Cup Depth × Target Multiplier)
-
Alerts:
- "Cup & Handle (Brewed)": Triggers when valid bullish pattern is detected.
- "Inverted Cup & Handle (Brewed)": Triggers when valid bearish pattern is detected.
1.3 How to Use the Indicator
- Identify Entry Opportunities: When the indicator draws a Cup & Handle pattern and price breaks out from the rim (if "Require breakout confirmation" is enabled), this is a signal to enter BUY (bullish pattern) or SELL (bearish pattern).
- Set Take Profit Target: Use the Target Line as the profit-taking level. Default is 0.5× cup depth, adjustable via "Target multiplier".
- Set Stop Loss: Place SL below the "Invalidation" level (default 61.8% of handle depth from rim). If price touches this level, the pattern is invalidated.
- Filter Quality Signals: Adjust parameters like "Rim similarity tolerance", "Handle retrace min/max" to filter more accurate patterns and reduce noise.
- Combine with Larger Timeframes: Cup & Handle pattern works best on H4, Daily, Weekly timeframes. Avoid using on very small timeframes (M1, M5) due to noise.
1.4 How the Indicator Works
Inputs & Roles
- pivotSpan (Integer, default: 10): Number of bars needed to confirm a swing high/low (pivot). For example, pivotSpan=10 means 10 bars on the left and 10 bars on the right must all be lower (for high) or higher (for low) to confirm a pivot. Increase pivotSpan → fewer but stronger pivots, fewer patterns but higher quality. Decrease pivotSpan → more pivots, more signals but more noise.
- rimTolPct (Integer %, default: 18%): Allowed deviation between left rim and right rim of the cup. For example, if left rim is at $100, right rim at $110, deviation = 10%. If rimTolPct=18%, it's accepted; if rimTolPct=5%, it's rejected. Decrease rimTolPct → cup must be more balanced, fewer patterns but more accurate. Increase rimTolPct → accept more unbalanced cups, more patterns.
- hMin (Float, default: 0.12): Minimum depth of handle relative to cup depth. For example, if cup is $100 deep, handle must be at least $12 deep (0.12×100). Too small → handle too shallow, insufficient "test", weak signal.
- hMax (Float, default: 0.55): Maximum depth of handle. For example, if cup is $100 deep, handle cannot be deeper than $55. Too large → handle too deep, messy pattern, no longer a standard Cup & Handle.
- killAtFib (Float, default: 61.8%): Pattern "invalidation" level. If price drops below 61.8% of handle depth (from rim), pattern is broken. This is the safe Stop Loss level. Decrease → tighter SL, less risk but easier to stop out early. Increase → looser SL, accept larger swings.
- needConfirm (Boolean, default: false): Whether to require price breakout past rim. false → early detection as soon as pattern forms. true → only triggers when price has broken past rim, higher quality signal but later.
- targetMult (Float, default: 0.5): Multiplier to calculate price target. For example, cup depth $100, rim at $200, target = 200 + (100×0.5) = $250. Increase → farther target, larger profit but harder to reach. Decrease → closer target, easier to reach but smaller profit.
- showName, bgBull, lnBull, bgBear, lnBear, wOk, stOk, showTarget, targetWidth, targetStyle: Display options (show/hide label, colors, line width, line style). Don't affect detection logic, only visual appearance.
Main Logic Blocks
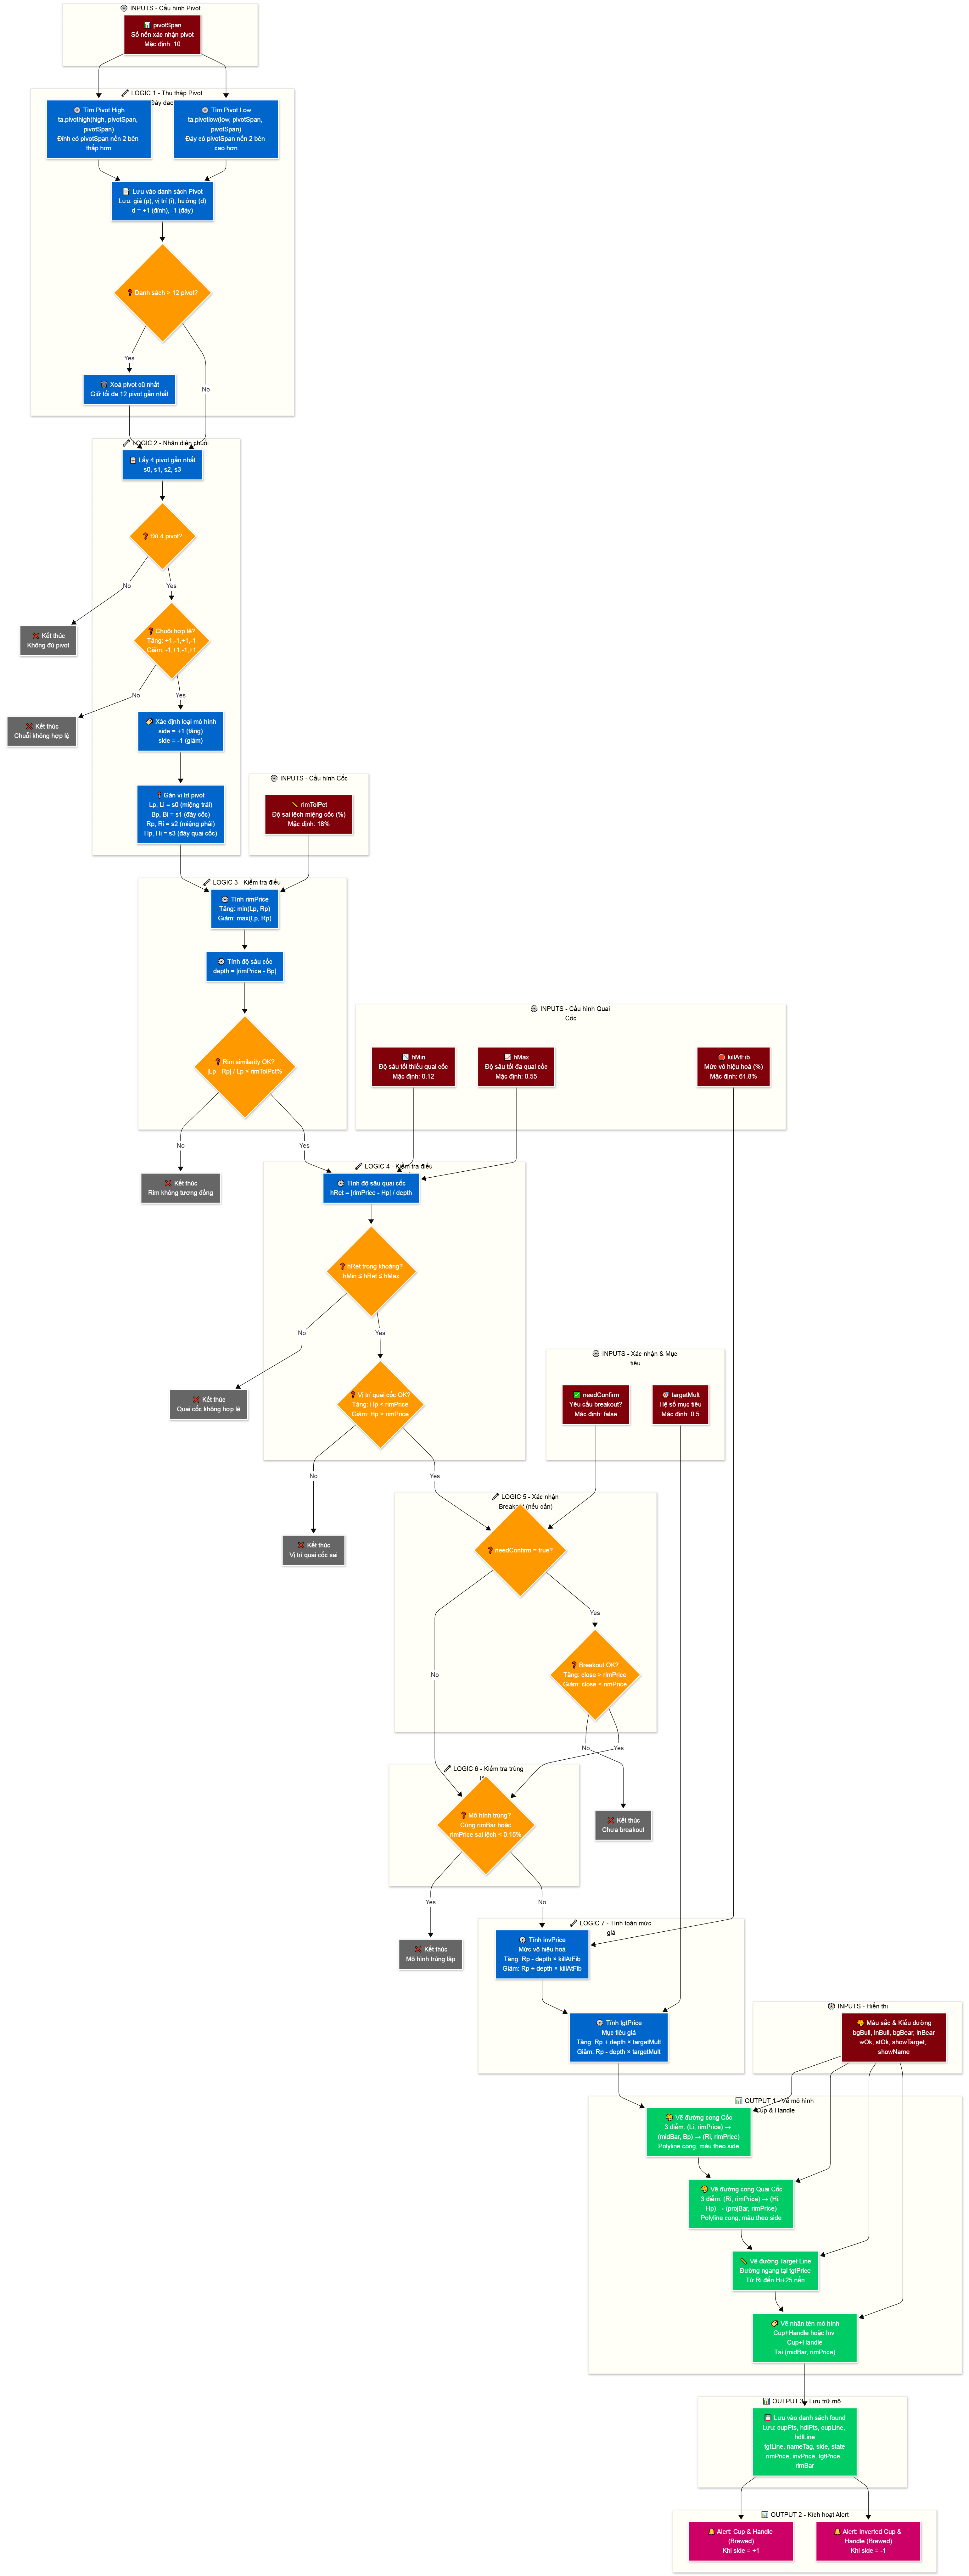
🎯 Flow 1: Cup & Handle Pattern Detection
-
Step 1 - Collect Pivots (Swing Highs/Lows):
- The indicator uses ta.pivothigh() and ta.pivotlow() functions to find swing highs and lows based on pivotSpan.
- Each time a pivot is found, it's saved to a "pivot list" (array) with 3 pieces of information: price (p), bar position (i), direction (d) (+1 = high, -1 = low).
- This list only keeps the most recent 12 pivots (if more than 12, the oldest pivot is deleted).
- Example: If pivotSpan=10, price makes a high at bar 100 with price $50, and 10 bars before + 10 bars after are all below $50, then this pivot is saved: {p: 50, i: 100, d: +1}.
-
Step 2 - Identify Valid 4-Pivot Sequence:
- The indicator takes the 4 most recent pivots from the list: s0, s1, s2, s3.
- Bullish pattern (Cup & Handle): Sequence must be: High → Low → High → Low (s0.d=+1, s1.d=-1, s2.d=+1, s3.d=-1).
- Bearish pattern (Inverted Cup & Handle): Sequence must be: Low → High → Low → High (s0.d=-1, s1.d=+1, s2.d=-1, s3.d=+1).
- Bullish pattern example: s0 = high $100 (left rim), s1 = low $80 (cup bottom), s2 = high $98 (right rim), s3 = low $92 (handle low).
-
Step 3 - Validate Cup Conditions:
- Rim similarity: Compare prices of s0 (left rim) and s2 (right rim). If deviation ≤ rimTolPct%, it's valid.
- Example: s0=$100, s2=$110, deviation = |100-110|/100 = 10%. If rimTolPct=18% → valid. If rimTolPct=5% → rejected.
- Calculate cup depth: depth = |rimPrice - Bp|, where rimPrice = min(s0, s2) for bullish pattern, or max(s0, s2) for bearish pattern.
- Bullish pattern example: s0=$100, s2=$98, s1=$80 → rimPrice=$98 (take lower), depth=|98-80|=$18.
-
Step 4 - Validate Handle Conditions:
- Calculate handle depth (hRet): hRet = |rimPrice - Hp| / depth, where Hp is the price of s3 (handle low).
- Example: rimPrice=$98, Hp=$92, depth=$18 → hRet = |98-92|/18 = 6/18 = 0.33 (33%).
- Check hRet is within [hMin, hMax]: If hMin=0.12, hMax=0.55, then 0.33 is within range → valid.
- Check handle position: For bullish pattern, Hp must be < rimPrice (handle must be below cup rim). For bearish pattern, Hp must be> rimPrice.
-
Step 5 - Check Breakout (if needConfirm enabled):
- If needConfirm=true, indicator only triggers when closing price (close) breaks past rimPrice.
- Bullish pattern: close > rimPrice.
- Bearish pattern: close < rimPrice.
- If needConfirm=false, skip this step, trigger as soon as pattern forms.
-
Step 6 - Remove Duplicates:
- Check if new pattern duplicates a previous pattern (based on rim position and rim price).
- If duplicate (deviation < 0.15%), skip to avoid drawing multiple times.
🎨 Flow 2: Draw Pattern on Chart
-
Draw Cup Curve:
- Create 3 points: point 1 (Li, rimPrice), point 2 (midBar, Bp), point 3 (Ri, rimPrice).
- Use polyline.new() function with curved=true parameter to draw curved line connecting these 3 points.
- Line color and fill color chosen based on bullish/bearish pattern (bgBull/lnBull or bgBear/lnBear).
-
Draw Handle Curve:
- Create 3 points: point 1 (Ri, rimPrice), point 2 (Hi, Hp), point 3 (projBar, rimPrice).
- projBar = Hi + (Hi - Ri), meaning extend handle forward to create complete handle shape.
- Draw similar to cup, using curved polyline.
-
Draw Target Line:
- If showTarget=true, draw horizontal line from Ri to Hi+25 bars, at price level tgtPrice.
- tgtPrice = Rp + (depth × targetMult) for bullish pattern, or Rp - (depth × targetMult) for bearish pattern.
- Example: Rp=$98, depth=$18, targetMult=0.5 → tgtPrice = 98 + (18×0.5) = $107.
-
Draw Pattern Label:
- If showName=true, draw label "Cup+Handle" or "Inv Cup+Handle" at cup center (midBar, rimPrice).
🔔 Flow 3: Trigger Alerts
- When a valid pattern is detected, variable newSignal = true and newSide = +1 (bullish) or -1 (bearish).
- Function alertcondition() checks this condition and triggers corresponding alert.
- Alert "Cup & Handle (Brewed)": Triggers when newSignal=true and newSide=+1.
- Alert "Inverted Cup & Handle (Brewed)": Triggers when newSignal=true and newSide=-1.
Outputs & Usage Roles
- Cup & Handle Curves: Help traders visually identify the pattern on chart, determine accumulation zone and potential breakout point.
- Target Line: Shows price target for profit-taking, based on cup depth theory.
- Invalidation Level (invPrice): Price level where if touched, pattern is broken. Used to set Stop Loss. Example: invPrice = Rp - (depth × 0.618) for bullish pattern.
- Alerts: Timely notifications when pattern appears, helping traders not miss opportunities.




Backtest Results - Cup & Handle Strategy
Performance analysis and optimal settings for the trading strategy
Strategy Development
To find the optimal approach for entry and risk management for this indicator, I converted the indicator into a strategy on TradingView with comprehensive professional capital and risk management features.
Core Strategy Features
🎯 Entry Management
- Enable/Disable Strategy: Toggle strategy execution on/off
- Direction Control: Allow LONG positions, SHORT positions, or both
- Entry Type: Choose between Market orders or Limit orders
- Exit on Opposite Signal: Automatically close positions when an opposite signal appears
💰 Position Sizing Management
- Size Type: Fixed Contracts (fixed number of contracts) or Percentage of Equity (percentage of capital)
- Equity Percentage: Set the percentage of capital to use for each trade
🛡️ Stop Loss Management
- Stop Loss Type: Swing Point (based on swing lookback period)
- Swing Lookback: Number of bars to look back for swing point detection
- Spread Adjustment: Additional buffer distance for stop loss
🎯 Take Profit Management
- Risk:Reward Ratio: Set TP based on SL distance (e.g., RR = 4 means TP is 4x SL)
⚡ Break Even Protection
- BE Activation at RR: Automatically move SL to break even when price reaches a certain RR level
- Offset from Entry: Buffer distance from entry price
📊 Visualization
- Show TP/SL Boxes: Display visual boxes for take profit and stop loss levels
- Custom Colors: Separate colors for TP and SL boxes
- Box Length: Duration of visual boxes in bars
Performance Results
After thorough backtesting, the strategy achieved impressive performance metrics:
Optimal Settings
The following settings proved most effective through backtesting:
Cup & Handle Detection
Strategy Settings
Position Sizing
Stop Loss
Take Profit
Break Even
Visualization
Resources
📚 Tài Nguyên Hữu Ích
Khám phá thêm công cụ và khóa học để nâng cao kỹ năng giao dịch
					// This work is licensed under Creative Commons Attribution-NonCommercial-ShareAlike 4.0 International
// https://creativecommons.org/licenses/by-nc-sa/4.0/
// © Zeiierman {
//@version=6
indicator("Cup & Handle (Zeiierman)", overlay=true, max_lines_count=500, max_labels_count=500, max_polylines_count=100)
//}

// ~~ Tooltips {
var string t1  = "Pivot span:\nControls how many bars are used to confirm swing highs/lows.\nHigher = fewer but stronger pivots.\nLower = more signals but more noise."
var string t2  = "Rim similarity tolerance (%):\nHow close the left rim and right rim must be.\nLower = stricter, cleaner cups.\nHigher = more patterns detected."
var string t3  = "Handle retrace min:\nMinimum depth of the handle pullback relative to cup depth.\nToo small = weak handle.\nTypical: 0.10–0.15."
var string t4  = "Handle retrace max:\nMaximum depth of the handle pullback.\nToo large = messy structure.\nTypical: 0.45–0.60."
var string t5  = "Invalidation (handle max retrace %):\nDefines when the pattern fails.\nLower = tighter stop.\nHigher = looser stop."
var string t6  = "Require breakout confirmation:\nIf enabled, pattern triggers only after price breaks above (bull) or below (bear) the rim.\nOff = earlier detection.\nOn = higher quality confirmation."
var string t7  = "Target multiplier (× cup depth):\nControls how far the projection target is.\n1.0 = classic rim ± depth.\n0.3–0.7 = closer targets."
var string t8  = "Show pattern name:\nDisplays a label on the cup structure."
var string t9  = "Bullish fill:\nBackground fill color for bullish cup & handle."
var string t10 = "Bullish border:\nOutline color for bullish cup & handle."
var string t11 = "Bearish fill:\nBackground fill color for inverted (bearish) cup & handle."
var string t12 = "Bearish border:\nOutline color for inverted (bearish) cup & handle."
var string t13 = "Width:\nLine thickness of the cup and handle curves."
var string t14 = "Style:\nLine style of the cup and handle curves."
var string t15 = "Show target line:\nDraws the projected price target line for the pattern."
var string t16 = "Target width:\nThickness of the target projection line."
var string t17 = "Target style:\nLine style of the target projection line."
//~~~~~~~~~~~~~~~~~~~~~~~~~~~~~~~~~~~~~~~~~~~~~~~~~~~~~~~~~~~~~~~~~~~~~~~~~~~~~~}

// ~~ Settings {
pivotSpan    = input.int(10, "Pivot span", minval=2, step=1, group="Cup & Handle", tooltip=t1)
rimTolPct    = input.int(18, "Rim similarity tolerance (%)", minval=0, maxval=50, step=1, group="Cup & Handle", tooltip=t2)
hMin         = input.float(0.12, "Handle retrace min", minval=0.01, step=0.01, group="Cup & Handle", tooltip=t3)
hMax         = input.float(0.55, "Handle retrace max", minval=0.05, step=0.01, group="Cup & Handle", tooltip=t4)
killAtFib    = input.float(61.8, "Invalidation (handle max retrace %) ", minval=10, maxval=100, step=0.1, group="Cup & Handle", tooltip=t5) / 100.0
needConfirm  = input.bool(false, "Require breakout confirmation", group="Cup & Handle", tooltip=t6)
targetMult   = input.float(0.5, "Target multiplier (× cup depth)", minval=0.1, maxval=3.0, step=0.05, group="Cup & Handle", tooltip=t7)

showName     = input.bool(true, "Show pattern name", group="Style", tooltip=t8)

bgBull       = input.color(color.new(color.lime, 82), "Bullish fill", group="Style", inline="bull", tooltip=t9)
lnBull       = input.color(color.new(color.lime, 35), "Bullish border", group="Style", inline="bull", tooltip=t10)

bgBear       = input.color(color.new(color.red, 82), "Bearish fill", group="Style", inline="bear", tooltip=t11)
lnBear       = input.color(color.new(color.red, 35), "Bearish border", group="Style", inline="bear", tooltip=t12)

wOk          = input.int(2, "Width", minval=1, group="Style", inline="w1", tooltip=t13)
stOk         = input.string("Solid", "Style", options=["Solid","Dashed","Dotted"], group="Style", inline="w1", tooltip=t14)

showTarget   = input.bool(true, "Show target line", group="Style", tooltip=t15)
targetWidth  = input.int(2, "Target width", minval=1, group="Style", inline="t1", tooltip=t16)
targetStyle  = input.string("Dashed", "Target style", options=["Solid","Dashed","Dotted"], group="Style", inline="t1", tooltip=t17)
//~~~~~~~~~~~~~~~~~~~~~~~~~~~~~~~~~~~~~~~~~~~~~~~~~~~~~~~~~~~~~~~~~~~~~~~~~~~~~~}

// ~~ Helpers {
f_lineStyle(string s) =>
    switch s
        "Solid"  => line.style_solid
        "Dashed" => line.style_dashed
        "Dotted" => line.style_dotted
        => line.style_solid

f_near(float a, float b, float tolPct) =>
    a == 0 or b == 0 ? false : math.abs(a - b) / math.abs(a) <= tolPct / 100.0

f_depth(float rim, float bowl) =>
    math.abs(rim - bowl)
//~~~~~~~~~~~~~~~~~~~~~~~~~~~~~~~~~~~~~~~~~~~~~~~~~~~~~~~~~~~~~~~~~~~~~~~~~~~~~~}

// ~~  Pivot stream {
type Swing
    float p
    int   i
    int   d   // +1 = high pivot, -1 = low pivot

var Swing[] swings = array.new<Swing>()

f_pushSwing(float price, int idx, int dir) =>
    if array.size(swings) == 0
        array.push(swings, Swing.new(price, idx, dir))
    else
        last = array.get(swings, array.size(swings) - 1)
        if last.d == dir
            better = dir == 1 ? price > last.p : price < last.p
            if better
                array.set(swings, array.size(swings) - 1, Swing.new(price, idx, dir))
        else
            array.push(swings, Swing.new(price, idx, dir))
    if array.size(swings) > 12
        array.shift(swings)

ph = ta.pivothigh(high, pivotSpan, pivotSpan)
pl = ta.pivotlow(low, pivotSpan, pivotSpan)

if not na(ph)
    f_pushSwing(ph, bar_index - pivotSpan, +1)
if not na(pl)
    f_pushSwing(pl, bar_index - pivotSpan, -1)
//~~~~~~~~~~~~~~~~~~~~~~~~~~~~~~~~~~~~~~~~~~~~~~~~~~~~~~~~~~~~~~~~~~~~~~~~~~~~~~}

// ~~  Pattern record + storage {
type BrewPattern
    chart.point[] cupPts
    chart.point[] hdlPts
    polyline cupLine
    polyline hdlLine
    line tgtLine
    label nameTag
    int   side
    int   state      // 1 active, -1 invalid, 2 target hit
    float rimPrice
    float invPrice
    float tgtPrice
    int   rimBar

var BrewPattern[] found = array.new<BrewPattern>()

f_kill(BrewPattern pat) =>
    polyline.delete(pat.cupLine)
    polyline.delete(pat.hdlLine)
    if not na(pat.tgtLine)
        line.delete(pat.tgtLine)
    if not na(pat.nameTag)
        label.delete(pat.nameTag)

f_isDuplicate(int rimIdx, float rimPx) =>
    if array.size(found) == 0
        false
    else
        last = array.get(found, array.size(found) - 1)
        rimIdx == last.rimBar or f_near(rimPx, last.rimPrice, 0.15)
//~~~~~~~~~~~~~~~~~~~~~~~~~~~~~~~~~~~~~~~~~~~~~~~~~~~~~~~~~~~~~~~~~~~~~~~~~~~~~~}

// ~~  Detection {
Swing s0 = na
Swing s1 = na
Swing s2 = na
Swing s3 = na

int n = array.size(swings)
if n >= 4
    s0 := array.get(swings, n - 4)
    s1 := array.get(swings, n - 3)
    s2 := array.get(swings, n - 2)
    s3 := array.get(swings, n - 1)

bool newSignal = false
int  newSide   = 0

if not na(s0) and not na(s1) and not na(s2) and not na(s3)
    isSeqNorm = (s0.d == +1 and s1.d == -1 and s2.d == +1 and s3.d == -1)
    isSeqInv  = (s0.d == -1 and s1.d == +1 and s2.d == -1 and s3.d == +1)

    if isSeqNorm or isSeqInv
        side = isSeqNorm ? +1 : -1

        Lp = s0.p, Li = s0.i
        Bp = s1.p, Bi = s1.i
        Rp = s2.p, Ri = s2.i
        Hp = s3.p, Hi = s3.i

        useFill = side == +1 ? bgBull : bgBear
        useLine = side == +1 ? lnBull : lnBear

        rimPrice = side == +1 ? math.min(Lp, Rp) : math.max(Lp, Rp)
        depth    = f_depth(rimPrice, Bp)
        rimOk    = f_near(Lp, Rp, rimTolPct)
        hRet     = depth == 0 ? 10.0 : math.abs(rimPrice - Hp) / depth
        handleOk = (hRet >= hMin and hRet <= hMax)
        sideOk   = side == +1 ? Hp < rimPrice : Hp > rimPrice
        invPrice = side == +1 ? (Rp - depth * killAtFib) : (Rp + depth * killAtFib)
        tgtPrice  = side == +1 ? (Rp + depth * targetMult) : (Rp - depth * targetMult)
        confirmOk = not needConfirm ? true : (side == +1 ? close > rimPrice : close < rimPrice)
        ok        = rimOk and handleOk and sideOk and confirmOk

        if ok and not f_isDuplicate(Li, rimPrice)
            midBar = Ri - (Ri - Li) / 2

            cupPts = array.new<chart.point>()
            array.push(cupPts, chart.point.from_index(Li, rimPrice))
            array.push(cupPts, chart.point.from_index(midBar, Bp))
            array.push(cupPts, chart.point.from_index(Ri, rimPrice))

            hdlPts = array.new<chart.point>()
            projBar = Hi + (Hi - Ri)
            array.push(hdlPts, chart.point.from_index(Ri, rimPrice))
            array.push(hdlPts, chart.point.from_index(Hi, Hp))
            array.push(hdlPts, chart.point.from_index(projBar, rimPrice))

            cupPL = polyline.new(cupPts, line_color=useLine, fill_color=useFill, line_width=wOk, line_style=f_lineStyle(stOk), curved=true)
            hdlPL = polyline.new(hdlPts, line_color=useLine, fill_color=useFill, line_width=wOk, line_style=f_lineStyle(stOk), curved=true)

            // target line
            extendBars = 25
            line tgtLn = na
            if showTarget
                tgtCol = side == +1 ? color.new(color.lime, 0) : color.new(color.red, 0)
                tgtLn := line.new(Ri, tgtPrice, Hi + extendBars, tgtPrice, color=tgtCol, width=targetWidth, style=f_lineStyle(targetStyle))

            label tag = na
            if showName
                txt = side == +1 ? "Cup+Handle" : "Inv Cup+Handle"
                tagCol = side == +1 ? color.new(color.lime, 70) : color.new(color.red, 70)
                tag := label.new(midBar, rimPrice, txt, style=label.style_label_center, textcolor=color.white, color=tagCol, size=size.small)

            rec = BrewPattern.new(
                 cupPts, hdlPts,
                 cupPL, hdlPL,
                 tgtLn,
                 tag,
                 side, 1,
                 rimPrice, invPrice, tgtPrice,
                 Li
            )
            array.push(found, rec)

            newSignal := true
            newSide   := side

if array.size(found) > 0
    last = array.get(found, array.size(found)-1)

    if last.state == 1
        invHit = (last.side == +1 and low <= last.invPrice) or
                 (last.side == -1 and high >= last.invPrice)
//~~~~~~~~~~~~~~~~~~~~~~~~~~~~~~~~~~~~~~~~~~~~~~~~~~~~~~~~~~~~~~~~~~~~~~~~~~~~~~}

// ~~  Alerts {
alertcondition(newSignal and newSide == +1, title="Cup & Handle (Brewed)", message="Cup & Handle detected on {{ticker}}")
alertcondition(newSignal and newSide == -1, title="Inverted Cup & Handle (Brewed)", message="Inverted Cup & Handle detected on {{ticker}}")
//~~~~~~~~~~~~~~~~~~~~~~~~~~~~~~~~~~~~~~~~~~~~~~~~~~~~~~~~~~~~~~~~~~~~~~~~~~~~~~}
Indicator Insider
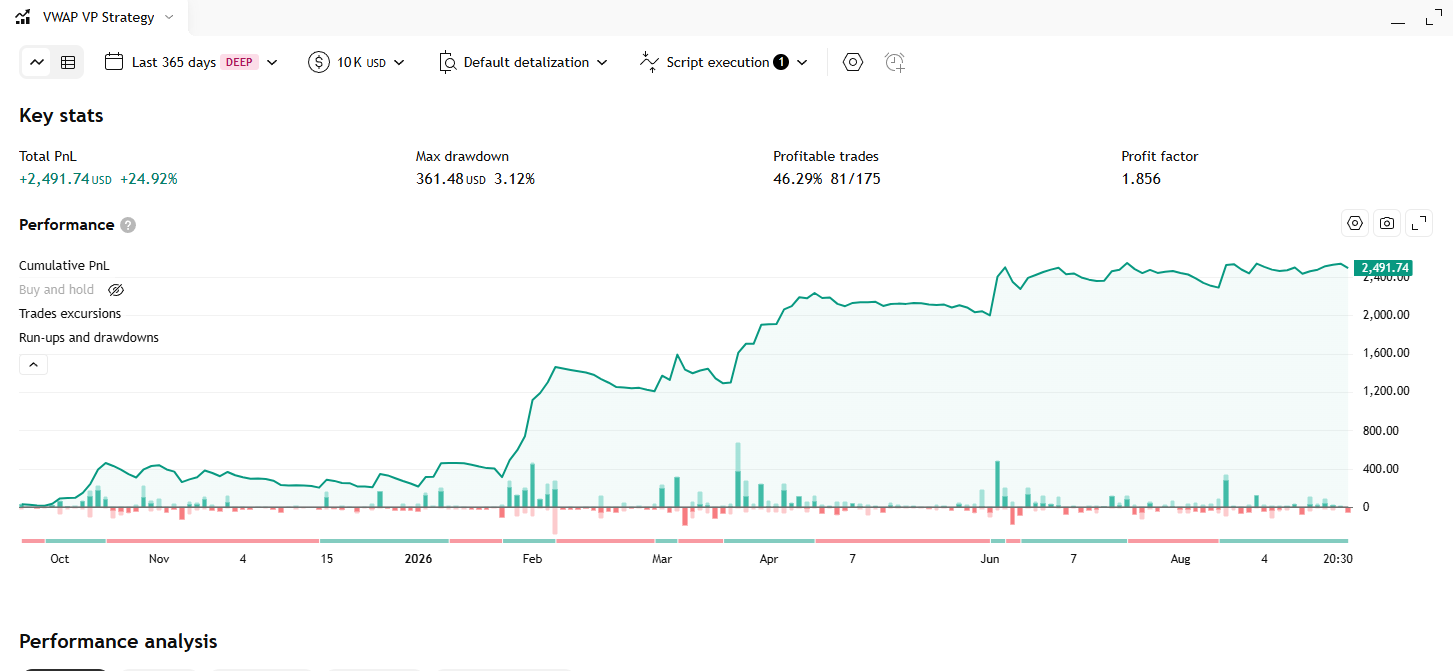
VWAP Volume Profile Indicator – Strategy
Một hồ sơ khối lượng hai chiều dựng trên đường VWAP thay vì trên giá: khối lượng của mỗi nến được gắn dấu cộng hoặc trừ tuỳ VWAP đang lên hay xuống, rồi gom lại thành biểu đồ cột nằm ngang chìa ra cả hai phía ở mép phải chart.
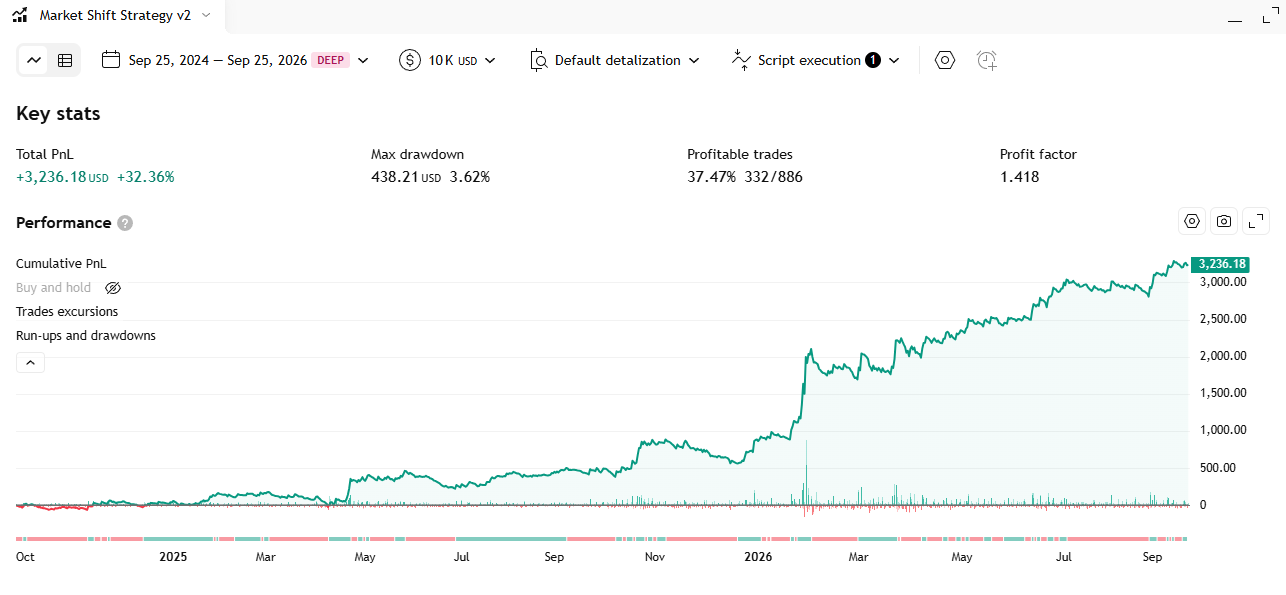
Market Shift Levels Indicator – Strategy
Every time the HMA moving average flips its slope, the indicator locks in the high or the low of that exact candle as a “boundary level”, colors every candle relative to it, and flags the moments price pokes through the level and immediately fails.
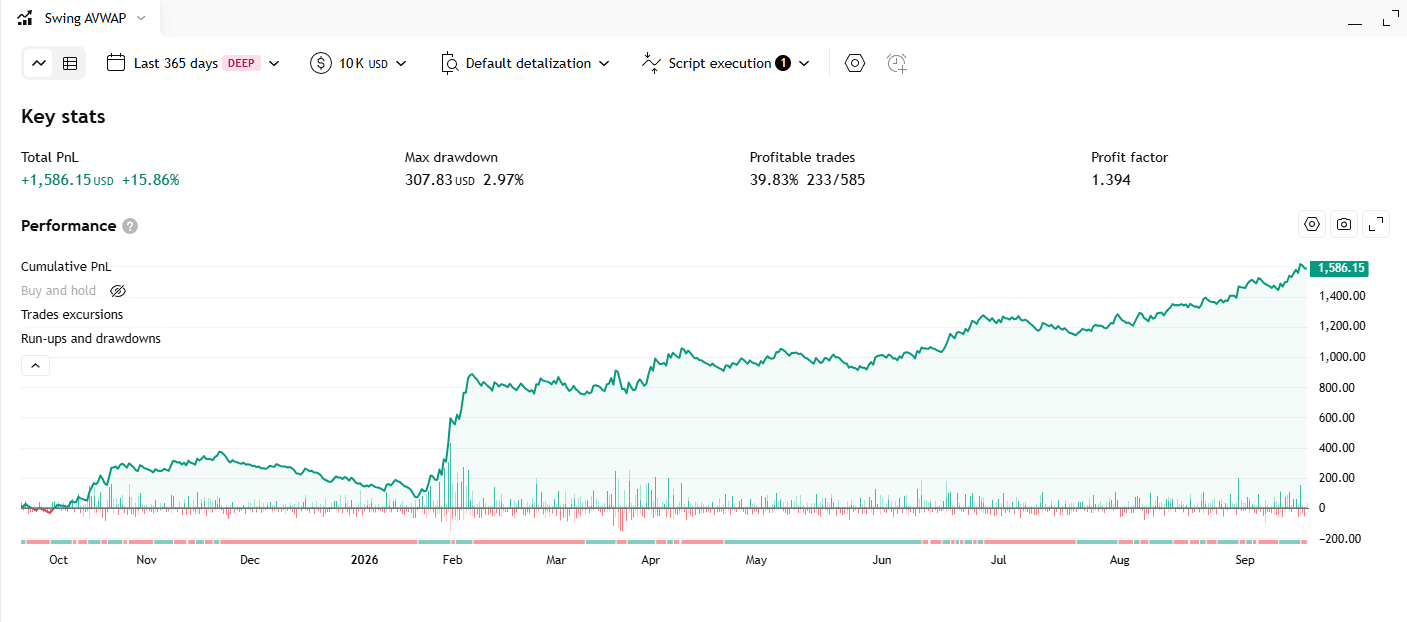
Dynamic Swing Anchored VWAP Indicator – Strategy
Automatically anchors a VWAP line to the most recent swing reversal point, rebuilds the whole line from that anchor every time market structure flips, and tags each anchor with an HH / HL / LH / LL structure label.