1. Cup & Handle Indicator Description (Zeiierman)
An indicator that automatically detects the Cup & Handle pattern - one of the most classic chart patterns in technical analysis
1.1 Indicator Concept
The Cup & Handle indicator is based on the theory of market psychology patterns discovered by William O'Neil. This pattern believes that:
- Cup Phase: Represents the process where price gradually declines, forms a bottom, then recovers back to the initial level. This is the market "consolidation" phase after a previous uptrend, where weak sellers exit and strong buyers accumulate.
- Handle Phase: After the cup forms, price has a small pullback creating the handle. This is the final "test" before the breakout.
- Breakout: When price breaks above the cup's rim, this signals a strong uptrend is about to occur, with a price target equal to the cup's depth.
This indicator automatically detects both bullish patterns (Cup & Handle) and bearish patterns (Inverted Cup & Handle) based on price pivot points (swing highs/lows).
1.2 Indicator Features
-
Display Cup & Handle Pattern:
- Cup Curve: Drawn with curved polyline connecting 3 points: left rim → cup bottom → right rim. Green for bullish pattern, red for bearish pattern.
- Handle Curve: Drawn from right rim → handle low → projected breakout point. Same color as cup.
- Filled Area: Light color fill inside cup and handle for easy identification.
- Pattern Label: Displays "Cup+Handle" or "Inv Cup+Handle" text at cup center.
- Target Line: Horizontal line showing price target after breakout, calculated as: Rim Price ± (Cup Depth × Target Multiplier)
-
Alerts:
- "Cup & Handle (Brewed)": Triggers when valid bullish pattern is detected.
- "Inverted Cup & Handle (Brewed)": Triggers when valid bearish pattern is detected.
1.3 How to Use the Indicator
- Identify Entry Opportunities: When the indicator draws a Cup & Handle pattern and price breaks out from the rim (if "Require breakout confirmation" is enabled), this is a signal to enter BUY (bullish pattern) or SELL (bearish pattern).
- Set Take Profit Target: Use the Target Line as the profit-taking level. Default is 0.5× cup depth, adjustable via "Target multiplier".
- Set Stop Loss: Place SL below the "Invalidation" level (default 61.8% of handle depth from rim). If price touches this level, the pattern is invalidated.
- Filter Quality Signals: Adjust parameters like "Rim similarity tolerance", "Handle retrace min/max" to filter more accurate patterns and reduce noise.
- Combine with Larger Timeframes: Cup & Handle pattern works best on H4, Daily, Weekly timeframes. Avoid using on very small timeframes (M1, M5) due to noise.
1.4 How the Indicator Works
Inputs & Roles
- pivotSpan (Integer, default: 10): Number of bars needed to confirm a swing high/low (pivot). For example, pivotSpan=10 means 10 bars on the left and 10 bars on the right must all be lower (for high) or higher (for low) to confirm a pivot. Increase pivotSpan → fewer but stronger pivots, fewer patterns but higher quality. Decrease pivotSpan → more pivots, more signals but more noise.
- rimTolPct (Integer %, default: 18%): Allowed deviation between left rim and right rim of the cup. For example, if left rim is at $100, right rim at $110, deviation = 10%. If rimTolPct=18%, it's accepted; if rimTolPct=5%, it's rejected. Decrease rimTolPct → cup must be more balanced, fewer patterns but more accurate. Increase rimTolPct → accept more unbalanced cups, more patterns.
- hMin (Float, default: 0.12): Minimum depth of handle relative to cup depth. For example, if cup is $100 deep, handle must be at least $12 deep (0.12×100). Too small → handle too shallow, insufficient "test", weak signal.
- hMax (Float, default: 0.55): Maximum depth of handle. For example, if cup is $100 deep, handle cannot be deeper than $55. Too large → handle too deep, messy pattern, no longer a standard Cup & Handle.
- killAtFib (Float, default: 61.8%): Pattern "invalidation" level. If price drops below 61.8% of handle depth (from rim), pattern is broken. This is the safe Stop Loss level. Decrease → tighter SL, less risk but easier to stop out early. Increase → looser SL, accept larger swings.
- needConfirm (Boolean, default: false): Whether to require price breakout past rim. false → early detection as soon as pattern forms. true → only triggers when price has broken past rim, higher quality signal but later.
- targetMult (Float, default: 0.5): Multiplier to calculate price target. For example, cup depth $100, rim at $200, target = 200 + (100×0.5) = $250. Increase → farther target, larger profit but harder to reach. Decrease → closer target, easier to reach but smaller profit.
- showName, bgBull, lnBull, bgBear, lnBear, wOk, stOk, showTarget, targetWidth, targetStyle: Display options (show/hide label, colors, line width, line style). Don't affect detection logic, only visual appearance.
Main Logic Blocks
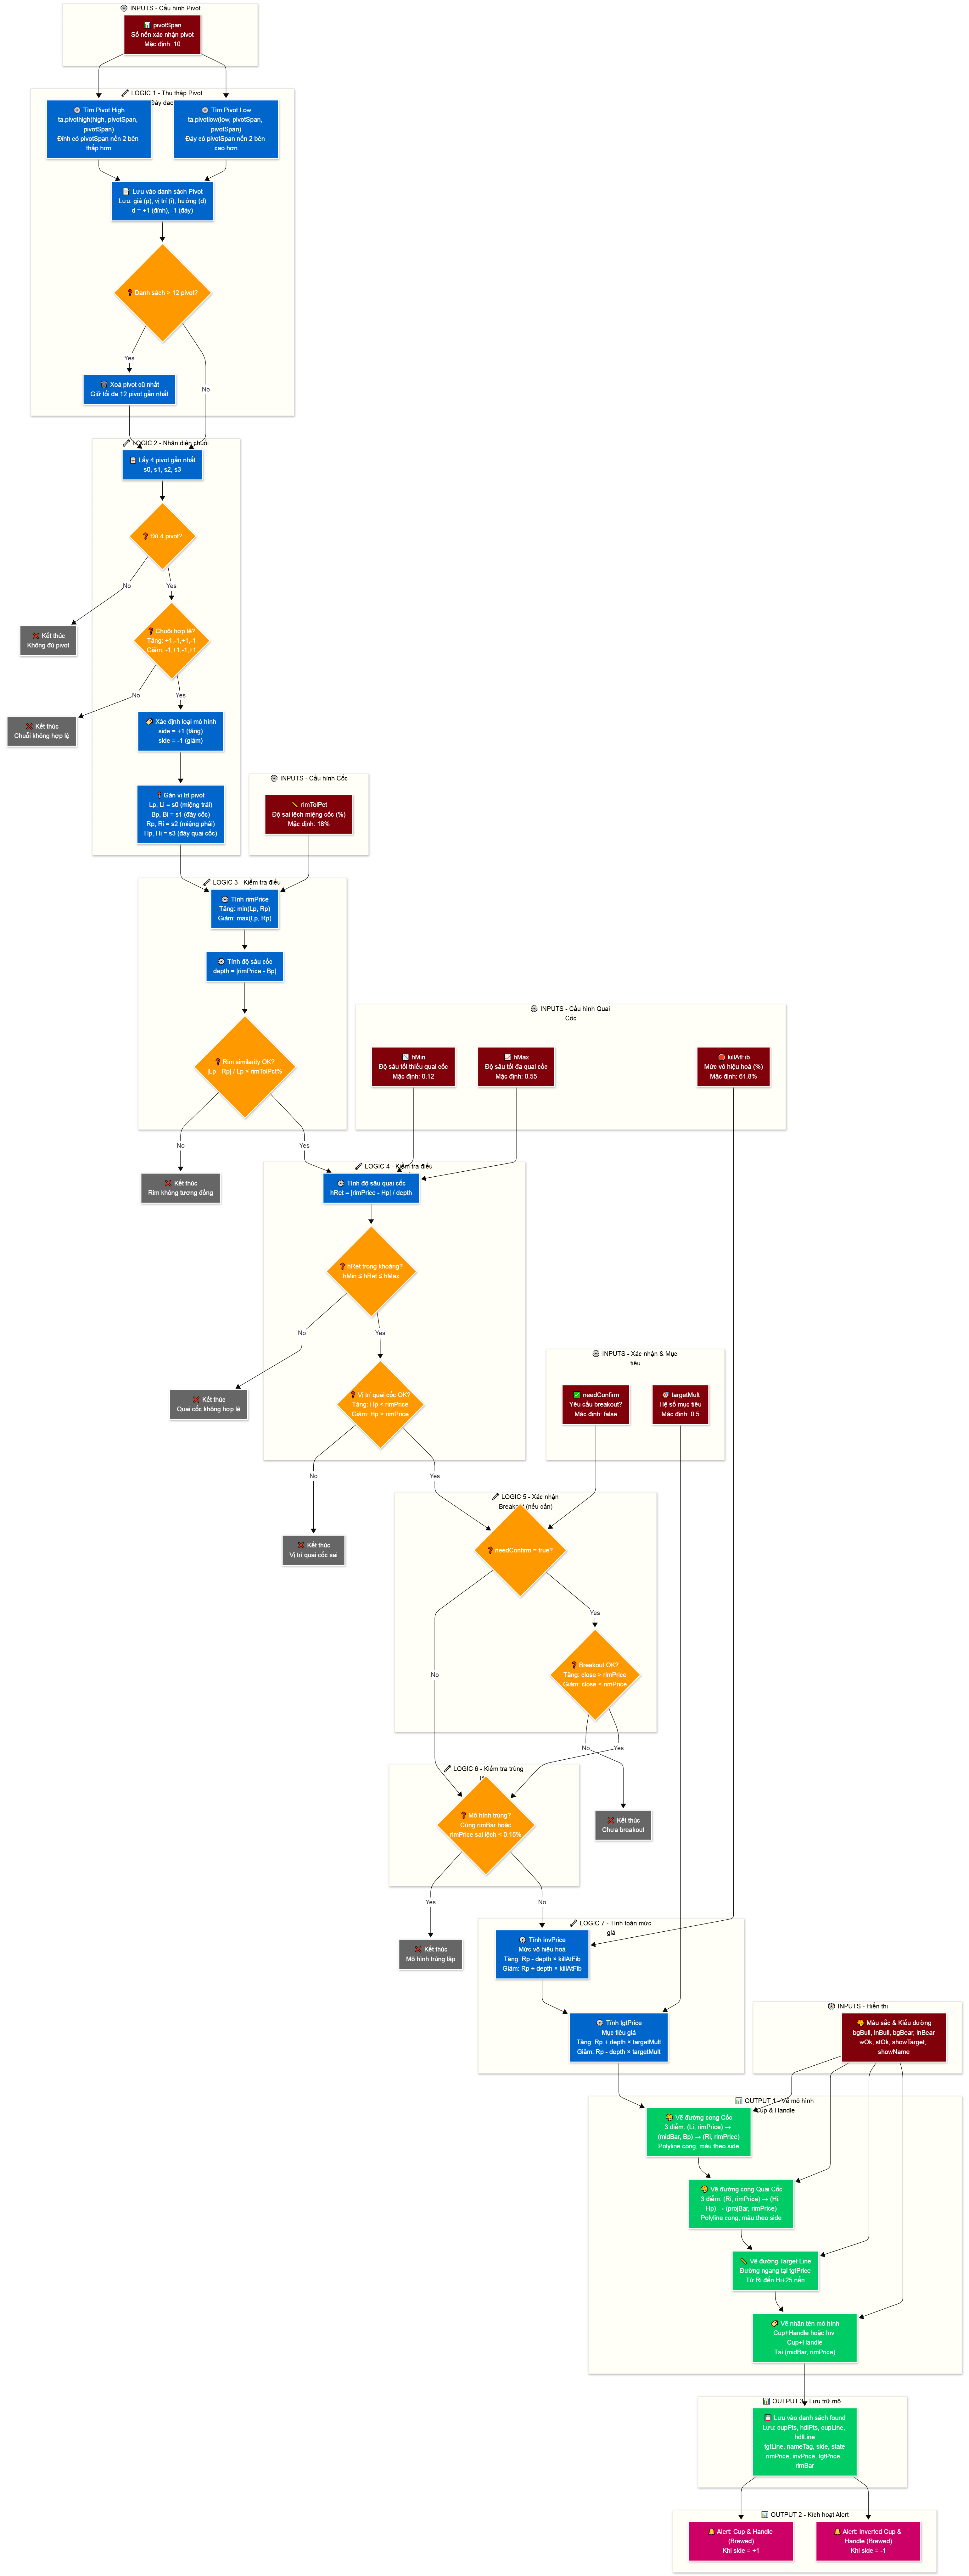
🎯 Flow 1: Cup & Handle Pattern Detection
-
Step 1 - Collect Pivots (Swing Highs/Lows):
- The indicator uses ta.pivothigh() and ta.pivotlow() functions to find swing highs and lows based on pivotSpan.
- Each time a pivot is found, it's saved to a "pivot list" (array) with 3 pieces of information: price (p), bar position (i), direction (d) (+1 = high, -1 = low).
- This list only keeps the most recent 12 pivots (if more than 12, the oldest pivot is deleted).
- Example: If pivotSpan=10, price makes a high at bar 100 with price $50, and 10 bars before + 10 bars after are all below $50, then this pivot is saved: {p: 50, i: 100, d: +1}.
-
Step 2 - Identify Valid 4-Pivot Sequence:
- The indicator takes the 4 most recent pivots from the list: s0, s1, s2, s3.
- Bullish pattern (Cup & Handle): Sequence must be: High → Low → High → Low (s0.d=+1, s1.d=-1, s2.d=+1, s3.d=-1).
- Bearish pattern (Inverted Cup & Handle): Sequence must be: Low → High → Low → High (s0.d=-1, s1.d=+1, s2.d=-1, s3.d=+1).
- Bullish pattern example: s0 = high $100 (left rim), s1 = low $80 (cup bottom), s2 = high $98 (right rim), s3 = low $92 (handle low).
-
Step 3 - Validate Cup Conditions:
- Rim similarity: Compare prices of s0 (left rim) and s2 (right rim). If deviation ≤ rimTolPct%, it's valid.
- Example: s0=$100, s2=$110, deviation = |100-110|/100 = 10%. If rimTolPct=18% → valid. If rimTolPct=5% → rejected.
- Calculate cup depth: depth = |rimPrice - Bp|, where rimPrice = min(s0, s2) for bullish pattern, or max(s0, s2) for bearish pattern.
- Bullish pattern example: s0=$100, s2=$98, s1=$80 → rimPrice=$98 (take lower), depth=|98-80|=$18.
-
Step 4 - Validate Handle Conditions:
- Calculate handle depth (hRet): hRet = |rimPrice - Hp| / depth, where Hp is the price of s3 (handle low).
- Example: rimPrice=$98, Hp=$92, depth=$18 → hRet = |98-92|/18 = 6/18 = 0.33 (33%).
- Check hRet is within [hMin, hMax]: If hMin=0.12, hMax=0.55, then 0.33 is within range → valid.
- Check handle position: For bullish pattern, Hp must be < rimPrice (handle must be below cup rim). For bearish pattern, Hp must be> rimPrice.
-
Step 5 - Check Breakout (if needConfirm enabled):
- If needConfirm=true, indicator only triggers when closing price (close) breaks past rimPrice.
- Bullish pattern: close > rimPrice.
- Bearish pattern: close < rimPrice.
- If needConfirm=false, skip this step, trigger as soon as pattern forms.
-
Step 6 - Remove Duplicates:
- Check if new pattern duplicates a previous pattern (based on rim position and rim price).
- If duplicate (deviation < 0.15%), skip to avoid drawing multiple times.
🎨 Flow 2: Draw Pattern on Chart
-
Draw Cup Curve:
- Create 3 points: point 1 (Li, rimPrice), point 2 (midBar, Bp), point 3 (Ri, rimPrice).
- Use polyline.new() function with curved=true parameter to draw curved line connecting these 3 points.
- Line color and fill color chosen based on bullish/bearish pattern (bgBull/lnBull or bgBear/lnBear).
-
Draw Handle Curve:
- Create 3 points: point 1 (Ri, rimPrice), point 2 (Hi, Hp), point 3 (projBar, rimPrice).
- projBar = Hi + (Hi - Ri), meaning extend handle forward to create complete handle shape.
- Draw similar to cup, using curved polyline.
-
Draw Target Line:
- If showTarget=true, draw horizontal line from Ri to Hi+25 bars, at price level tgtPrice.
- tgtPrice = Rp + (depth × targetMult) for bullish pattern, or Rp - (depth × targetMult) for bearish pattern.
- Example: Rp=$98, depth=$18, targetMult=0.5 → tgtPrice = 98 + (18×0.5) = $107.
-
Draw Pattern Label:
- If showName=true, draw label "Cup+Handle" or "Inv Cup+Handle" at cup center (midBar, rimPrice).
🔔 Flow 3: Trigger Alerts
- When a valid pattern is detected, variable newSignal = true and newSide = +1 (bullish) or -1 (bearish).
- Function alertcondition() checks this condition and triggers corresponding alert.
- Alert "Cup & Handle (Brewed)": Triggers when newSignal=true and newSide=+1.
- Alert "Inverted Cup & Handle (Brewed)": Triggers when newSignal=true and newSide=-1.
Outputs & Usage Roles
- Cup & Handle Curves: Help traders visually identify the pattern on chart, determine accumulation zone and potential breakout point.
- Target Line: Shows price target for profit-taking, based on cup depth theory.
- Invalidation Level (invPrice): Price level where if touched, pattern is broken. Used to set Stop Loss. Example: invPrice = Rp - (depth × 0.618) for bullish pattern.
- Alerts: Timely notifications when pattern appears, helping traders not miss opportunities.




Backtest Results - Cup & Handle Strategy
Performance analysis and optimal settings for the trading strategy
Strategy Development
To find the optimal approach for entry and risk management for this indicator, I converted the indicator into a strategy on TradingView with comprehensive professional capital and risk management features.
Core Strategy Features
🎯 Entry Management
- Enable/Disable Strategy: Toggle strategy execution on/off
- Direction Control: Allow LONG positions, SHORT positions, or both
- Entry Type: Choose between Market orders or Limit orders
- Exit on Opposite Signal: Automatically close positions when an opposite signal appears
💰 Position Sizing Management
- Size Type: Fixed Contracts (fixed number of contracts) or Percentage of Equity (percentage of capital)
- Equity Percentage: Set the percentage of capital to use for each trade
🛡️ Stop Loss Management
- Stop Loss Type: Swing Point (based on swing lookback period)
- Swing Lookback: Number of bars to look back for swing point detection
- Spread Adjustment: Additional buffer distance for stop loss
🎯 Take Profit Management
- Risk:Reward Ratio: Set TP based on SL distance (e.g., RR = 4 means TP is 4x SL)
⚡ Break Even Protection
- BE Activation at RR: Automatically move SL to break even when price reaches a certain RR level
- Offset from Entry: Buffer distance from entry price
📊 Visualization
- Show TP/SL Boxes: Display visual boxes for take profit and stop loss levels
- Custom Colors: Separate colors for TP and SL boxes
- Box Length: Duration of visual boxes in bars
Performance Results
After thorough backtesting, the strategy achieved impressive performance metrics:
Optimal Settings
The following settings proved most effective through backtesting:
Cup & Handle Detection
Strategy Settings
Position Sizing
Stop Loss
Take Profit
Break Even
Visualization
Resources
📚 Tài Nguyên Hữu Ích
Khám phá thêm công cụ và khóa học để nâng cao kỹ năng giao dịch
					// This work is licensed under Creative Commons Attribution-NonCommercial-ShareAlike 4.0 International
// https://creativecommons.org/licenses/by-nc-sa/4.0/
// © Zeiierman {
//@version=6
indicator("Cup & Handle (Zeiierman)", overlay=true, max_lines_count=500, max_labels_count=500, max_polylines_count=100)
//}

// ~~ Tooltips {
var string t1  = "Pivot span:\nControls how many bars are used to confirm swing highs/lows.\nHigher = fewer but stronger pivots.\nLower = more signals but more noise."
var string t2  = "Rim similarity tolerance (%):\nHow close the left rim and right rim must be.\nLower = stricter, cleaner cups.\nHigher = more patterns detected."
var string t3  = "Handle retrace min:\nMinimum depth of the handle pullback relative to cup depth.\nToo small = weak handle.\nTypical: 0.10–0.15."
var string t4  = "Handle retrace max:\nMaximum depth of the handle pullback.\nToo large = messy structure.\nTypical: 0.45–0.60."
var string t5  = "Invalidation (handle max retrace %):\nDefines when the pattern fails.\nLower = tighter stop.\nHigher = looser stop."
var string t6  = "Require breakout confirmation:\nIf enabled, pattern triggers only after price breaks above (bull) or below (bear) the rim.\nOff = earlier detection.\nOn = higher quality confirmation."
var string t7  = "Target multiplier (× cup depth):\nControls how far the projection target is.\n1.0 = classic rim ± depth.\n0.3–0.7 = closer targets."
var string t8  = "Show pattern name:\nDisplays a label on the cup structure."
var string t9  = "Bullish fill:\nBackground fill color for bullish cup & handle."
var string t10 = "Bullish border:\nOutline color for bullish cup & handle."
var string t11 = "Bearish fill:\nBackground fill color for inverted (bearish) cup & handle."
var string t12 = "Bearish border:\nOutline color for inverted (bearish) cup & handle."
var string t13 = "Width:\nLine thickness of the cup and handle curves."
var string t14 = "Style:\nLine style of the cup and handle curves."
var string t15 = "Show target line:\nDraws the projected price target line for the pattern."
var string t16 = "Target width:\nThickness of the target projection line."
var string t17 = "Target style:\nLine style of the target projection line."
//~~~~~~~~~~~~~~~~~~~~~~~~~~~~~~~~~~~~~~~~~~~~~~~~~~~~~~~~~~~~~~~~~~~~~~~~~~~~~~}

// ~~ Settings {
pivotSpan    = input.int(10, "Pivot span", minval=2, step=1, group="Cup & Handle", tooltip=t1)
rimTolPct    = input.int(18, "Rim similarity tolerance (%)", minval=0, maxval=50, step=1, group="Cup & Handle", tooltip=t2)
hMin         = input.float(0.12, "Handle retrace min", minval=0.01, step=0.01, group="Cup & Handle", tooltip=t3)
hMax         = input.float(0.55, "Handle retrace max", minval=0.05, step=0.01, group="Cup & Handle", tooltip=t4)
killAtFib    = input.float(61.8, "Invalidation (handle max retrace %) ", minval=10, maxval=100, step=0.1, group="Cup & Handle", tooltip=t5) / 100.0
needConfirm  = input.bool(false, "Require breakout confirmation", group="Cup & Handle", tooltip=t6)
targetMult   = input.float(0.5, "Target multiplier (× cup depth)", minval=0.1, maxval=3.0, step=0.05, group="Cup & Handle", tooltip=t7)

showName     = input.bool(true, "Show pattern name", group="Style", tooltip=t8)

bgBull       = input.color(color.new(color.lime, 82), "Bullish fill", group="Style", inline="bull", tooltip=t9)
lnBull       = input.color(color.new(color.lime, 35), "Bullish border", group="Style", inline="bull", tooltip=t10)

bgBear       = input.color(color.new(color.red, 82), "Bearish fill", group="Style", inline="bear", tooltip=t11)
lnBear       = input.color(color.new(color.red, 35), "Bearish border", group="Style", inline="bear", tooltip=t12)

wOk          = input.int(2, "Width", minval=1, group="Style", inline="w1", tooltip=t13)
stOk         = input.string("Solid", "Style", options=["Solid","Dashed","Dotted"], group="Style", inline="w1", tooltip=t14)

showTarget   = input.bool(true, "Show target line", group="Style", tooltip=t15)
targetWidth  = input.int(2, "Target width", minval=1, group="Style", inline="t1", tooltip=t16)
targetStyle  = input.string("Dashed", "Target style", options=["Solid","Dashed","Dotted"], group="Style", inline="t1", tooltip=t17)
//~~~~~~~~~~~~~~~~~~~~~~~~~~~~~~~~~~~~~~~~~~~~~~~~~~~~~~~~~~~~~~~~~~~~~~~~~~~~~~}

// ~~ Helpers {
f_lineStyle(string s) =>
    switch s
        "Solid"  => line.style_solid
        "Dashed" => line.style_dashed
        "Dotted" => line.style_dotted
        => line.style_solid

f_near(float a, float b, float tolPct) =>
    a == 0 or b == 0 ? false : math.abs(a - b) / math.abs(a) <= tolPct / 100.0

f_depth(float rim, float bowl) =>
    math.abs(rim - bowl)
//~~~~~~~~~~~~~~~~~~~~~~~~~~~~~~~~~~~~~~~~~~~~~~~~~~~~~~~~~~~~~~~~~~~~~~~~~~~~~~}

// ~~  Pivot stream {
type Swing
    float p
    int   i
    int   d   // +1 = high pivot, -1 = low pivot

var Swing[] swings = array.new<Swing>()

f_pushSwing(float price, int idx, int dir) =>
    if array.size(swings) == 0
        array.push(swings, Swing.new(price, idx, dir))
    else
        last = array.get(swings, array.size(swings) - 1)
        if last.d == dir
            better = dir == 1 ? price > last.p : price < last.p
            if better
                array.set(swings, array.size(swings) - 1, Swing.new(price, idx, dir))
        else
            array.push(swings, Swing.new(price, idx, dir))
    if array.size(swings) > 12
        array.shift(swings)

ph = ta.pivothigh(high, pivotSpan, pivotSpan)
pl = ta.pivotlow(low, pivotSpan, pivotSpan)

if not na(ph)
    f_pushSwing(ph, bar_index - pivotSpan, +1)
if not na(pl)
    f_pushSwing(pl, bar_index - pivotSpan, -1)
//~~~~~~~~~~~~~~~~~~~~~~~~~~~~~~~~~~~~~~~~~~~~~~~~~~~~~~~~~~~~~~~~~~~~~~~~~~~~~~}

// ~~  Pattern record + storage {
type BrewPattern
    chart.point[] cupPts
    chart.point[] hdlPts
    polyline cupLine
    polyline hdlLine
    line tgtLine
    label nameTag
    int   side
    int   state      // 1 active, -1 invalid, 2 target hit
    float rimPrice
    float invPrice
    float tgtPrice
    int   rimBar

var BrewPattern[] found = array.new<BrewPattern>()

f_kill(BrewPattern pat) =>
    polyline.delete(pat.cupLine)
    polyline.delete(pat.hdlLine)
    if not na(pat.tgtLine)
        line.delete(pat.tgtLine)
    if not na(pat.nameTag)
        label.delete(pat.nameTag)

f_isDuplicate(int rimIdx, float rimPx) =>
    if array.size(found) == 0
        false
    else
        last = array.get(found, array.size(found) - 1)
        rimIdx == last.rimBar or f_near(rimPx, last.rimPrice, 0.15)
//~~~~~~~~~~~~~~~~~~~~~~~~~~~~~~~~~~~~~~~~~~~~~~~~~~~~~~~~~~~~~~~~~~~~~~~~~~~~~~}

// ~~  Detection {
Swing s0 = na
Swing s1 = na
Swing s2 = na
Swing s3 = na

int n = array.size(swings)
if n >= 4
    s0 := array.get(swings, n - 4)
    s1 := array.get(swings, n - 3)
    s2 := array.get(swings, n - 2)
    s3 := array.get(swings, n - 1)

bool newSignal = false
int  newSide   = 0

if not na(s0) and not na(s1) and not na(s2) and not na(s3)
    isSeqNorm = (s0.d == +1 and s1.d == -1 and s2.d == +1 and s3.d == -1)
    isSeqInv  = (s0.d == -1 and s1.d == +1 and s2.d == -1 and s3.d == +1)

    if isSeqNorm or isSeqInv
        side = isSeqNorm ? +1 : -1

        Lp = s0.p, Li = s0.i
        Bp = s1.p, Bi = s1.i
        Rp = s2.p, Ri = s2.i
        Hp = s3.p, Hi = s3.i

        useFill = side == +1 ? bgBull : bgBear
        useLine = side == +1 ? lnBull : lnBear

        rimPrice = side == +1 ? math.min(Lp, Rp) : math.max(Lp, Rp)
        depth    = f_depth(rimPrice, Bp)
        rimOk    = f_near(Lp, Rp, rimTolPct)
        hRet     = depth == 0 ? 10.0 : math.abs(rimPrice - Hp) / depth
        handleOk = (hRet >= hMin and hRet <= hMax)
        sideOk   = side == +1 ? Hp < rimPrice : Hp > rimPrice
        invPrice = side == +1 ? (Rp - depth * killAtFib) : (Rp + depth * killAtFib)
        tgtPrice  = side == +1 ? (Rp + depth * targetMult) : (Rp - depth * targetMult)
        confirmOk = not needConfirm ? true : (side == +1 ? close > rimPrice : close < rimPrice)
        ok        = rimOk and handleOk and sideOk and confirmOk

        if ok and not f_isDuplicate(Li, rimPrice)
            midBar = Ri - (Ri - Li) / 2

            cupPts = array.new<chart.point>()
            array.push(cupPts, chart.point.from_index(Li, rimPrice))
            array.push(cupPts, chart.point.from_index(midBar, Bp))
            array.push(cupPts, chart.point.from_index(Ri, rimPrice))

            hdlPts = array.new<chart.point>()
            projBar = Hi + (Hi - Ri)
            array.push(hdlPts, chart.point.from_index(Ri, rimPrice))
            array.push(hdlPts, chart.point.from_index(Hi, Hp))
            array.push(hdlPts, chart.point.from_index(projBar, rimPrice))

            cupPL = polyline.new(cupPts, line_color=useLine, fill_color=useFill, line_width=wOk, line_style=f_lineStyle(stOk), curved=true)
            hdlPL = polyline.new(hdlPts, line_color=useLine, fill_color=useFill, line_width=wOk, line_style=f_lineStyle(stOk), curved=true)

            // target line
            extendBars = 25
            line tgtLn = na
            if showTarget
                tgtCol = side == +1 ? color.new(color.lime, 0) : color.new(color.red, 0)
                tgtLn := line.new(Ri, tgtPrice, Hi + extendBars, tgtPrice, color=tgtCol, width=targetWidth, style=f_lineStyle(targetStyle))

            label tag = na
            if showName
                txt = side == +1 ? "Cup+Handle" : "Inv Cup+Handle"
                tagCol = side == +1 ? color.new(color.lime, 70) : color.new(color.red, 70)
                tag := label.new(midBar, rimPrice, txt, style=label.style_label_center, textcolor=color.white, color=tagCol, size=size.small)

            rec = BrewPattern.new(
                 cupPts, hdlPts,
                 cupPL, hdlPL,
                 tgtLn,
                 tag,
                 side, 1,
                 rimPrice, invPrice, tgtPrice,
                 Li
            )
            array.push(found, rec)

            newSignal := true
            newSide   := side

if array.size(found) > 0
    last = array.get(found, array.size(found)-1)

    if last.state == 1
        invHit = (last.side == +1 and low <= last.invPrice) or
                 (last.side == -1 and high >= last.invPrice)
//~~~~~~~~~~~~~~~~~~~~~~~~~~~~~~~~~~~~~~~~~~~~~~~~~~~~~~~~~~~~~~~~~~~~~~~~~~~~~~}

// ~~  Alerts {
alertcondition(newSignal and newSide == +1, title="Cup & Handle (Brewed)", message="Cup & Handle detected on {{ticker}}")
alertcondition(newSignal and newSide == -1, title="Inverted Cup & Handle (Brewed)", message="Inverted Cup & Handle detected on {{ticker}}")
//~~~~~~~~~~~~~~~~~~~~~~~~~~~~~~~~~~~~~~~~~~~~~~~~~~~~~~~~~~~~~~~~~~~~~~~~~~~~~~}
Indicator Insider
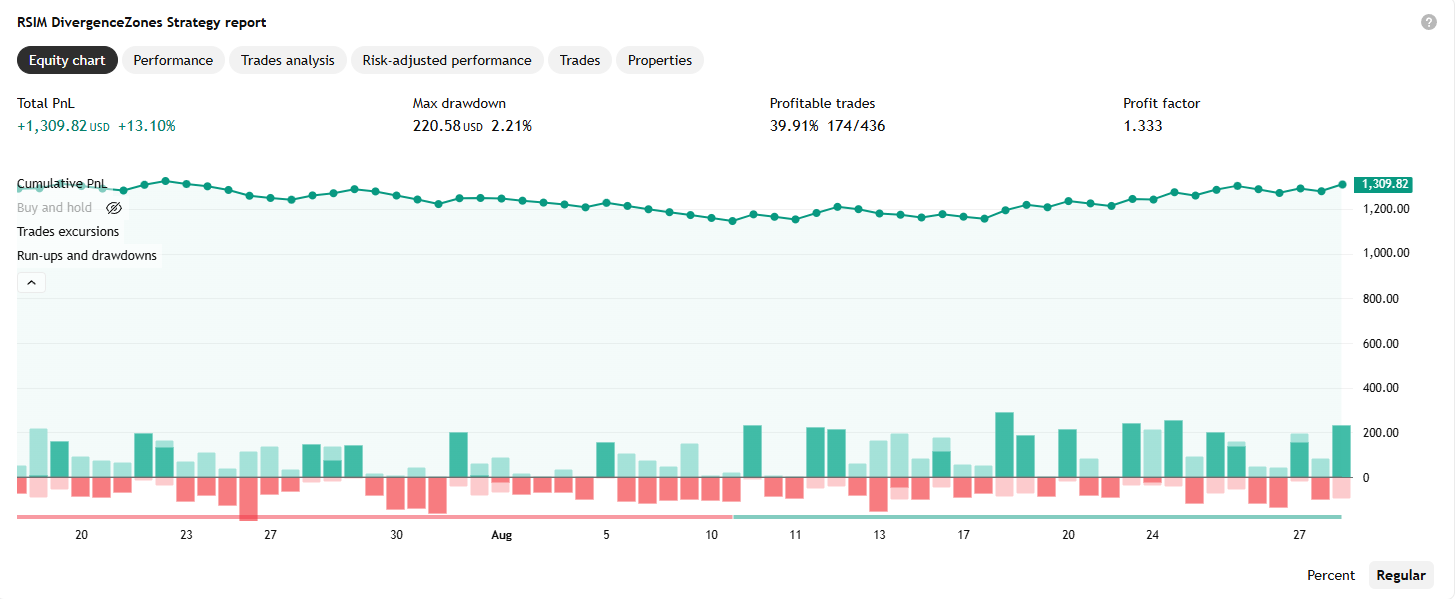
RSI Momentum Divergence Zones Indicator – Strategy
Finds divergences between price and an unusual RSI (an RSI computed on price momentum rather than on price itself), then turns every divergence into a horizontal price zone that stays alive until it is broken.
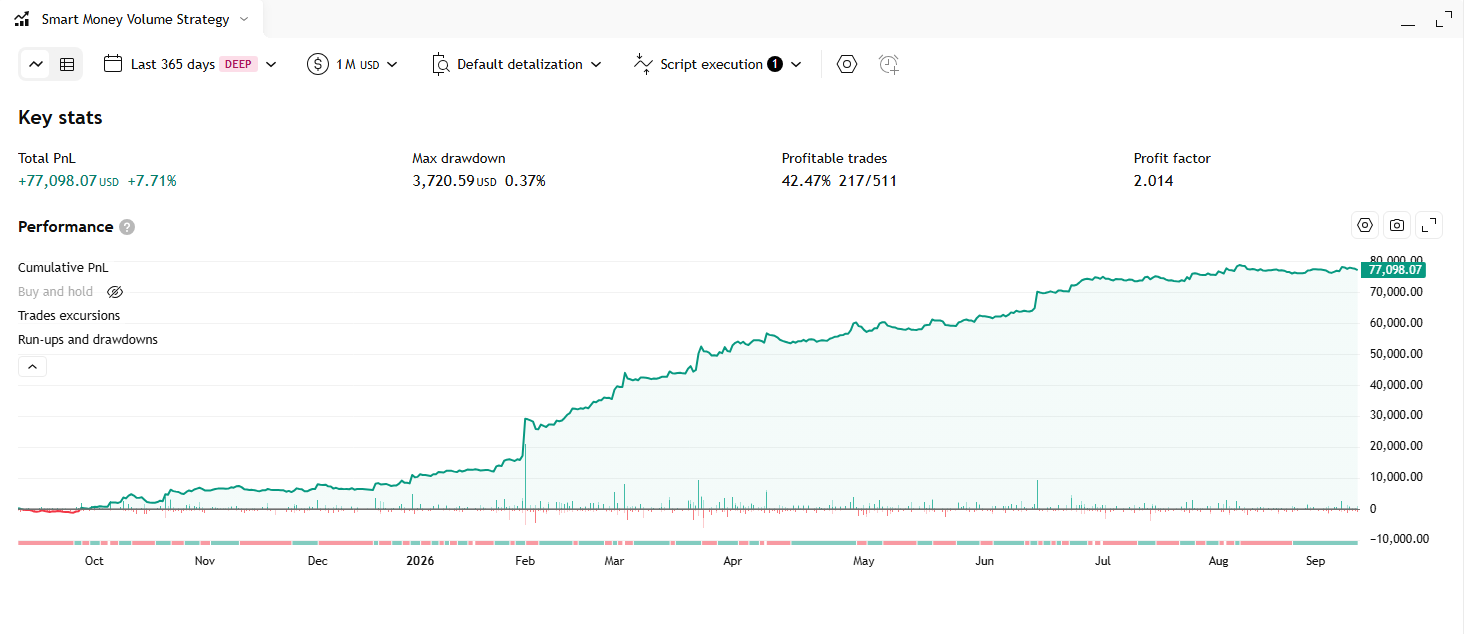
Smart Money Volume Activity Indicator – Strategy
An indicator that decomposes each chart candle into lower-timeframe volume, flags statistically abnormal volume spikes, and classifies each spike as a “Smart Money” or “Retail” footprint
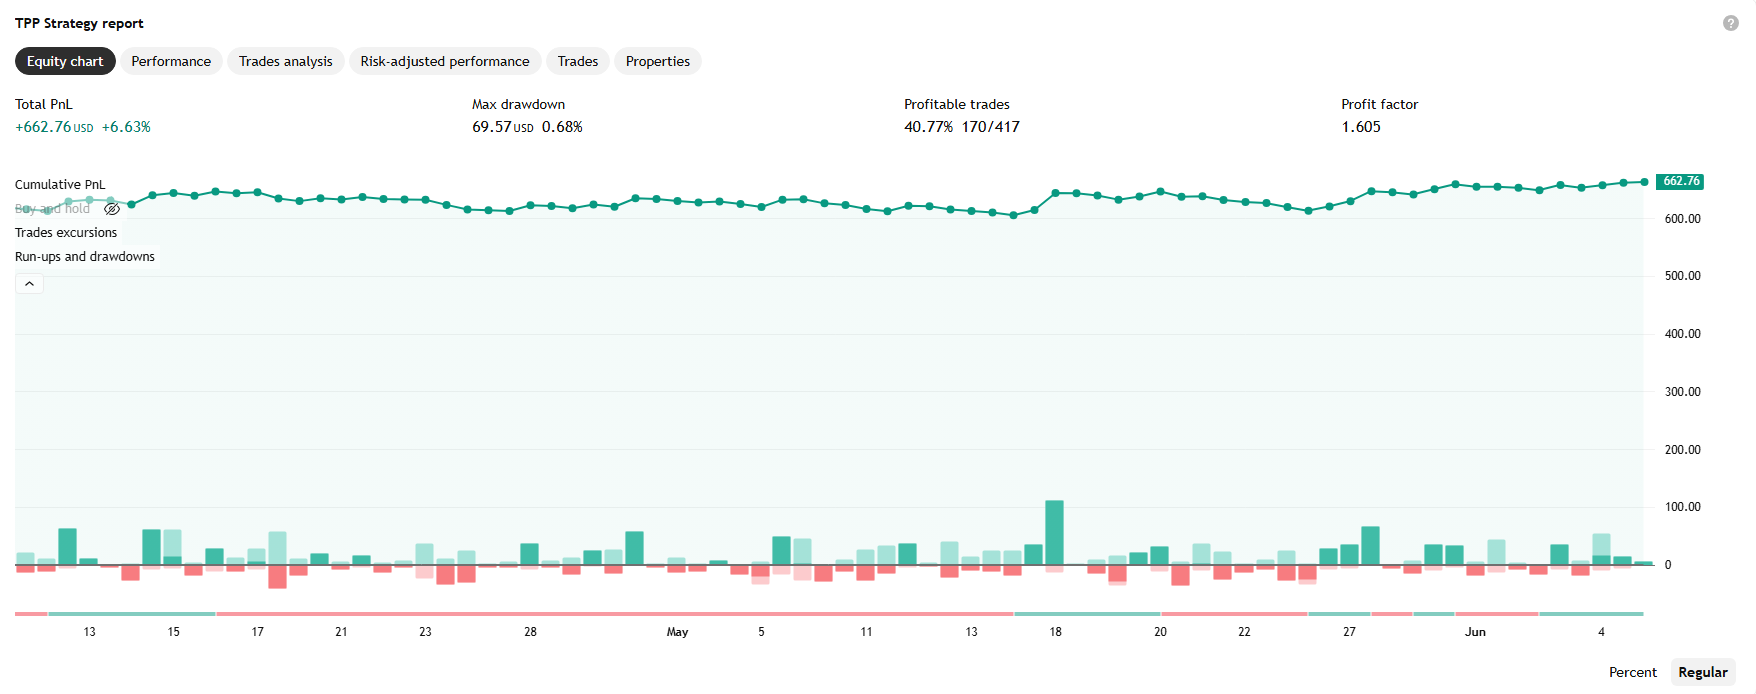
Trend Pivots Profile Indicator – Strategy
Draws a separate volume profile for each swing between two pivot reversal points, using intrabar volume pulled from a lower timeframe, plus a Donchian-channel-style trend line.