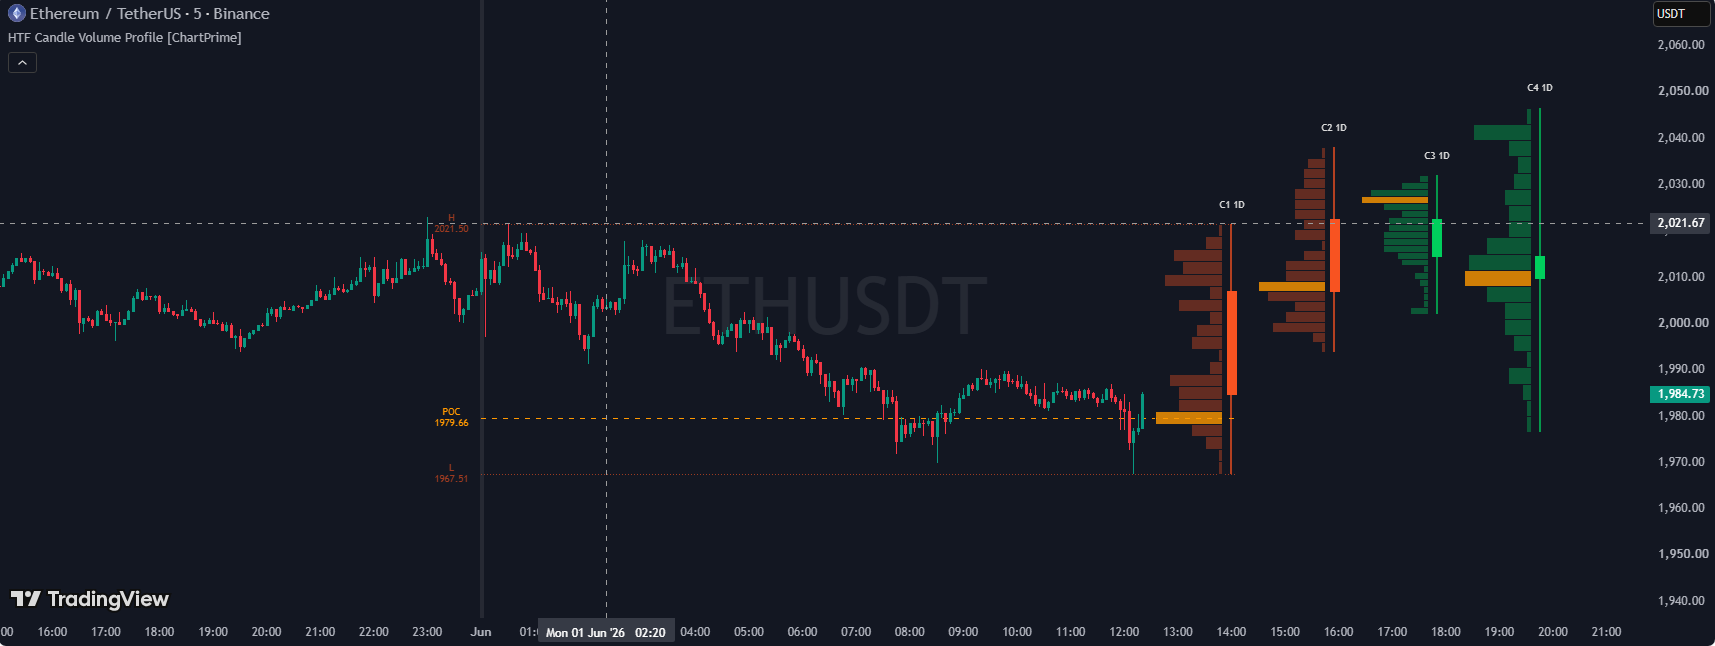
HTF Candle Volume Profile Indicator – High Timeframe Volume Profile Strategy
HTF Candle Volume Profile indicator for TradingView: how it works, settings, signals and strategy logic.
HTF Candle Volume Profile indicator for TradingView: how it works, settings, signals and strategy logic.
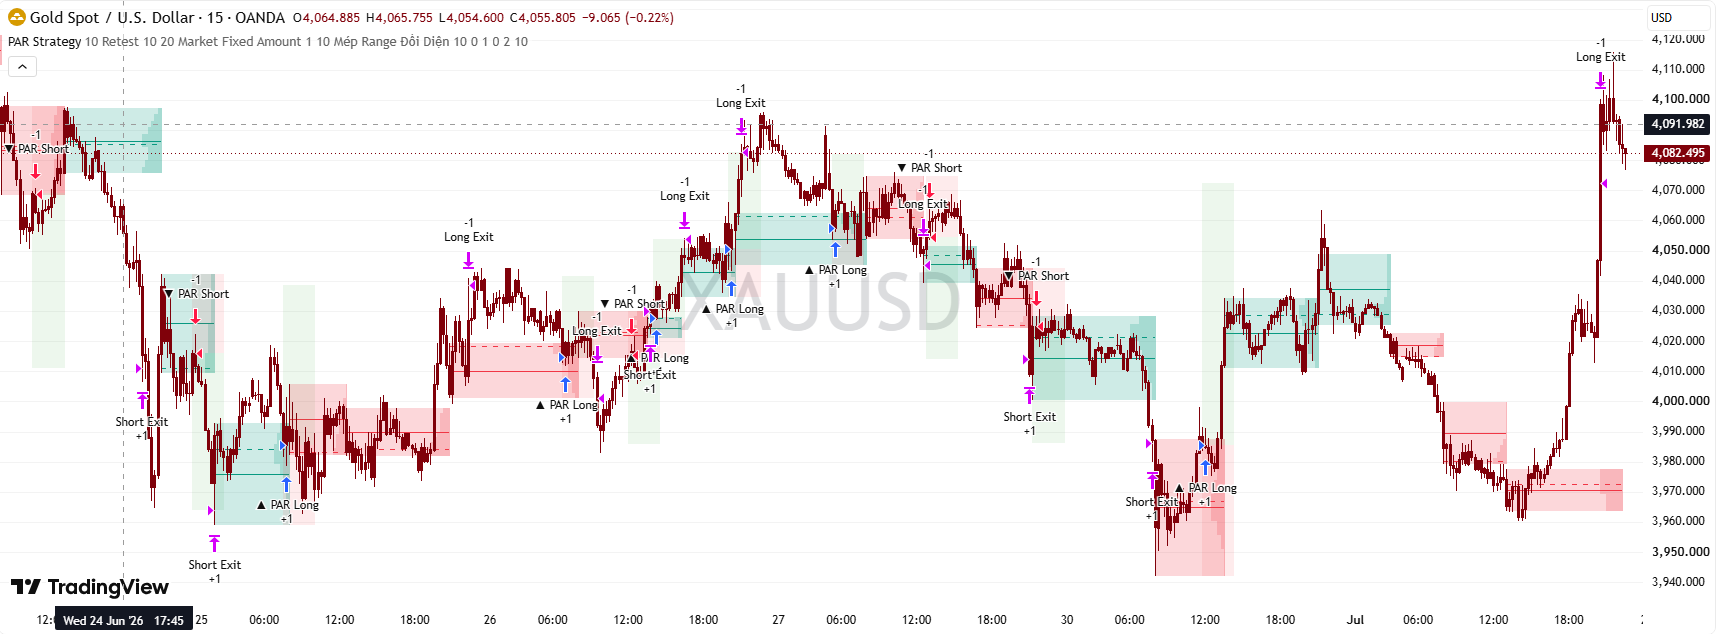
Retest Activity Range indicator for TradingView: how it works, settings, signals and strategy logic.
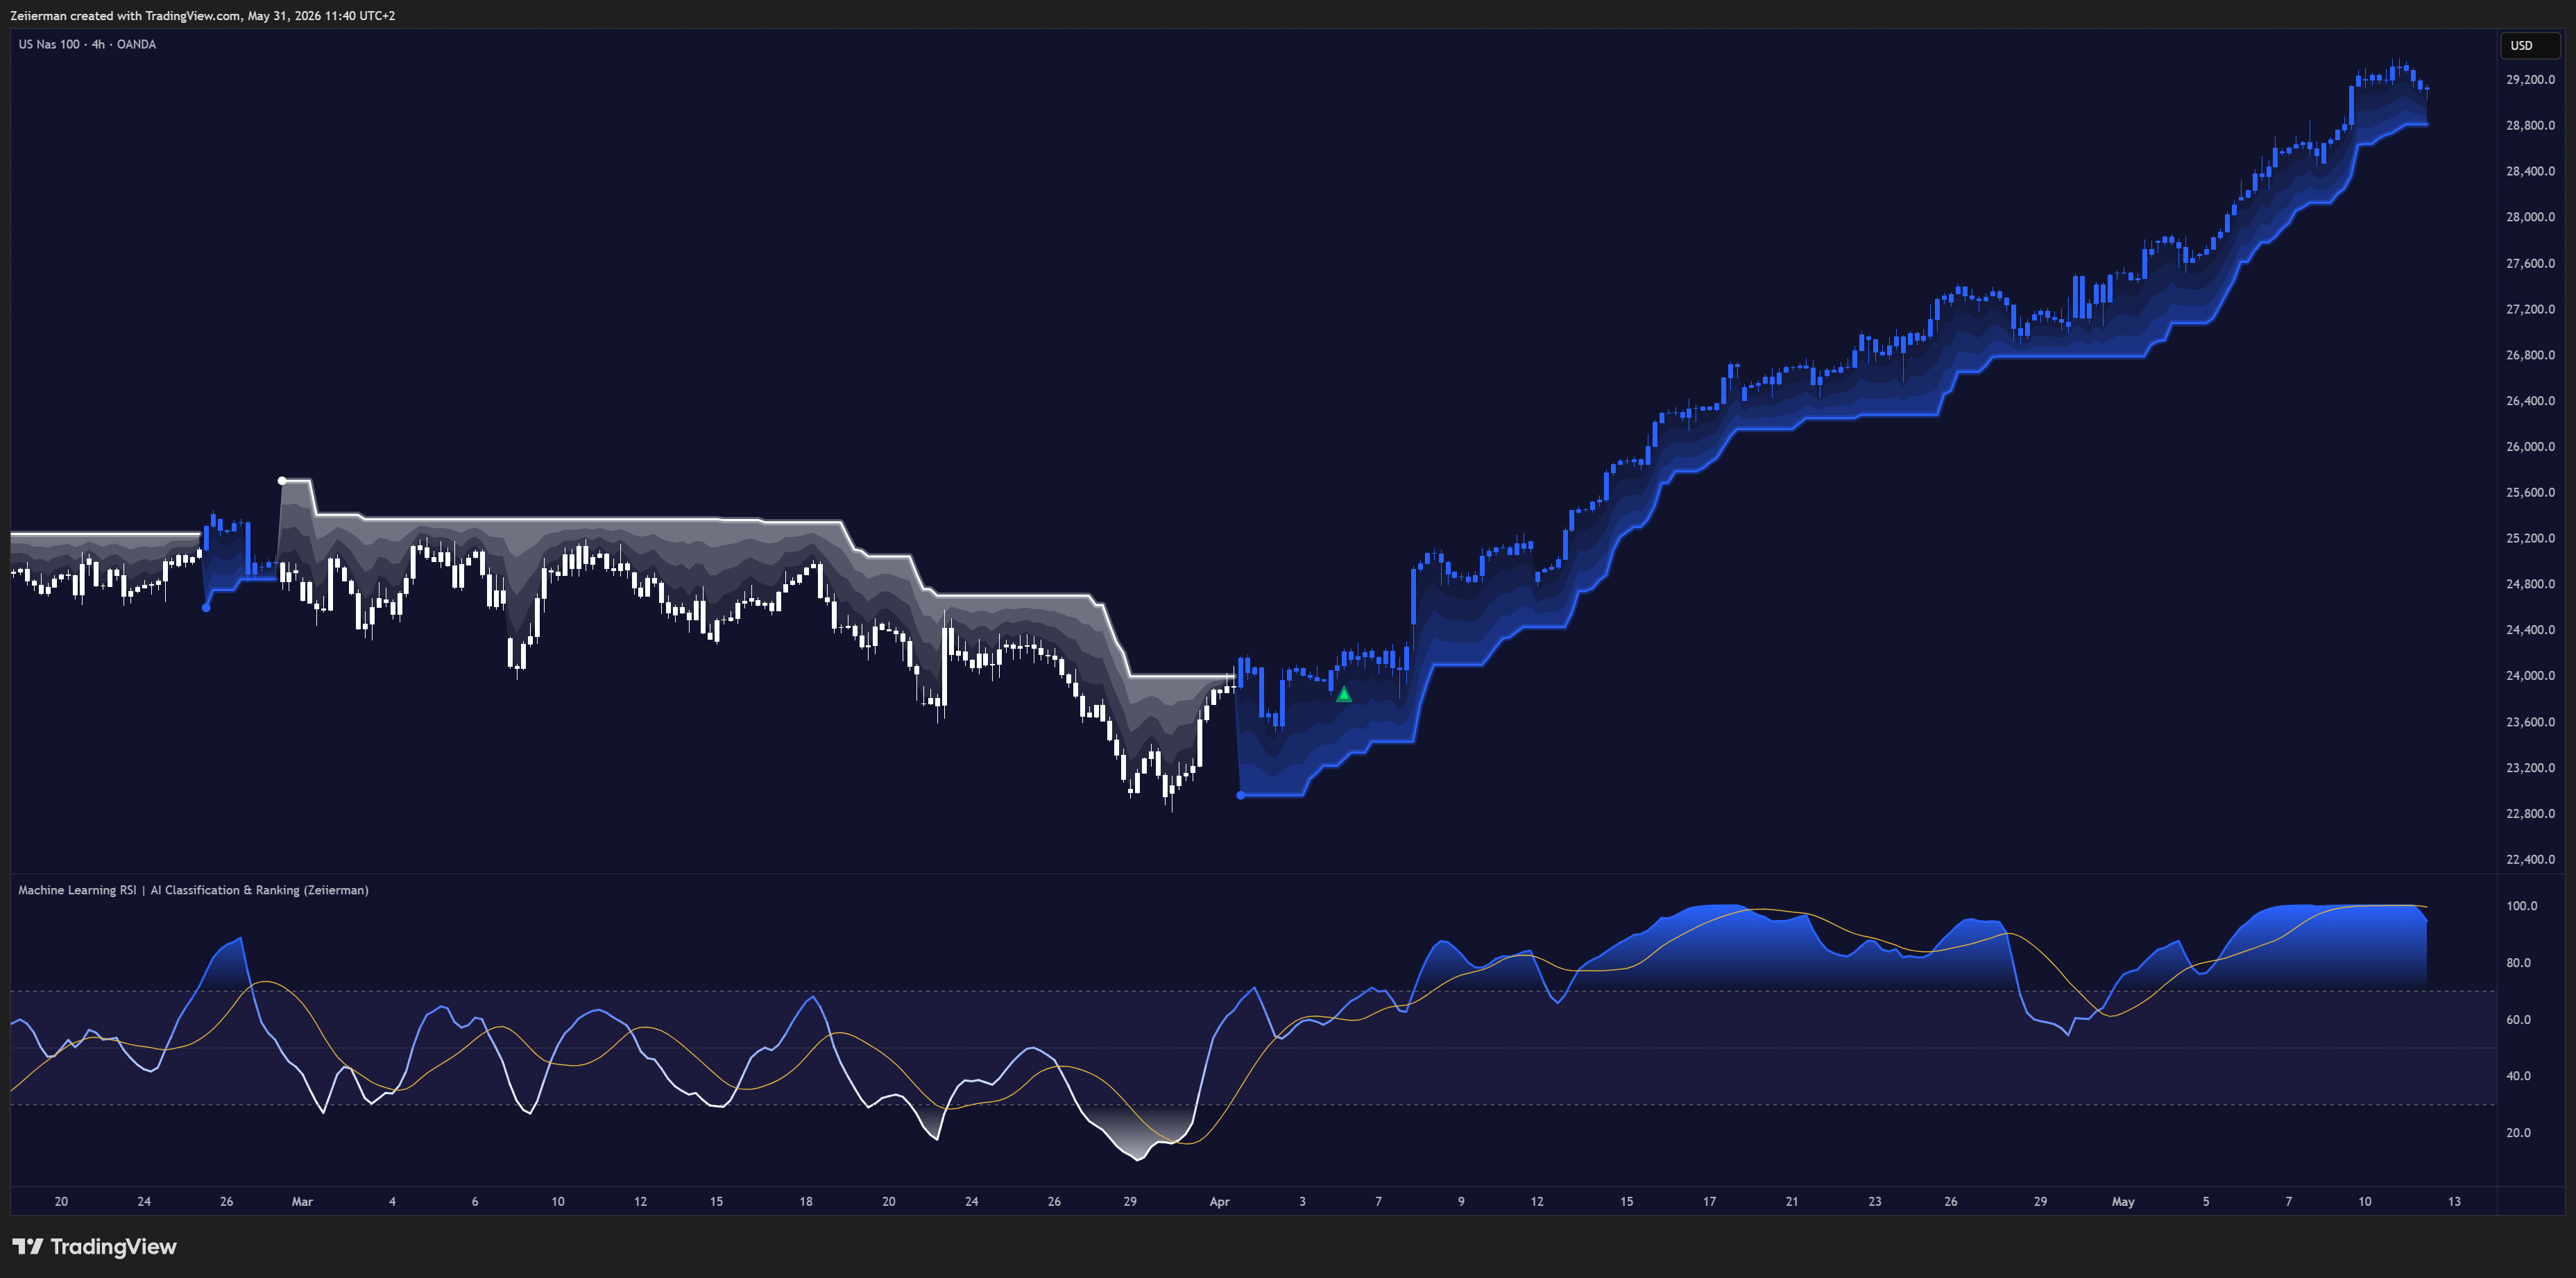
Machine Learning RSI indicator: compares current momentum with similar recent setups to classify and rank RSI signals. How it works and settings.
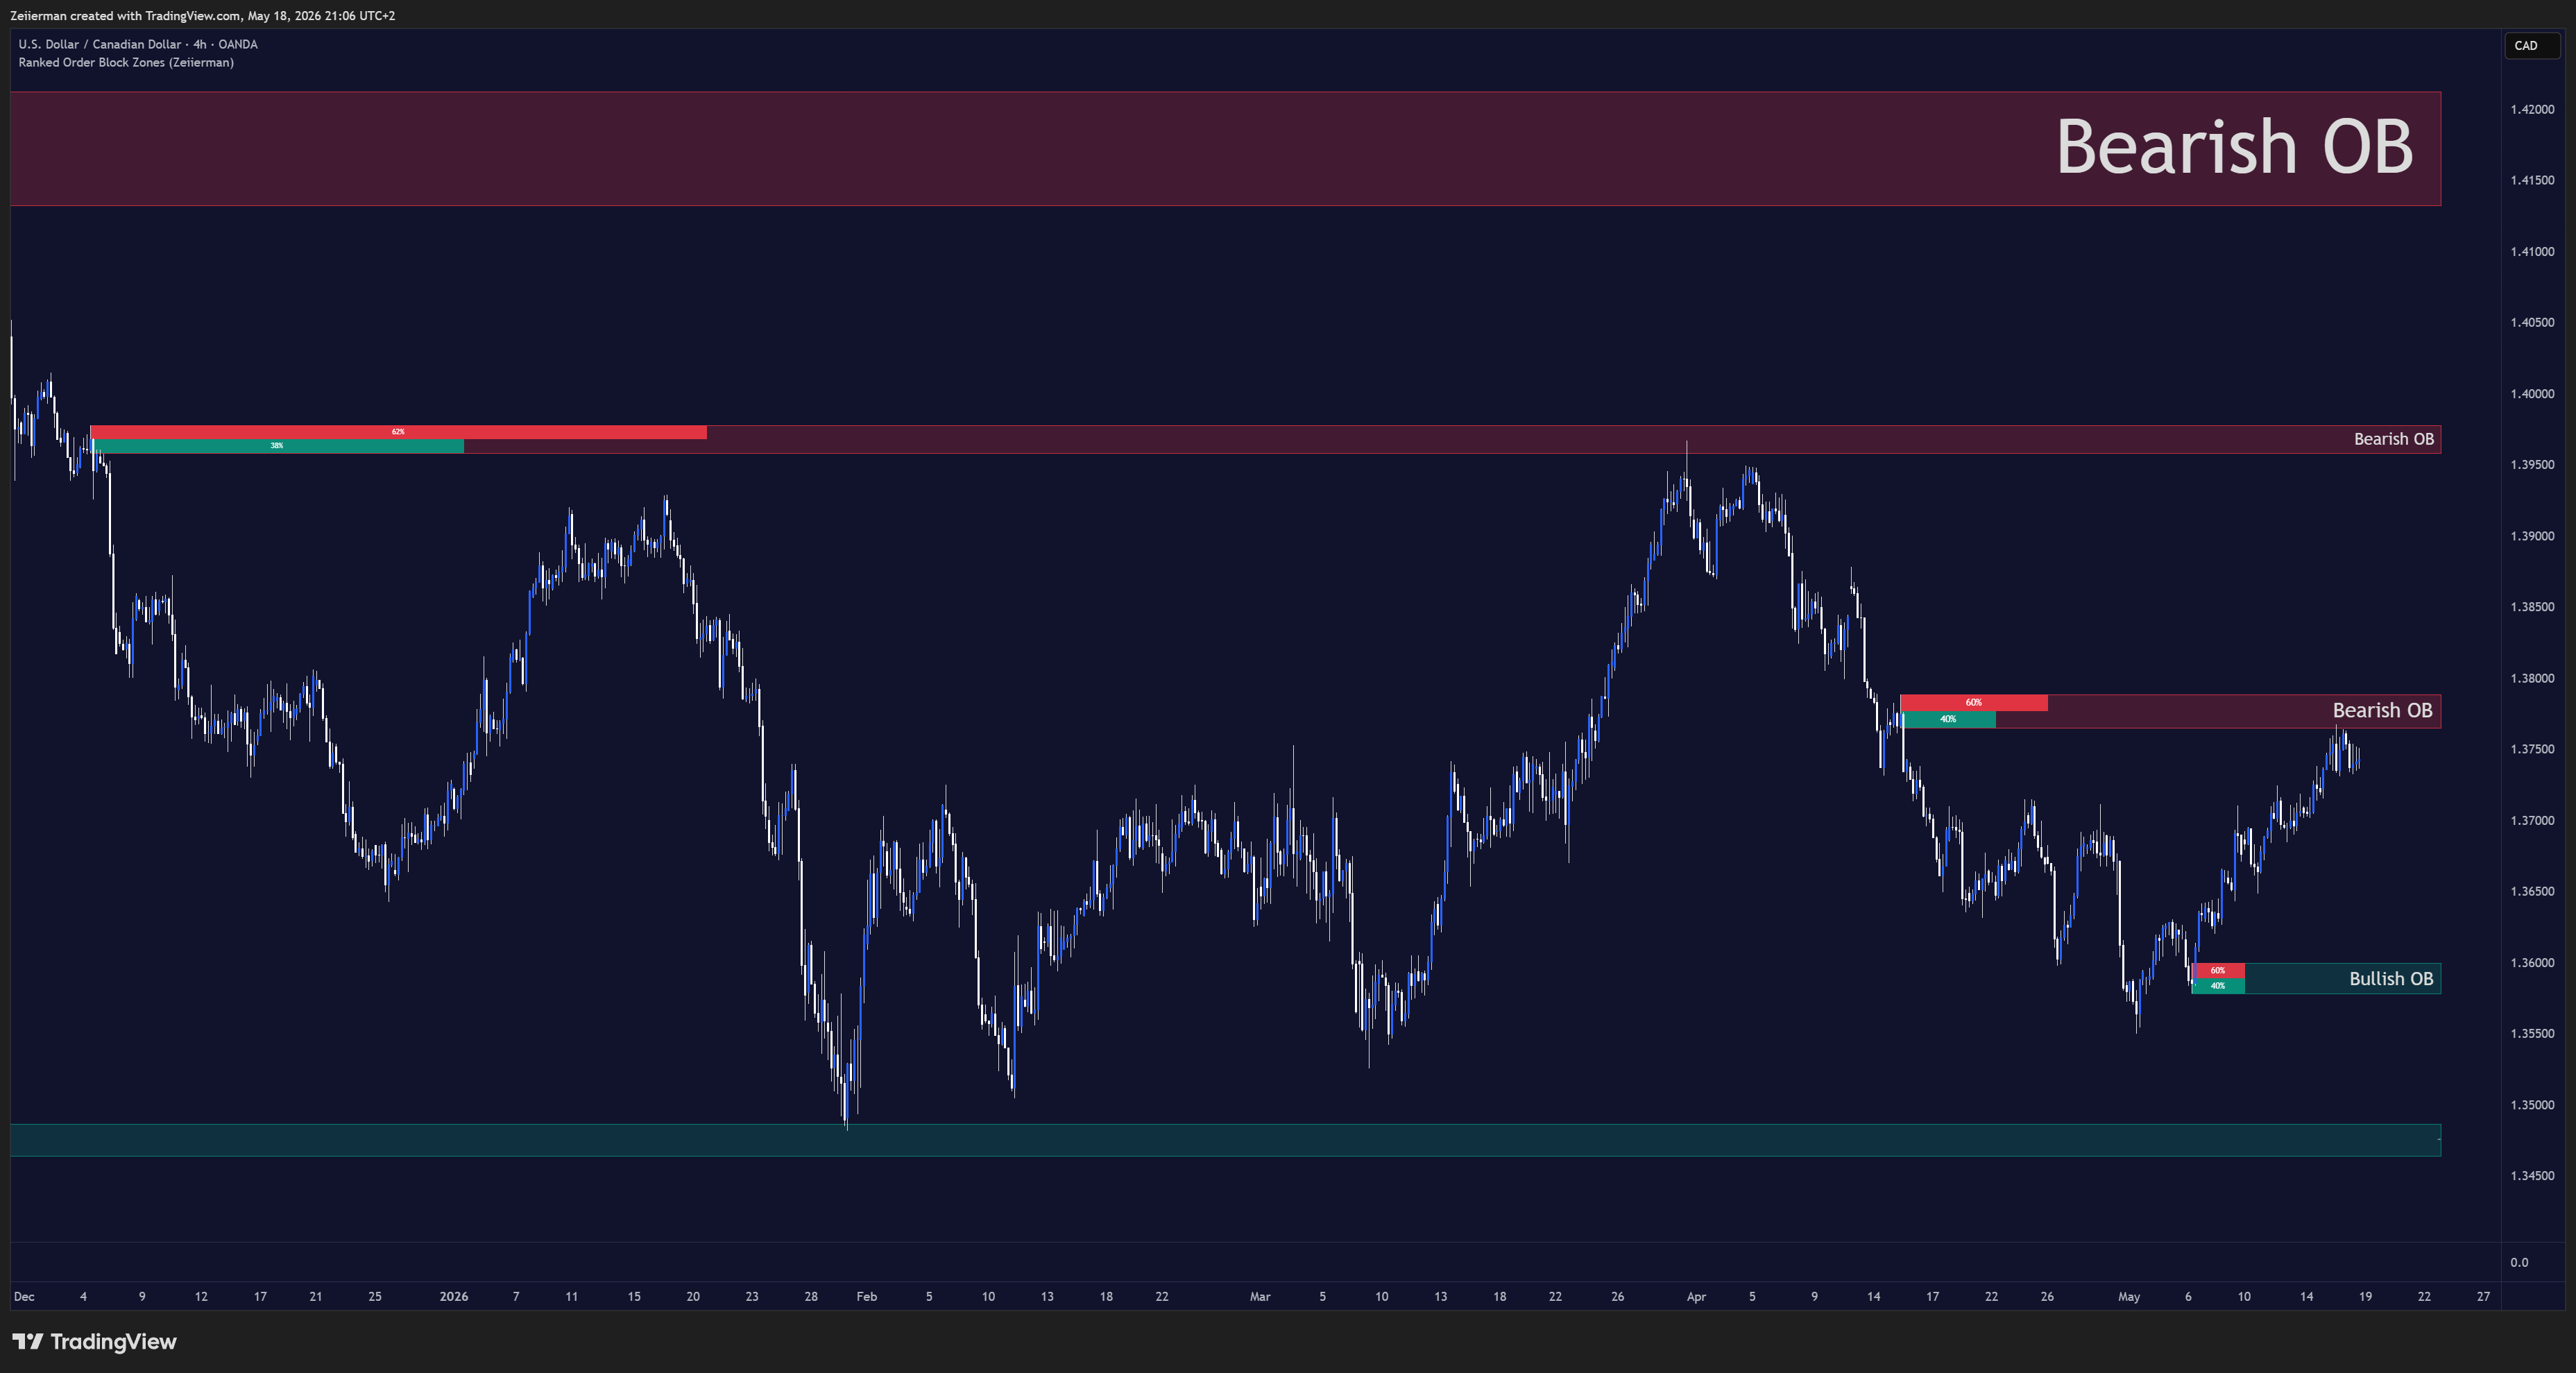
Ranked Order Block indicator for TradingView: how it works, settings, signals and strategy logic.
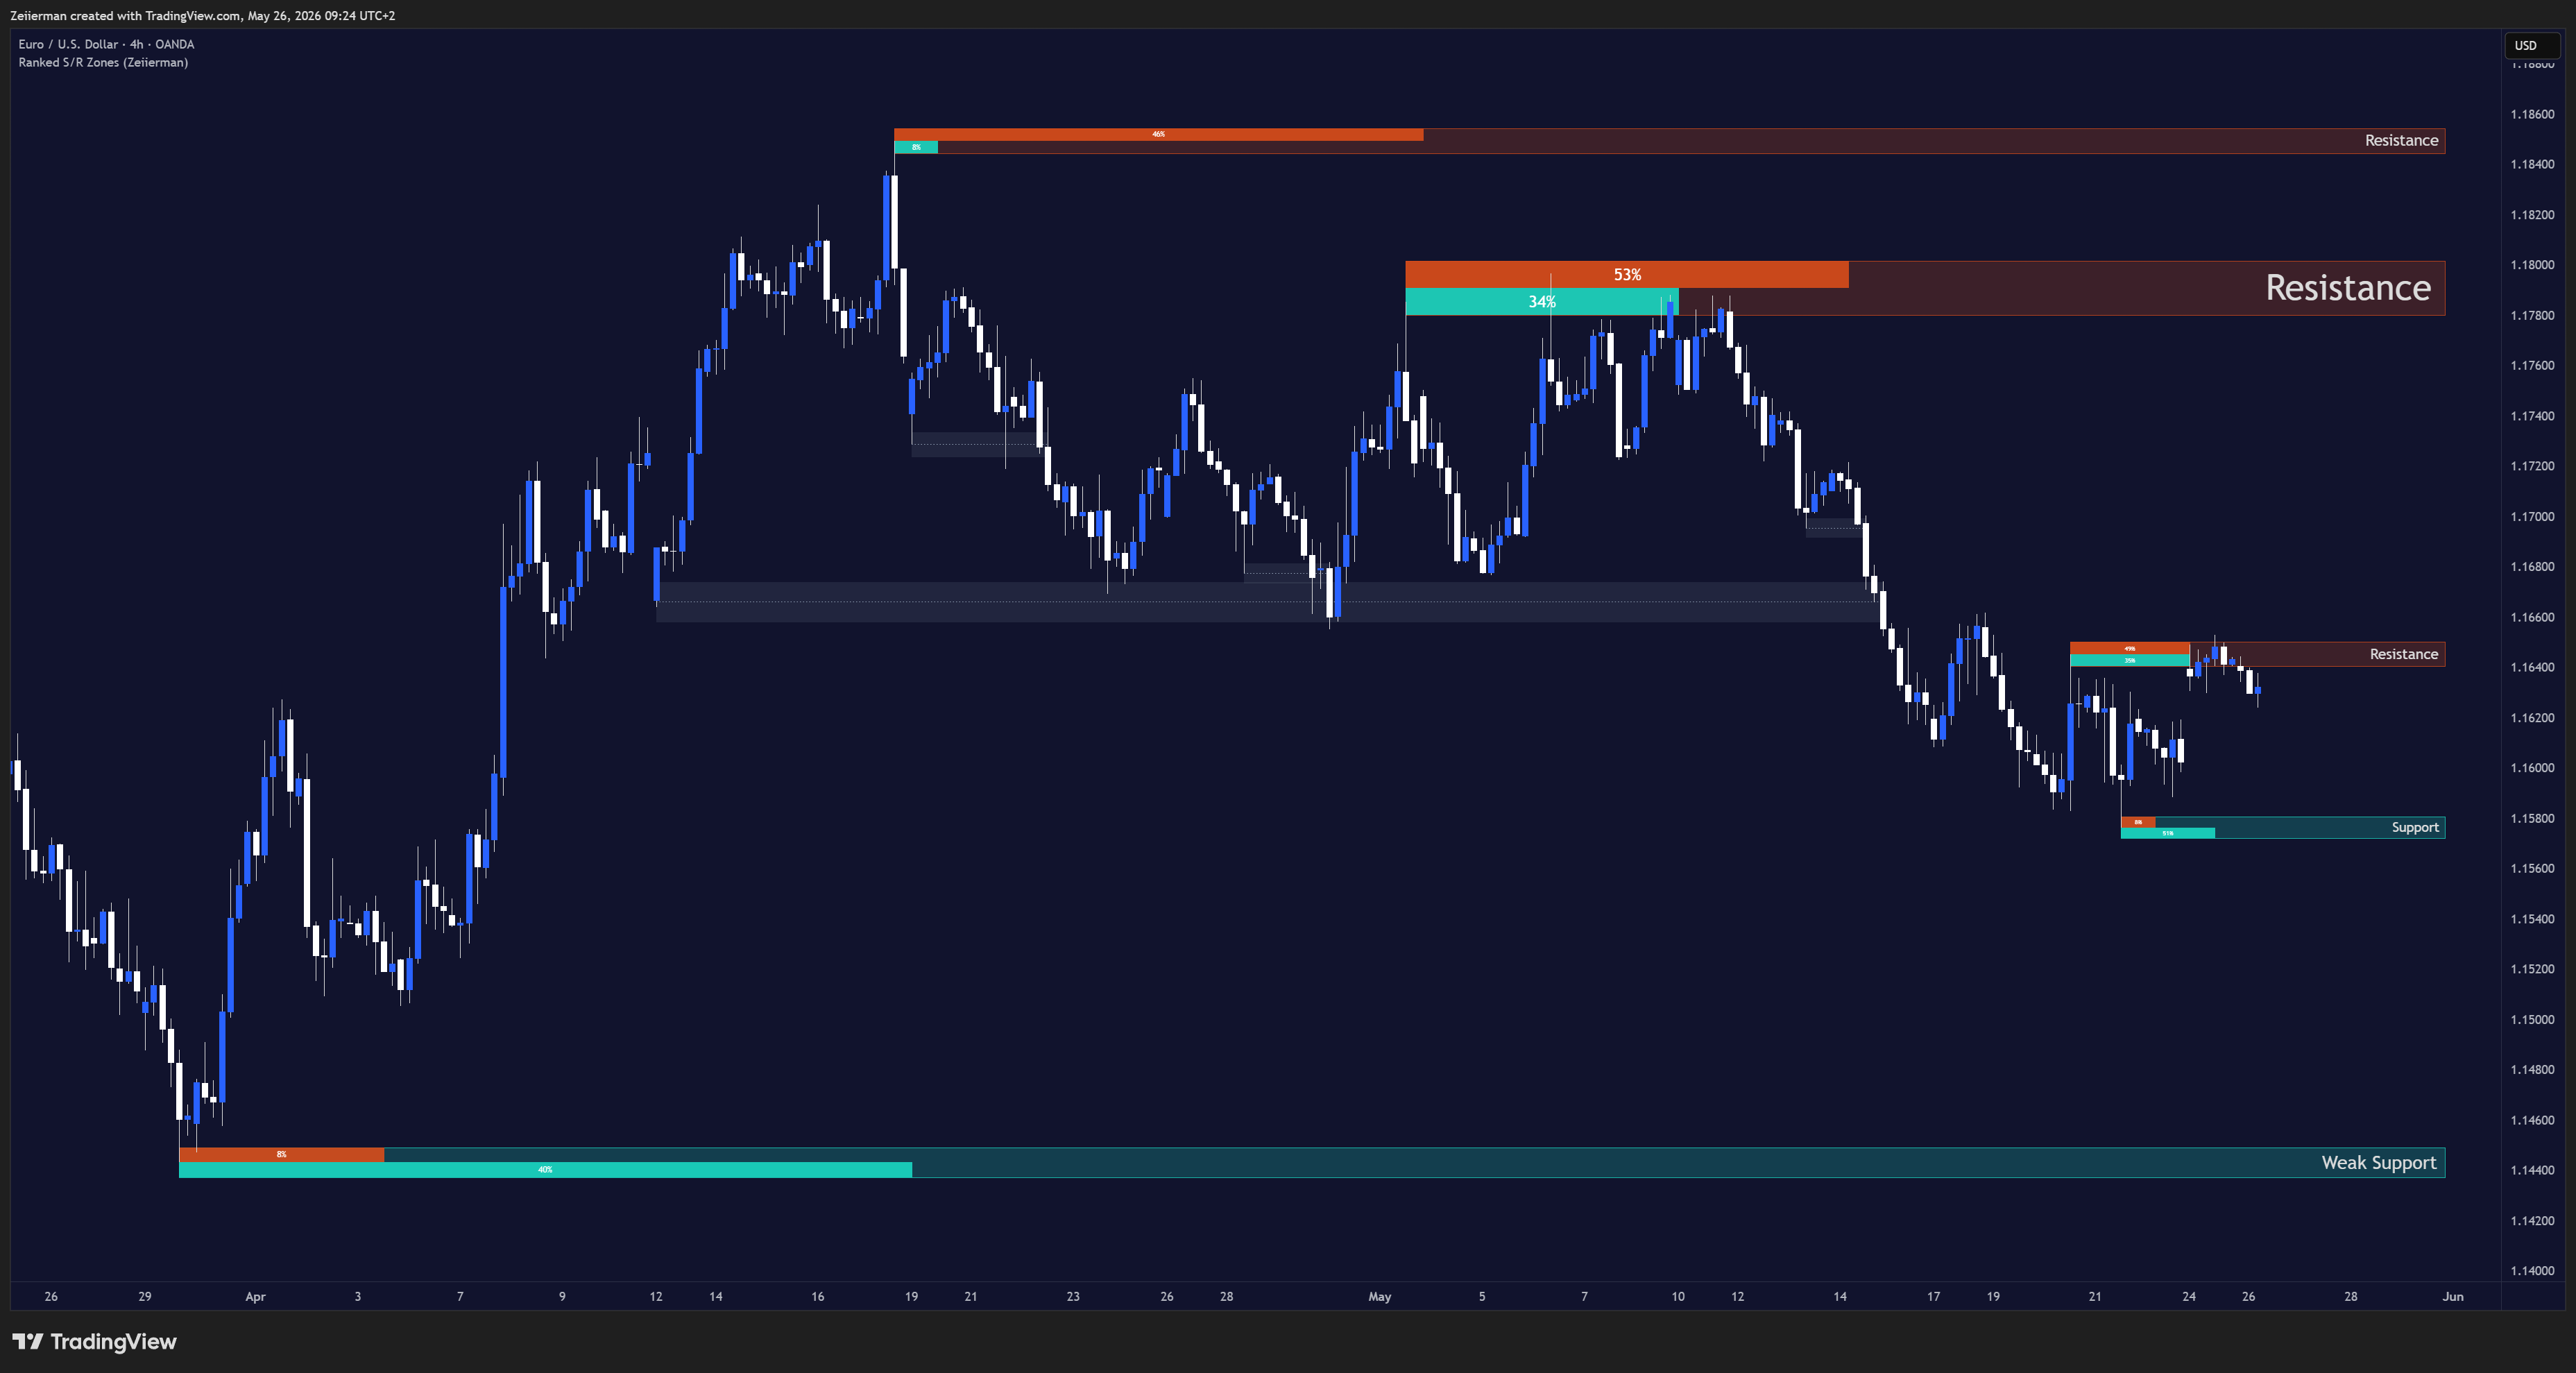
Ranked Support And Resistance indicator for TradingView: how it works, settings, signals and strategy logic.
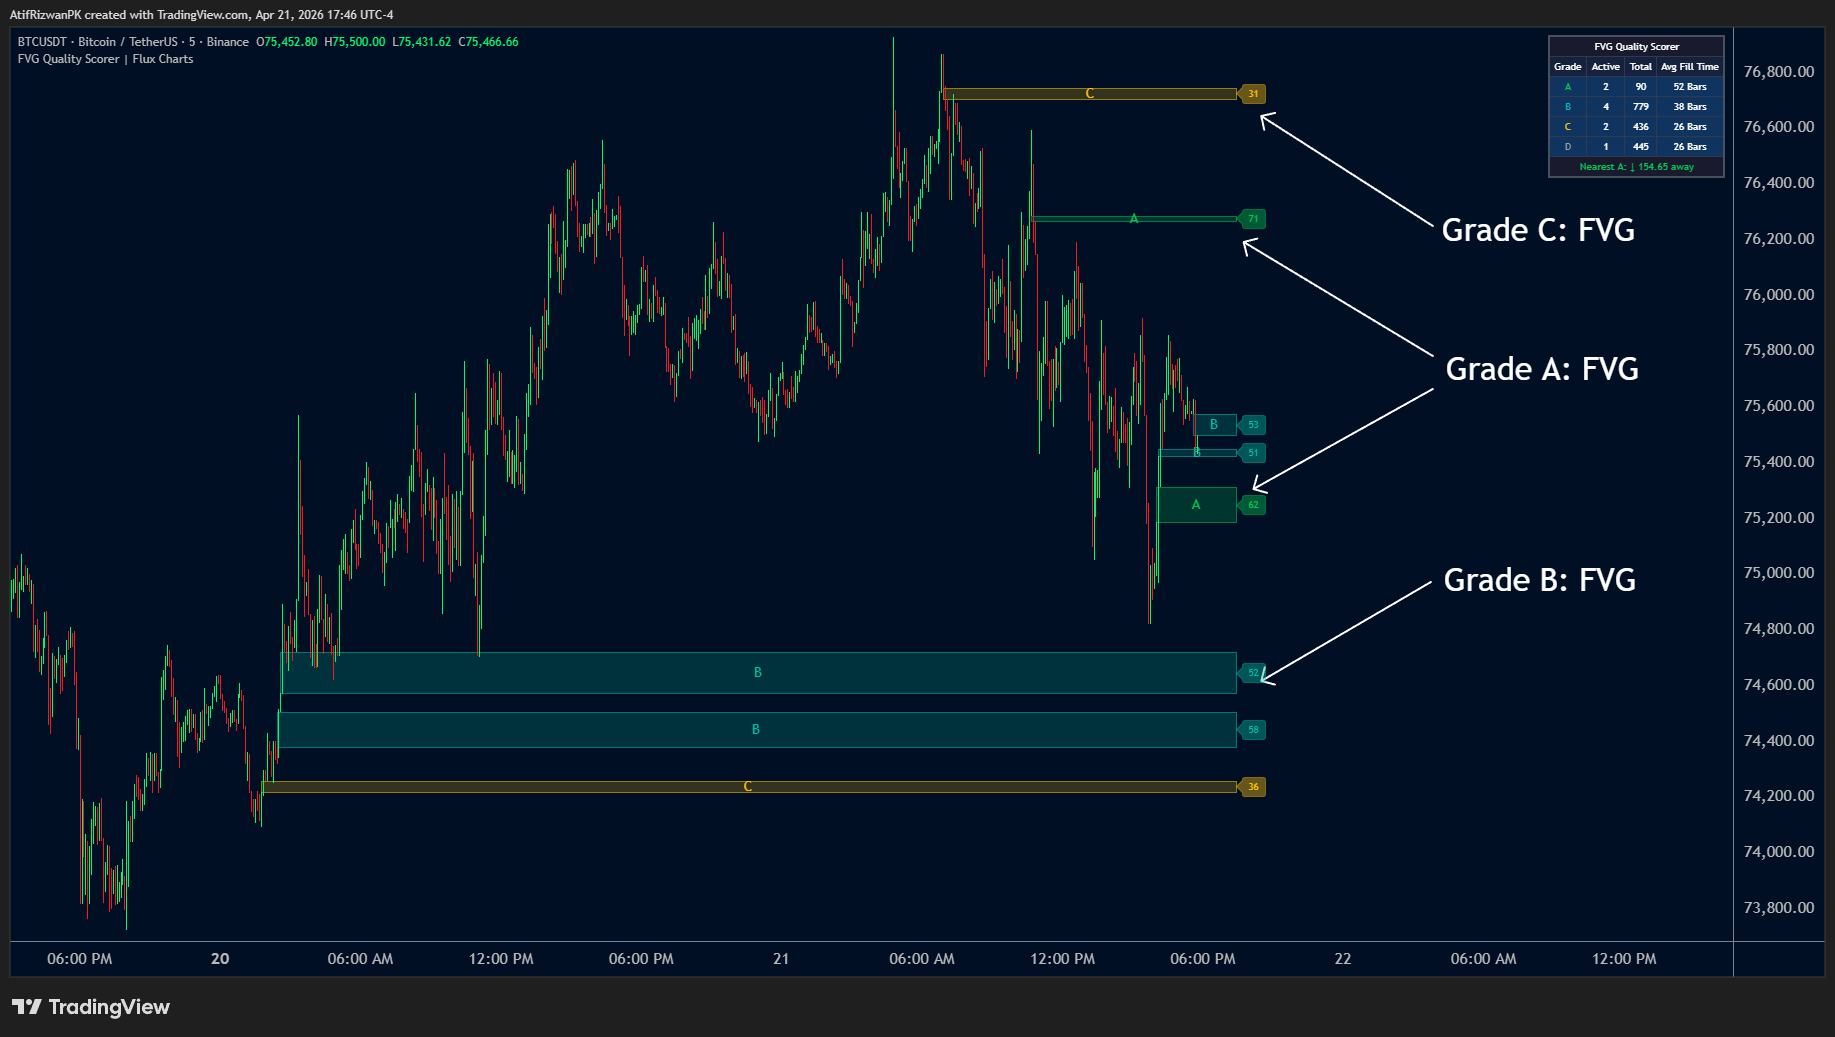
FVG Quality Scorer by Flux Charts: scores every Fair Value Gap on four independent axes, up to 100 points. How it works and how to filter FVGs.
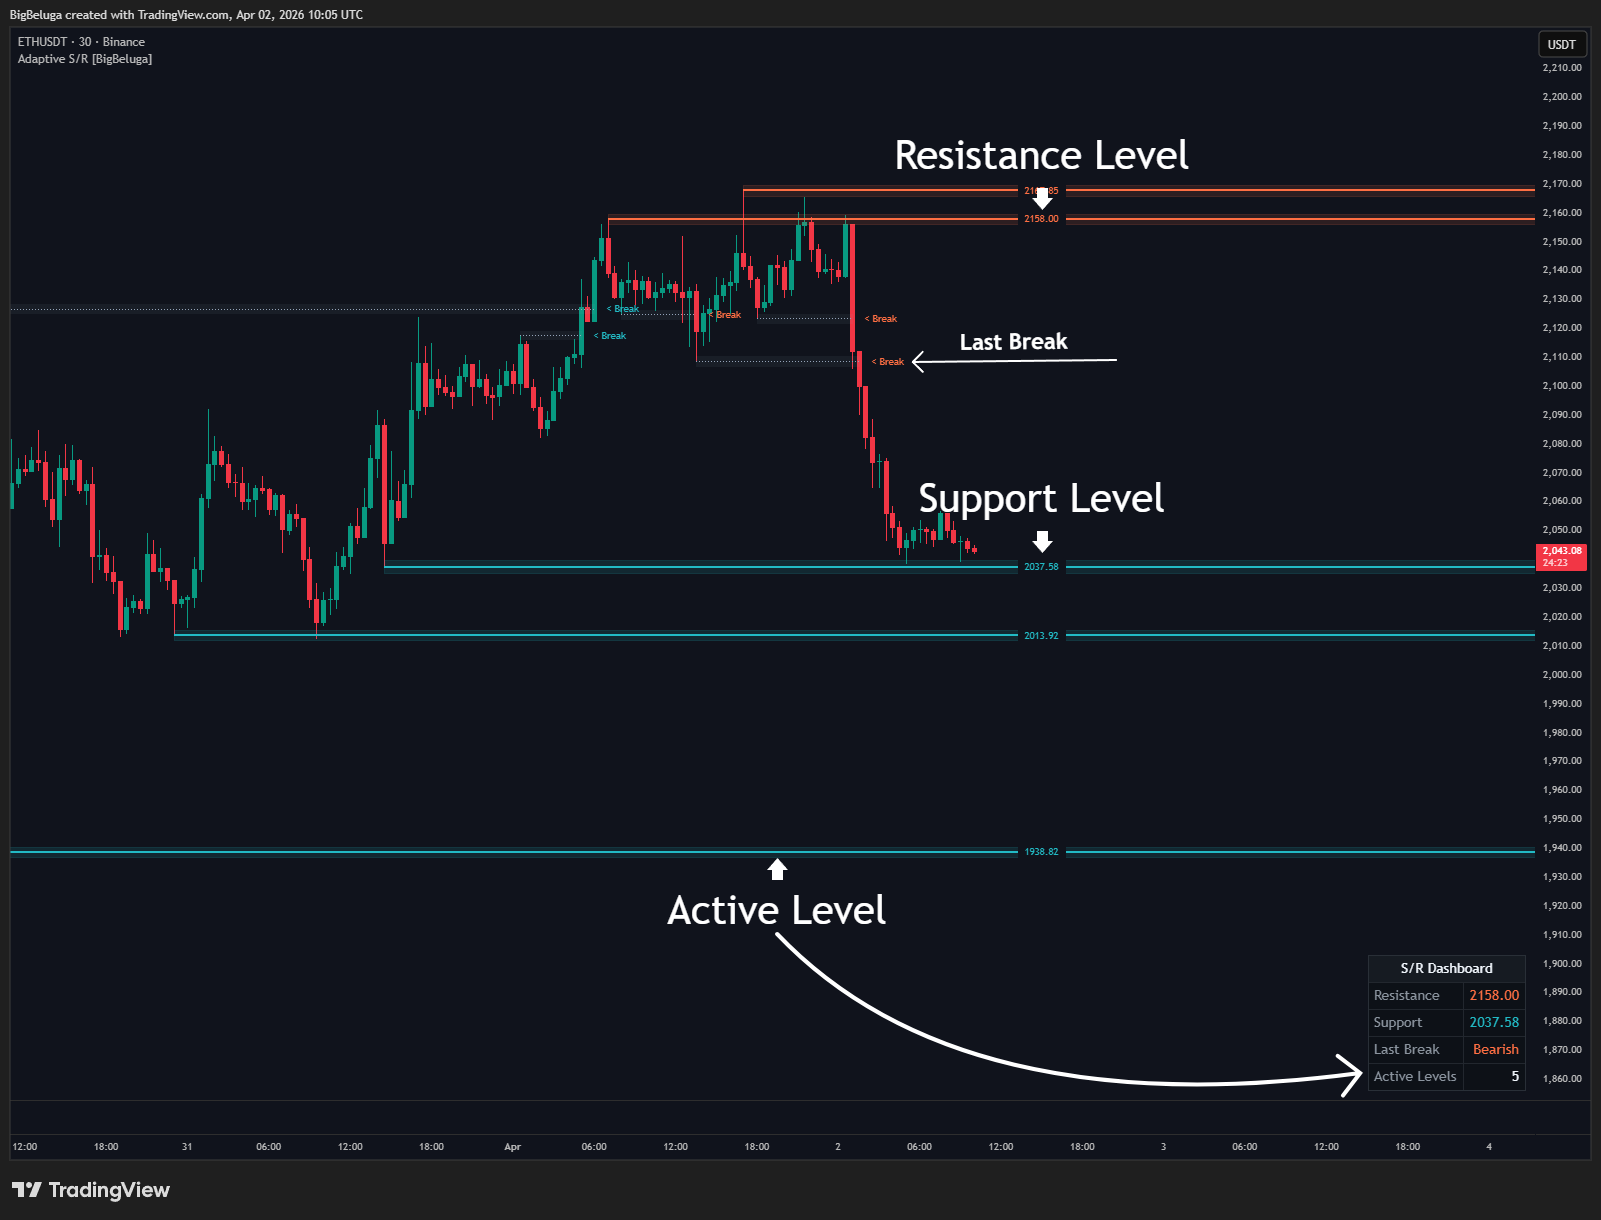
Adaptive Support and Resistance Zones by BigBeluga: how the indicator builds adaptive support and resistance zones and how to trade them.
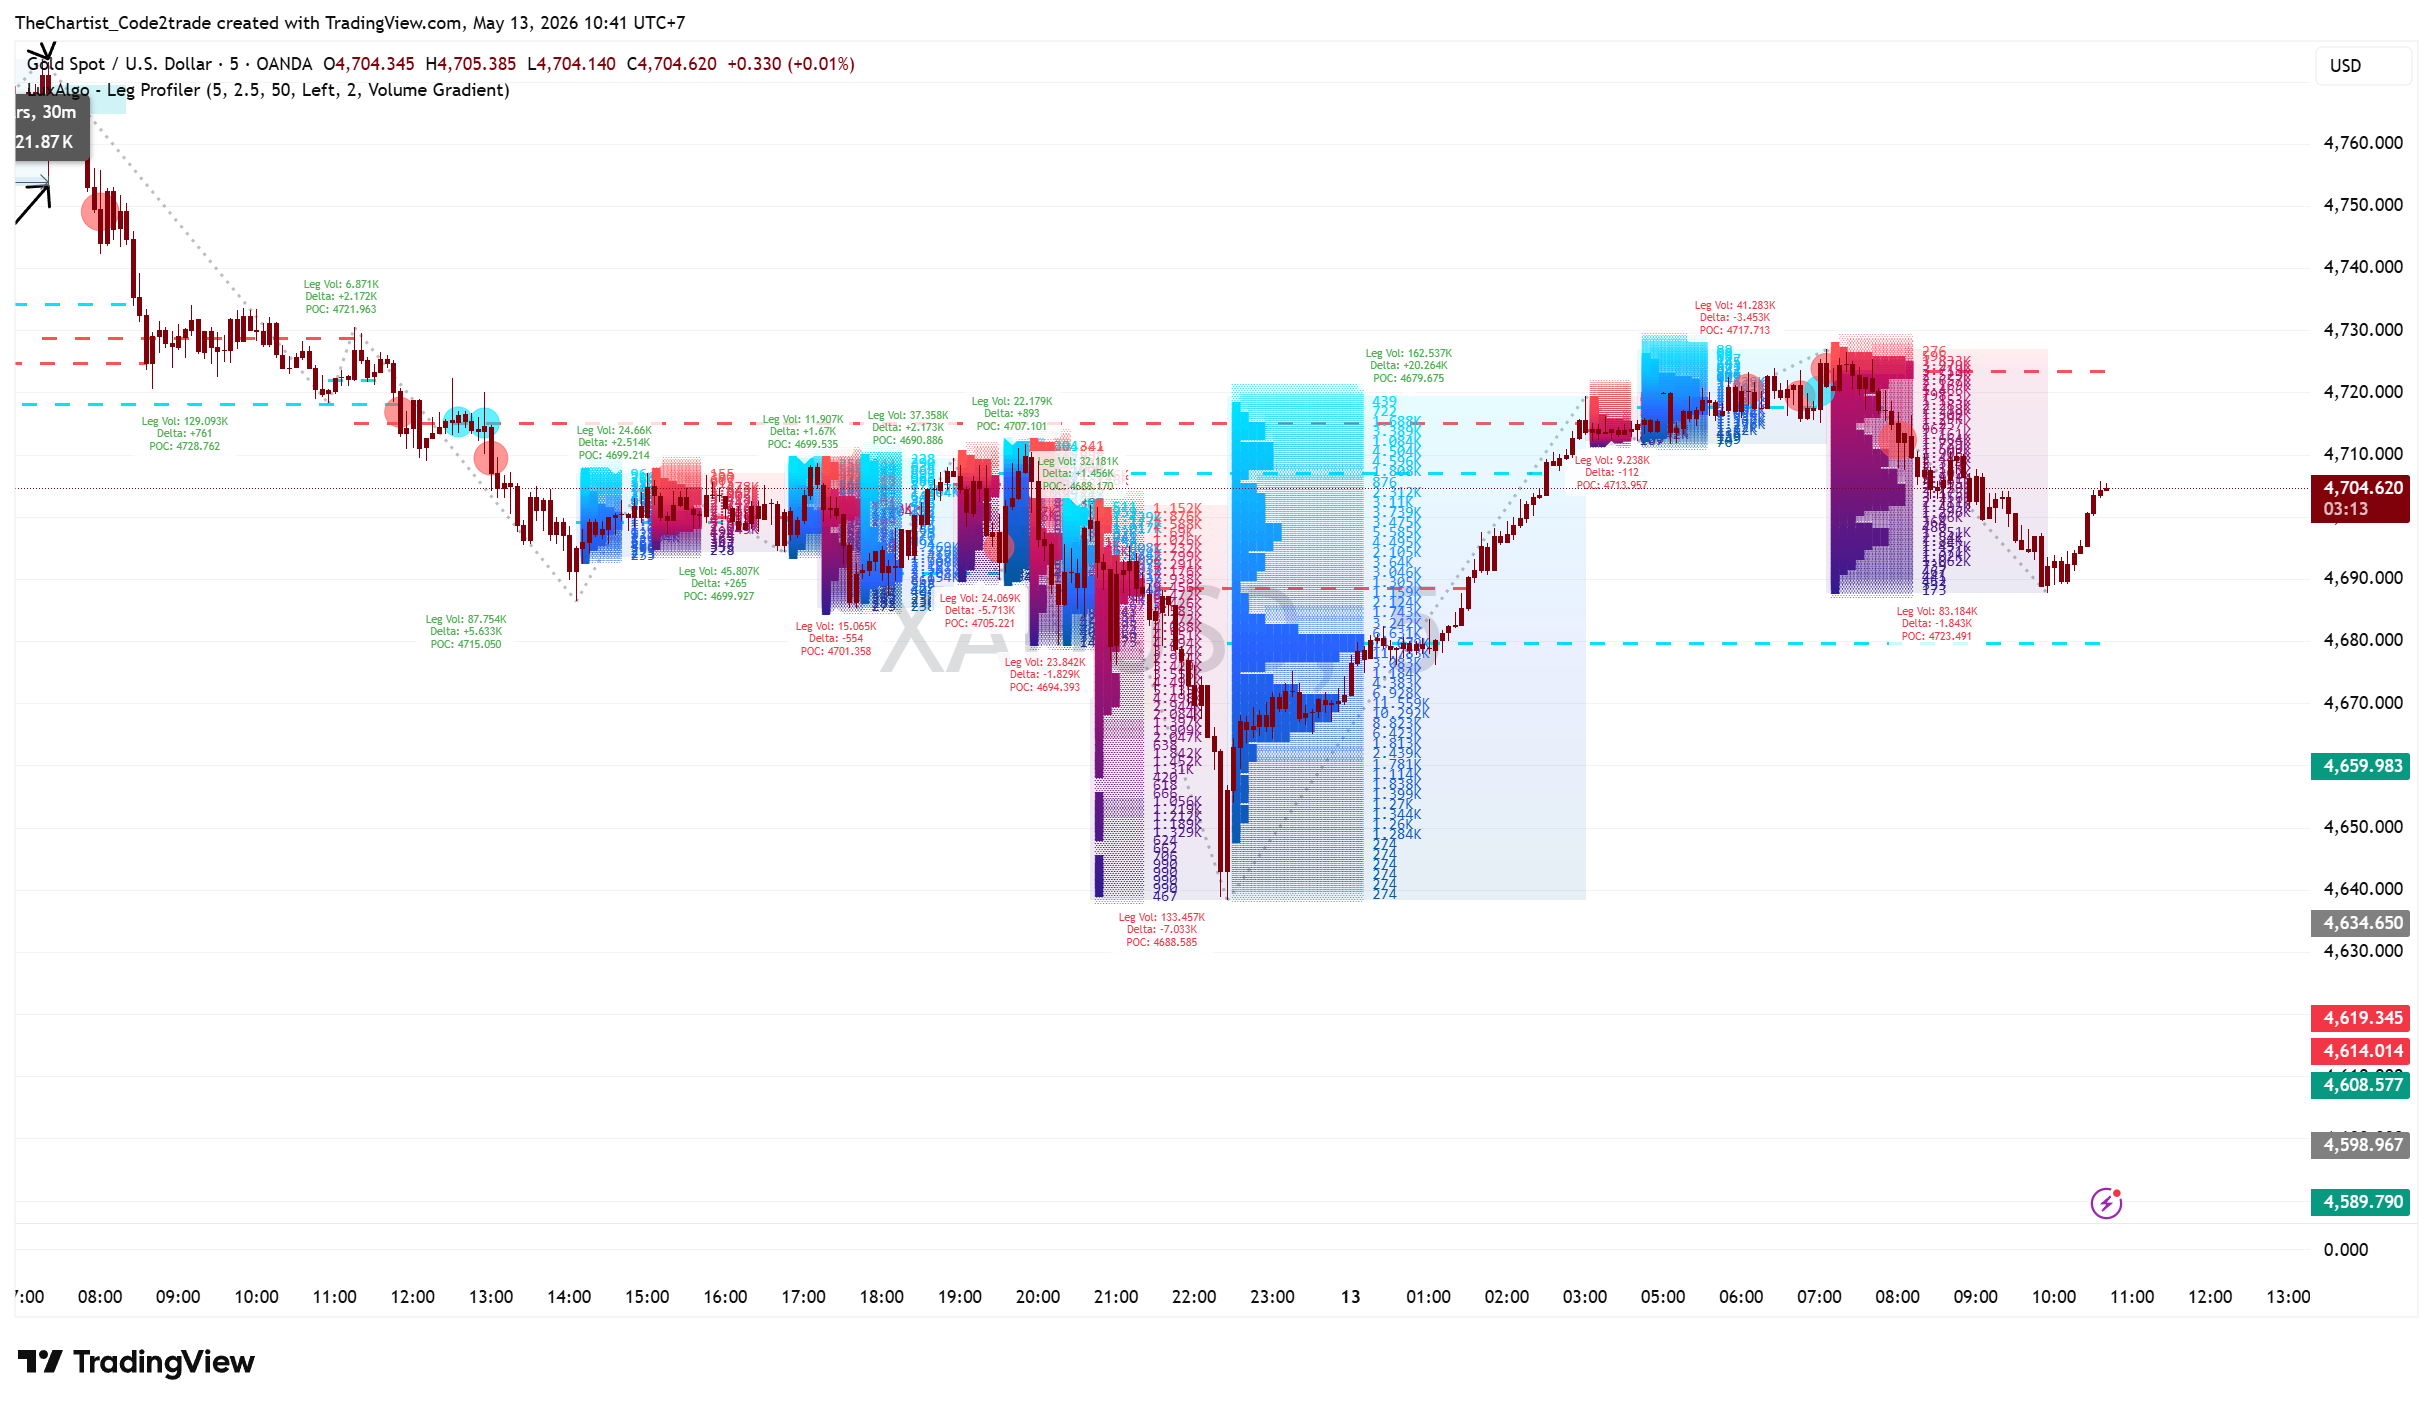
Structural Leg Profiler by LuxAlgo: profiles each structural price leg to show where volume and momentum sit. How it works.
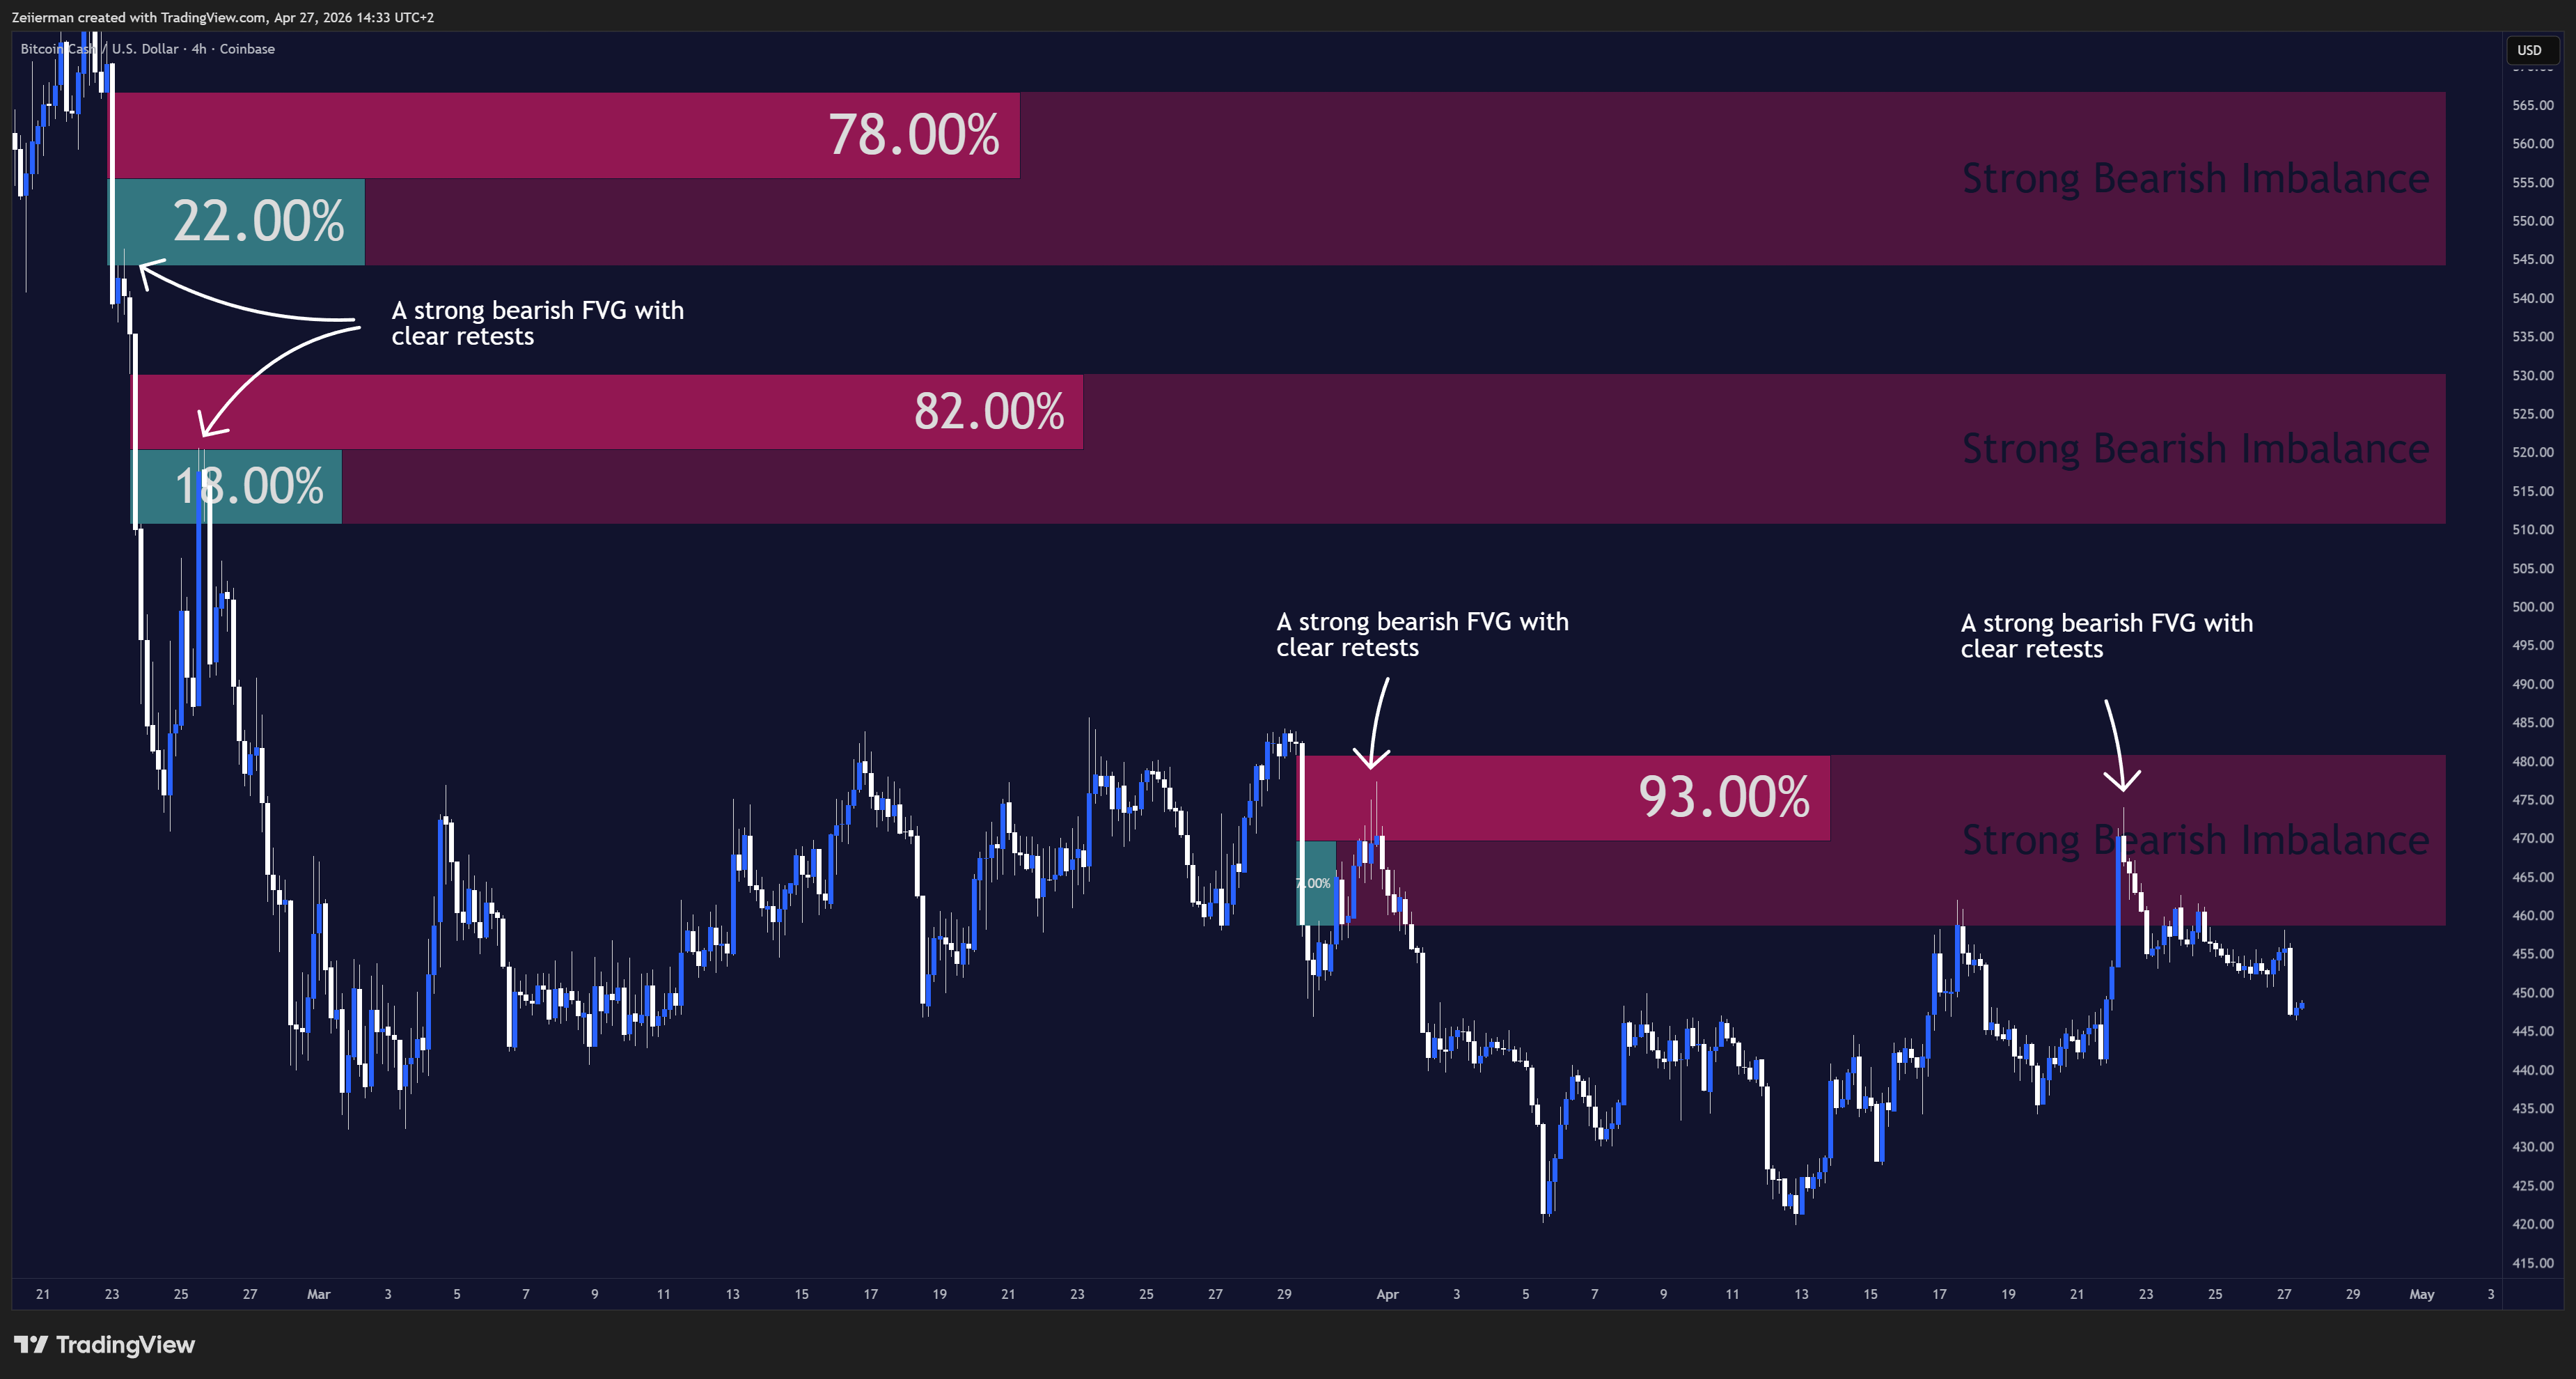
Ranked FVG indicator: an in-depth analysis of the Ranked FVG Imbalance Zones indicator. How it works, settings and strategy logic.

Why classic volume divergence gives so many false signals, and how a volume delta divergence strategy fixes it, from theory to code.