Change in State of Delivery [CISD] Indicator – CISD Liquidity Sweep Code2trade Strategy

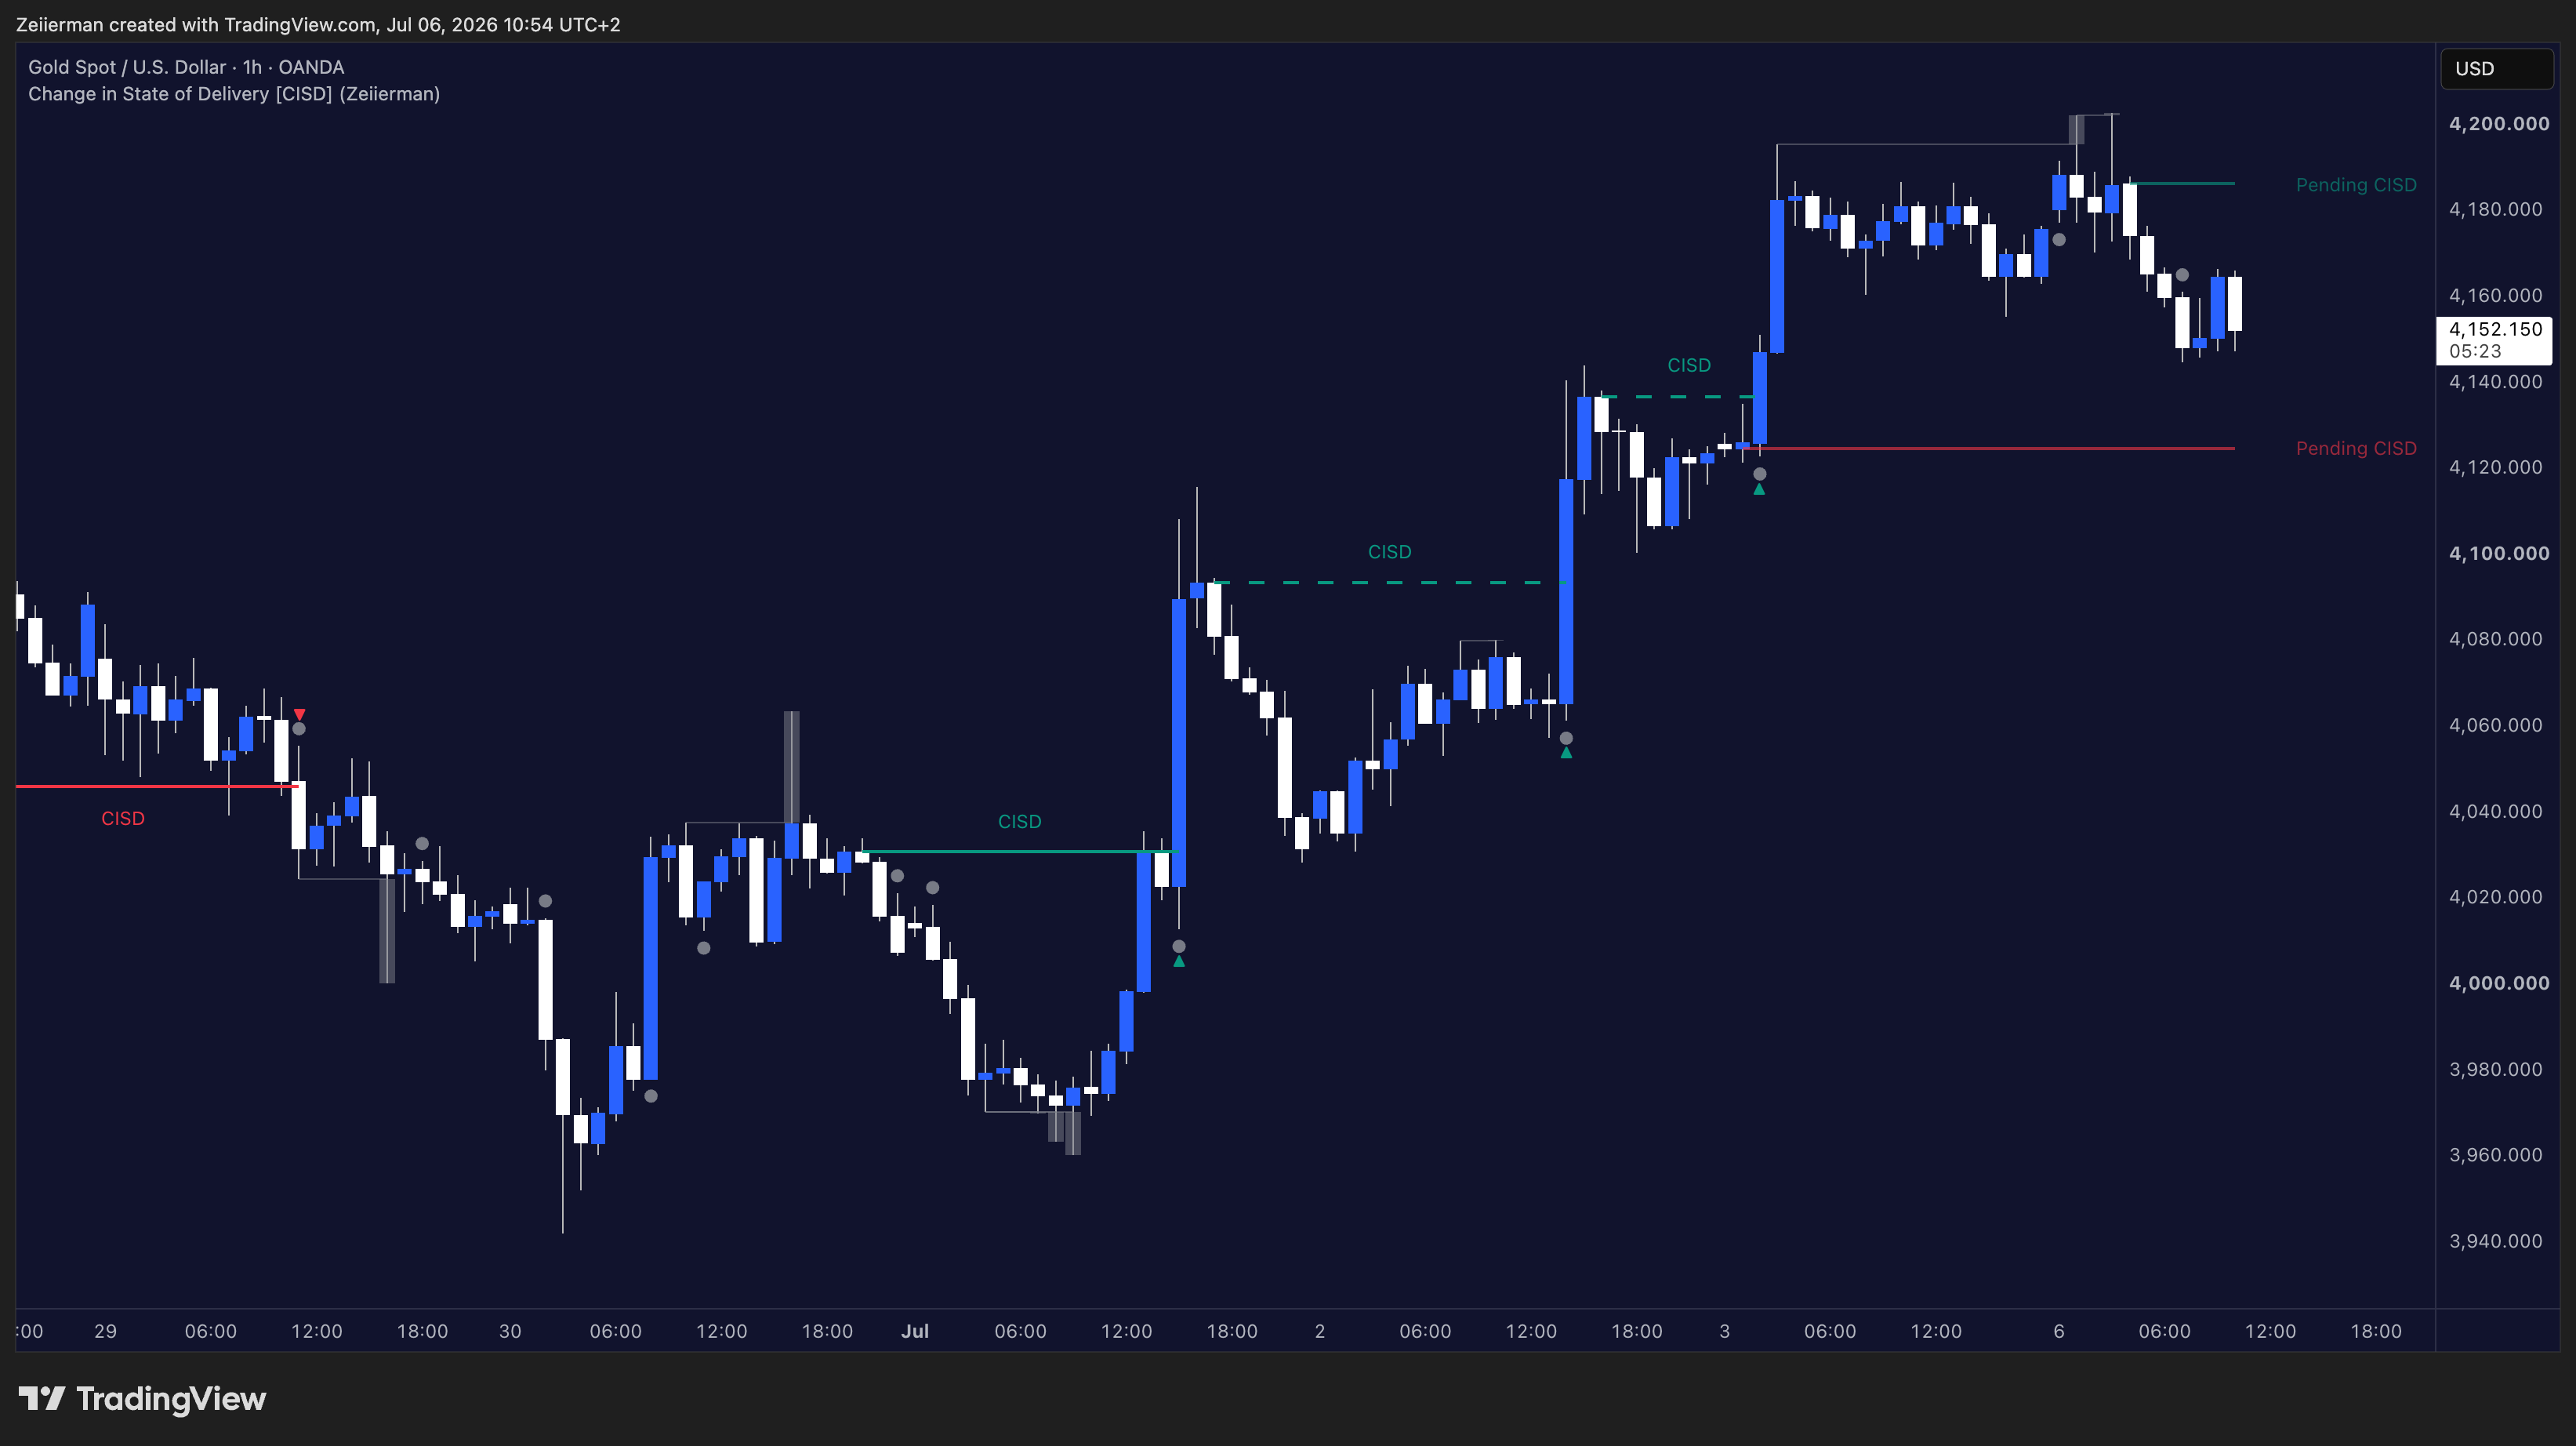
CISD (Change in State of Delivery) is a concept from the Smart Money Concepts / ICT school of trading. The theory states that the market “delivers” price in consecutive same-direction candle streaks: a run of consecutive bullish candles is a “bullish delivery” streak (buyers in control), while a run of consecutive bearish candles is a “bearish delivery” streak (sellers in control).

The core idea: the opening price of the FIRST candle in a delivery streak is the boundary that defines the current state of delivery. When price later closes back through that exact open level in the opposite direction (e.g. after a bearish streak, price closes back ABOVE the open of the first bearish candle), the theory treats this as evidence that the dominant order flow has flipped – the “state of delivery has changed” (CISD confirmed), signaling a possible short-term trend reversal.
Read More »

Auto Pattern Detector Targets Indicator – Strategy Code2trade

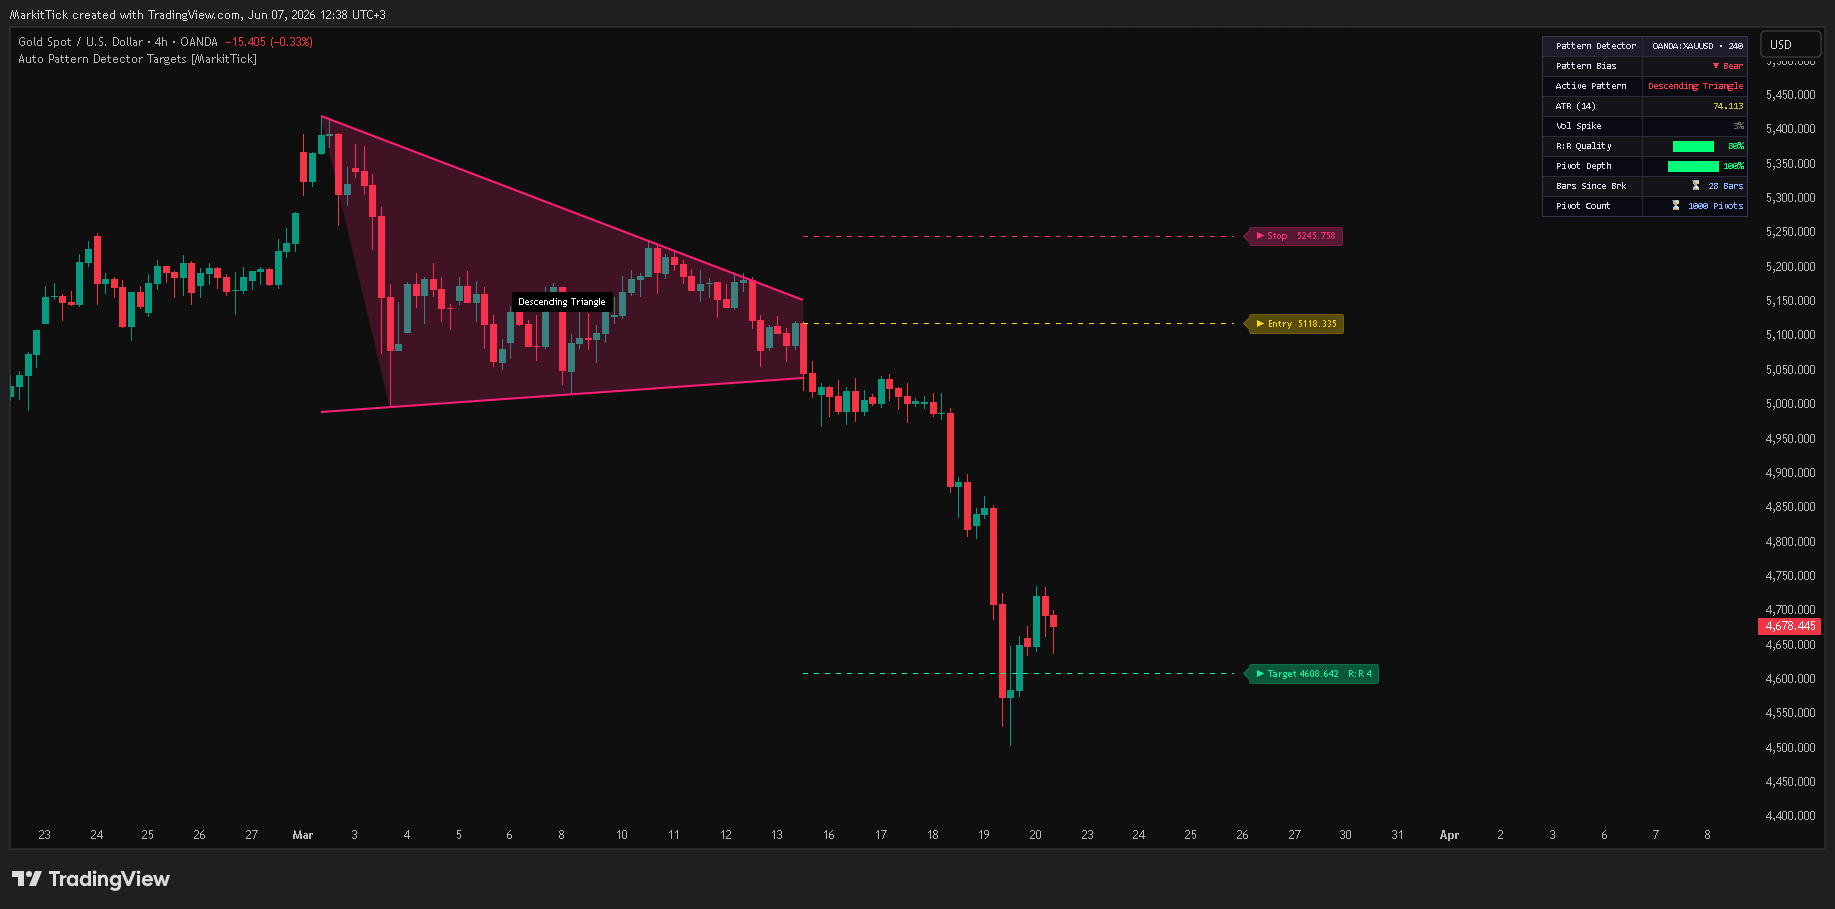
The indicator is built on classic technical-analysis theory: price tends to repeat certain “geometric shapes” (Double Top, Head & Shoulders, Flag, Triangle, Cup & Handle…) formed by the psychological tug-of-war between buyers and sellers around swing highs/lows. Once a shape completes and price breaks out of its boundary, the odds that price keeps moving in the breakout direction for at least the shape’s own “height” (its measured move) are considered higher than random.

The indicator automates the whole process a discretionary technical trader would normally do by hand: find swing highs/lows (pivots) → fit those pivots into one of 8 geometric templates (16 named pattern variants counting bullish/bearish direction) → confirm the breakout using a volatility threshold (ATR) or a % price threshold → compute Entry/Stop Loss/Target with each pattern’s own measured-move formula → discard any pattern whose Risk:Reward ratio is too low before drawing it.

Read More »

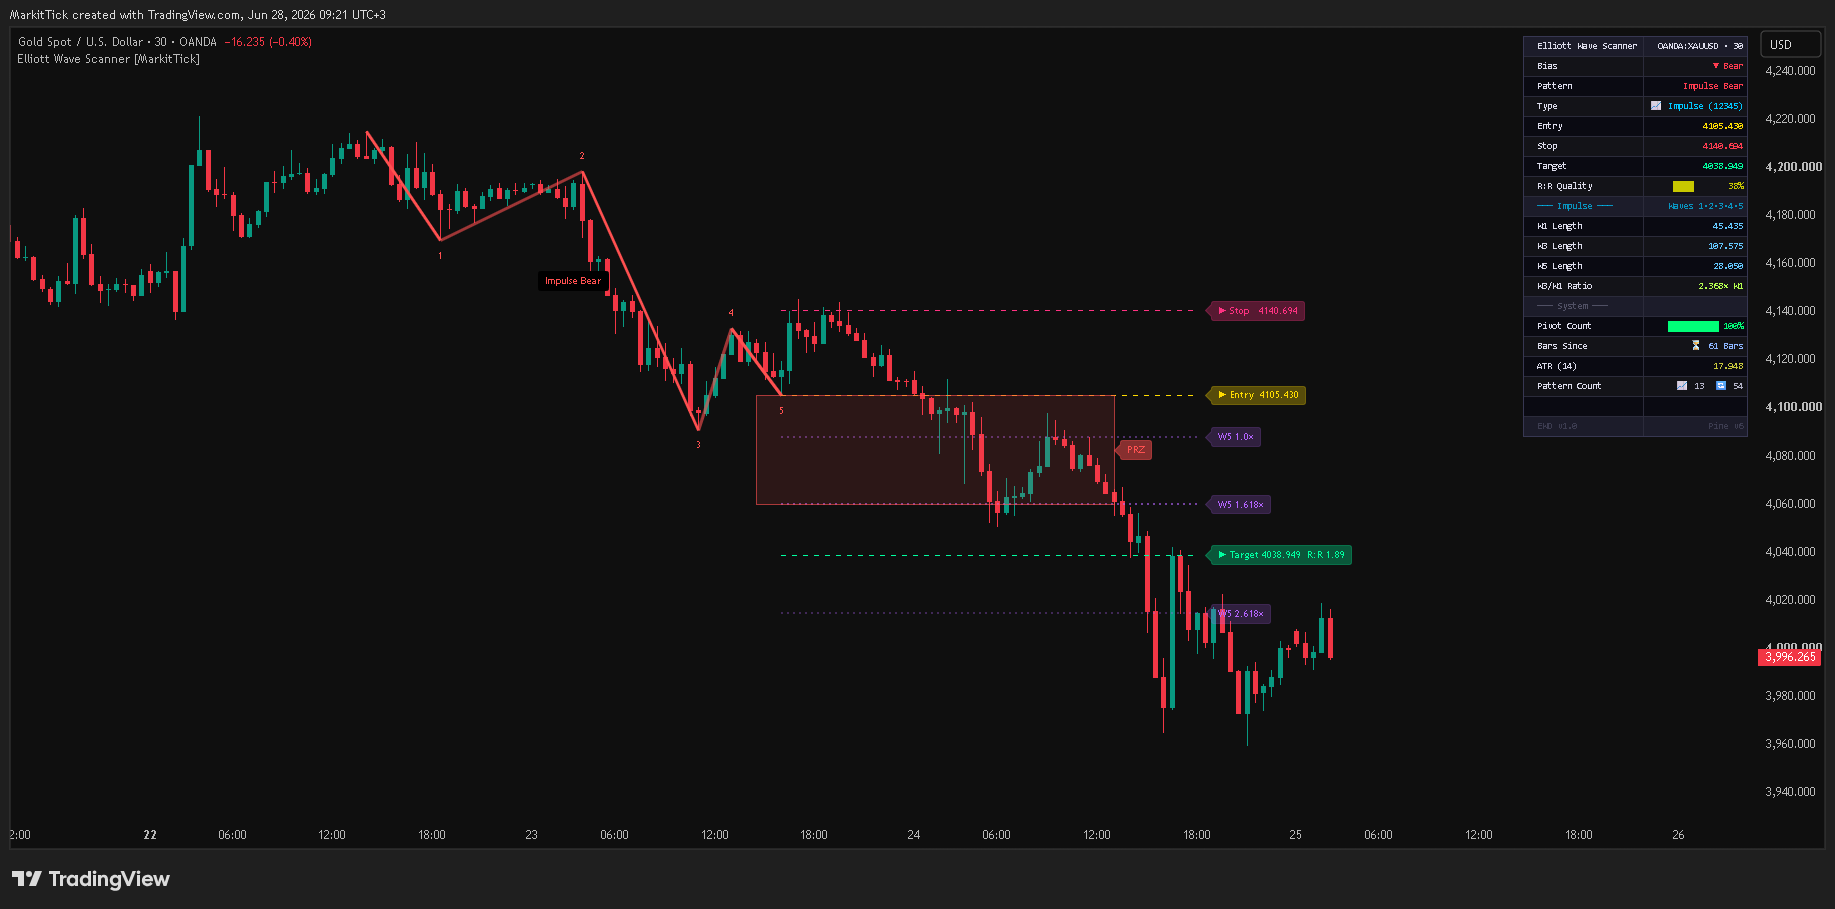
Elliott Wave Scanner Indicator

Elliott Wave theory holds that price does not move randomly but in repeating 5-wave “impulse” swings (in the direction of the larger trend) followed by 3-wave “corrective” pullbacks (against it). This indicator does not try to predict a wave count in real time as it forms – instead it works backward from already-confirmed swing pivots. Every time enough confirmed pivots exist, it tests the most recent 6 pivots (3 highs + 3 lows) against the rules a genuine 5-wave impulse must obey, and separately tests the most recent 3 pivots (2 of one type + 1 of the other) against the ratio a genuine A-B-C correction must obey. Only when a candidate survives every rule and every enabled filter does it become a confirmed pattern – at which point the indicator uses the pattern’s own geometry (the length of its completed legs) to project a Fibonacci-based entry, stop, and one or more targets, and shows a “Potential Reversal Zone” box marking where the next turn is statistically likely.

Read More »

Liquidity Delta Profiler Indicator

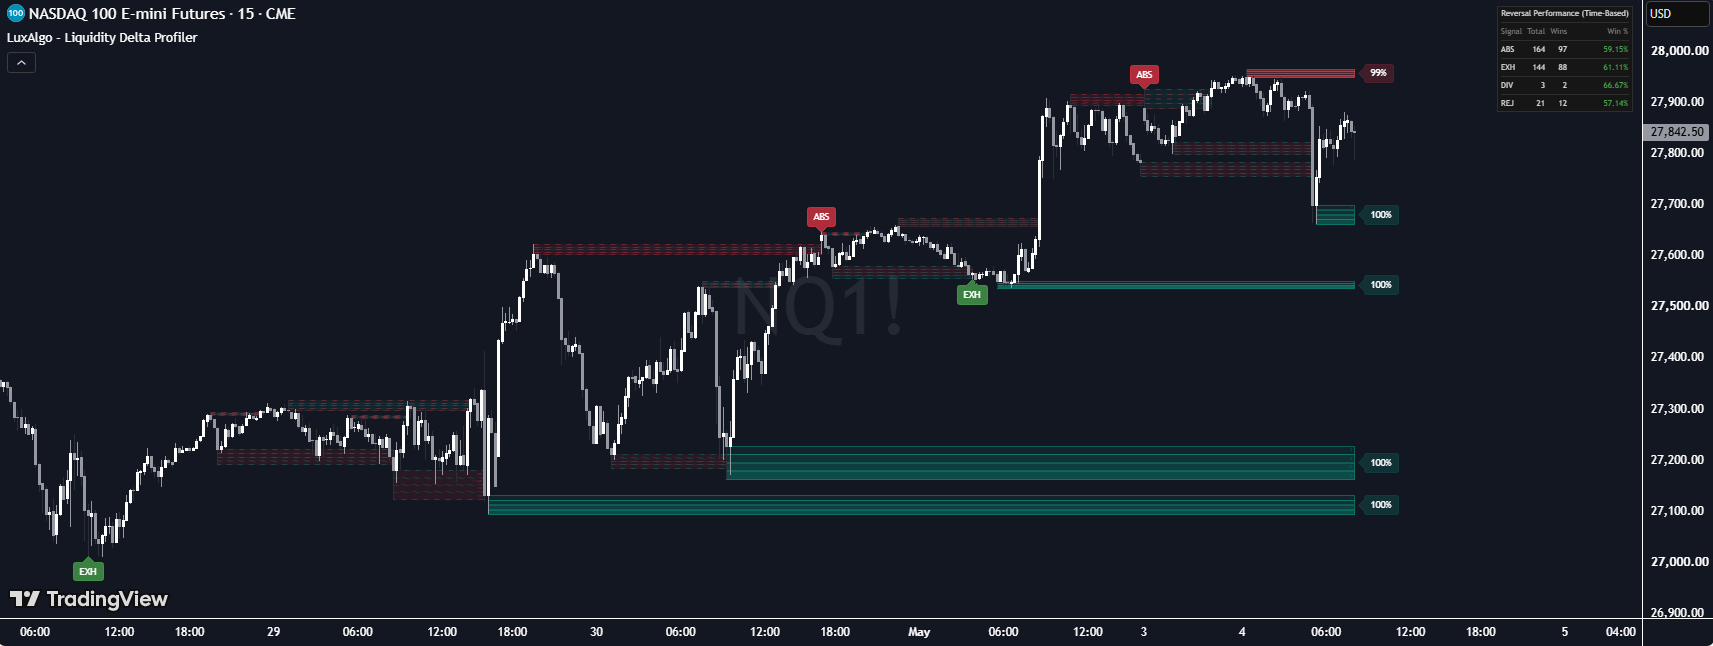
This indicator is built around a Smart Money Concepts idea: the wick above a swing high (or below a swing low) marks a pool of resting stop orders – “Buy-Side Liquidity” (BSL) above highs, “Sell-Side Liquidity” (SSL) below lows. Rather than treating that zone as a single flat level, it slices it into 4 horizontal quadrants and tracks, bar by bar, how much buy vs. sell volume actually traded inside each slice as price interacts with the zone. When price eventually sweeps through the zone, the pattern of volume across those 4 quadrants is analyzed to classify the sweep into one of 4 distinct reversal-signal types – and, unlike a typical indicator, each signal’s real outcome is then tracked forward in time and rolled into a live win-rate dashboard.

Read More »

HTF Candle Volume Profile Indicator – High Timeframe Volume Profile Strategy

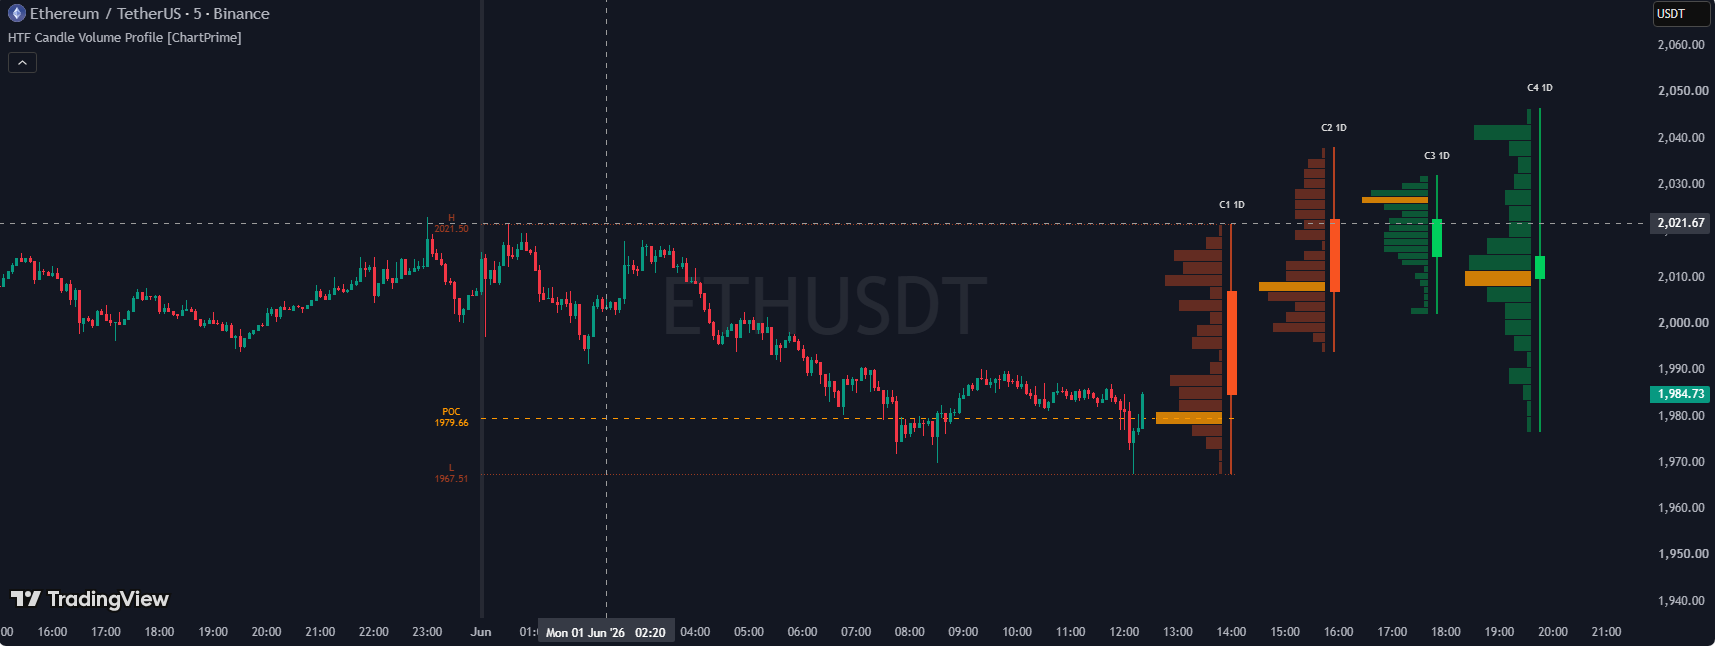
Traders often want to know “what does the Daily (or Weekly) candle look like right now?” while still watching a lower timeframe chart (like M15 or H1) – but switching timeframes back and forth breaks focus, and a full HTF candle plotted at its real historical width would be enormous on a low timeframe. This indicator solves that by synthesizing a small version of the last few Higher-Timeframe (HTF) candles and drawing them as compact shapes off to the side of the current price – like a mini “HTF dashboard” living on your normal chart.

Read More »

Retest Activity Range – Code2trade Strategy

Most range/zone indicators anchor themselves to price structure (a swing high, a swing low, a pattern). This one anchors itself to trading activity itself: it looks for bars where volume – not price – spikes above the volume of the surrounding bars. The idea is that a sudden burst of volume marks a moment when a disproportionate amount of trading interest concentrated at that price level, making the high/low of that single bar a meaningful boundary worth tracking going forward.

Read More »

Machine Learning RSI | AI Classification & Ranking – Retest Machine RSI Strategy

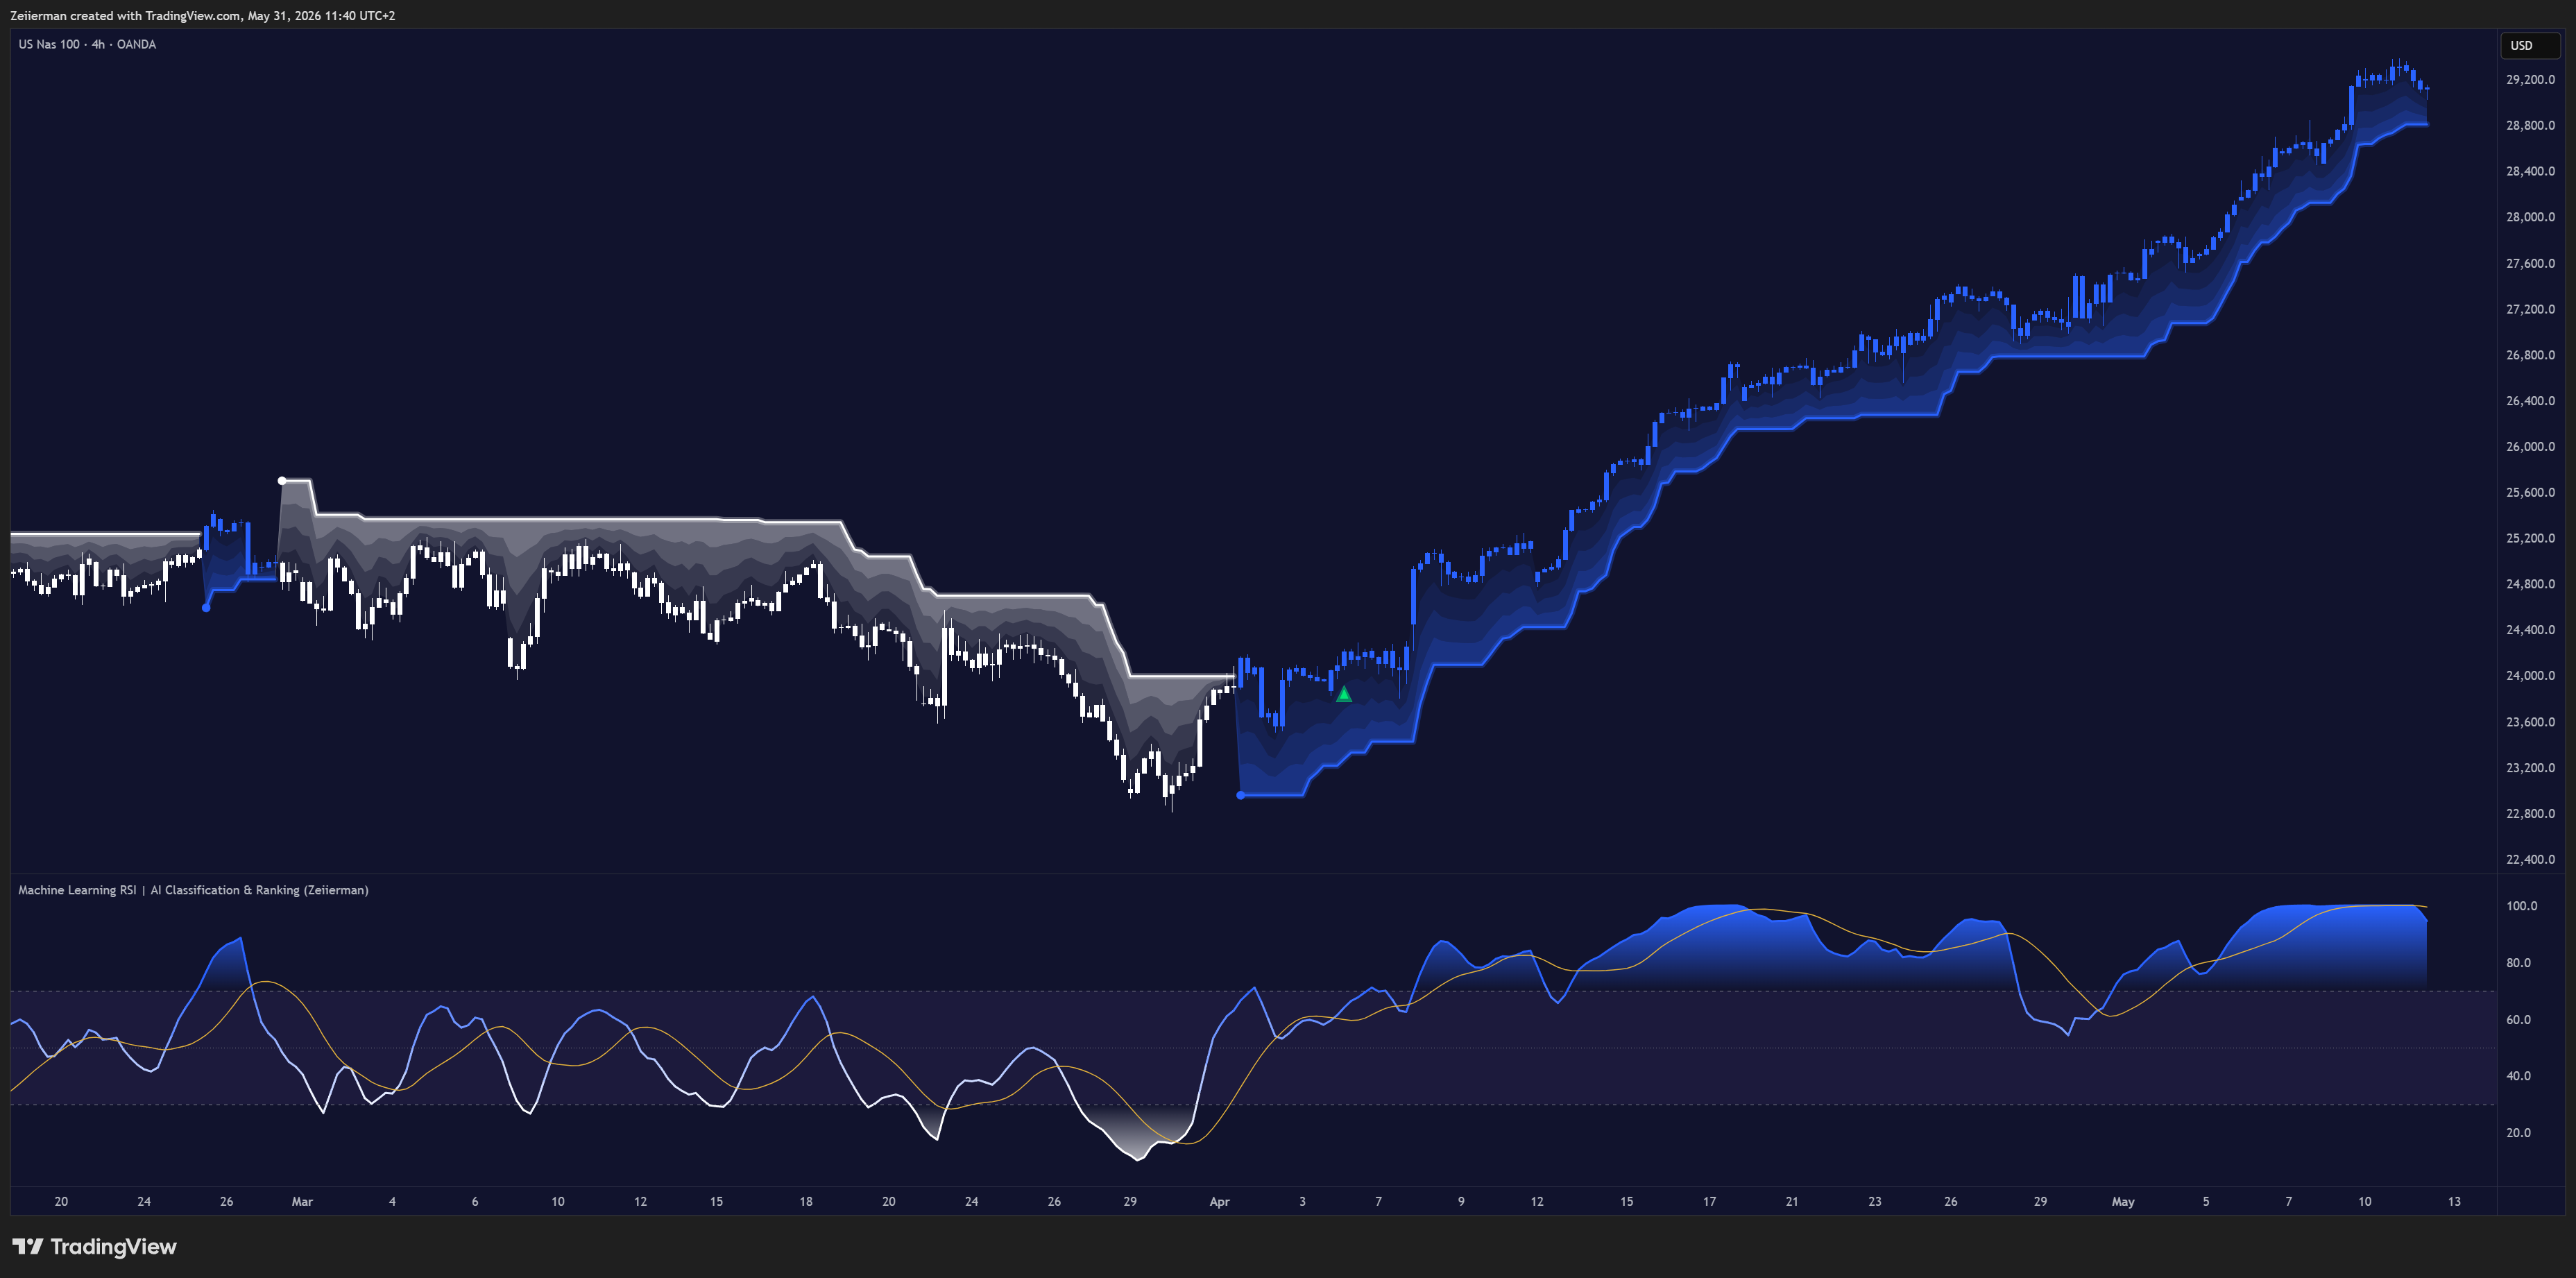
A classic RSI only tells you “momentum is at 72 right now.” This indicator asks a different question: “the last few times momentum looked like this, what actually happened next?” It is built on the same idea behind k-nearest-neighbor (k-NN) machine learning: describe every bar with a small set of numeric traits (“features”), keep a running memory of thousands of past bars’ traits together with what price actually did afterward, and when a new bar arrives, find the historical bars that looked most alike and let their real outcomes vote on what’s likely to happen this time.

Read More »

Ranked Order Block Indicator 

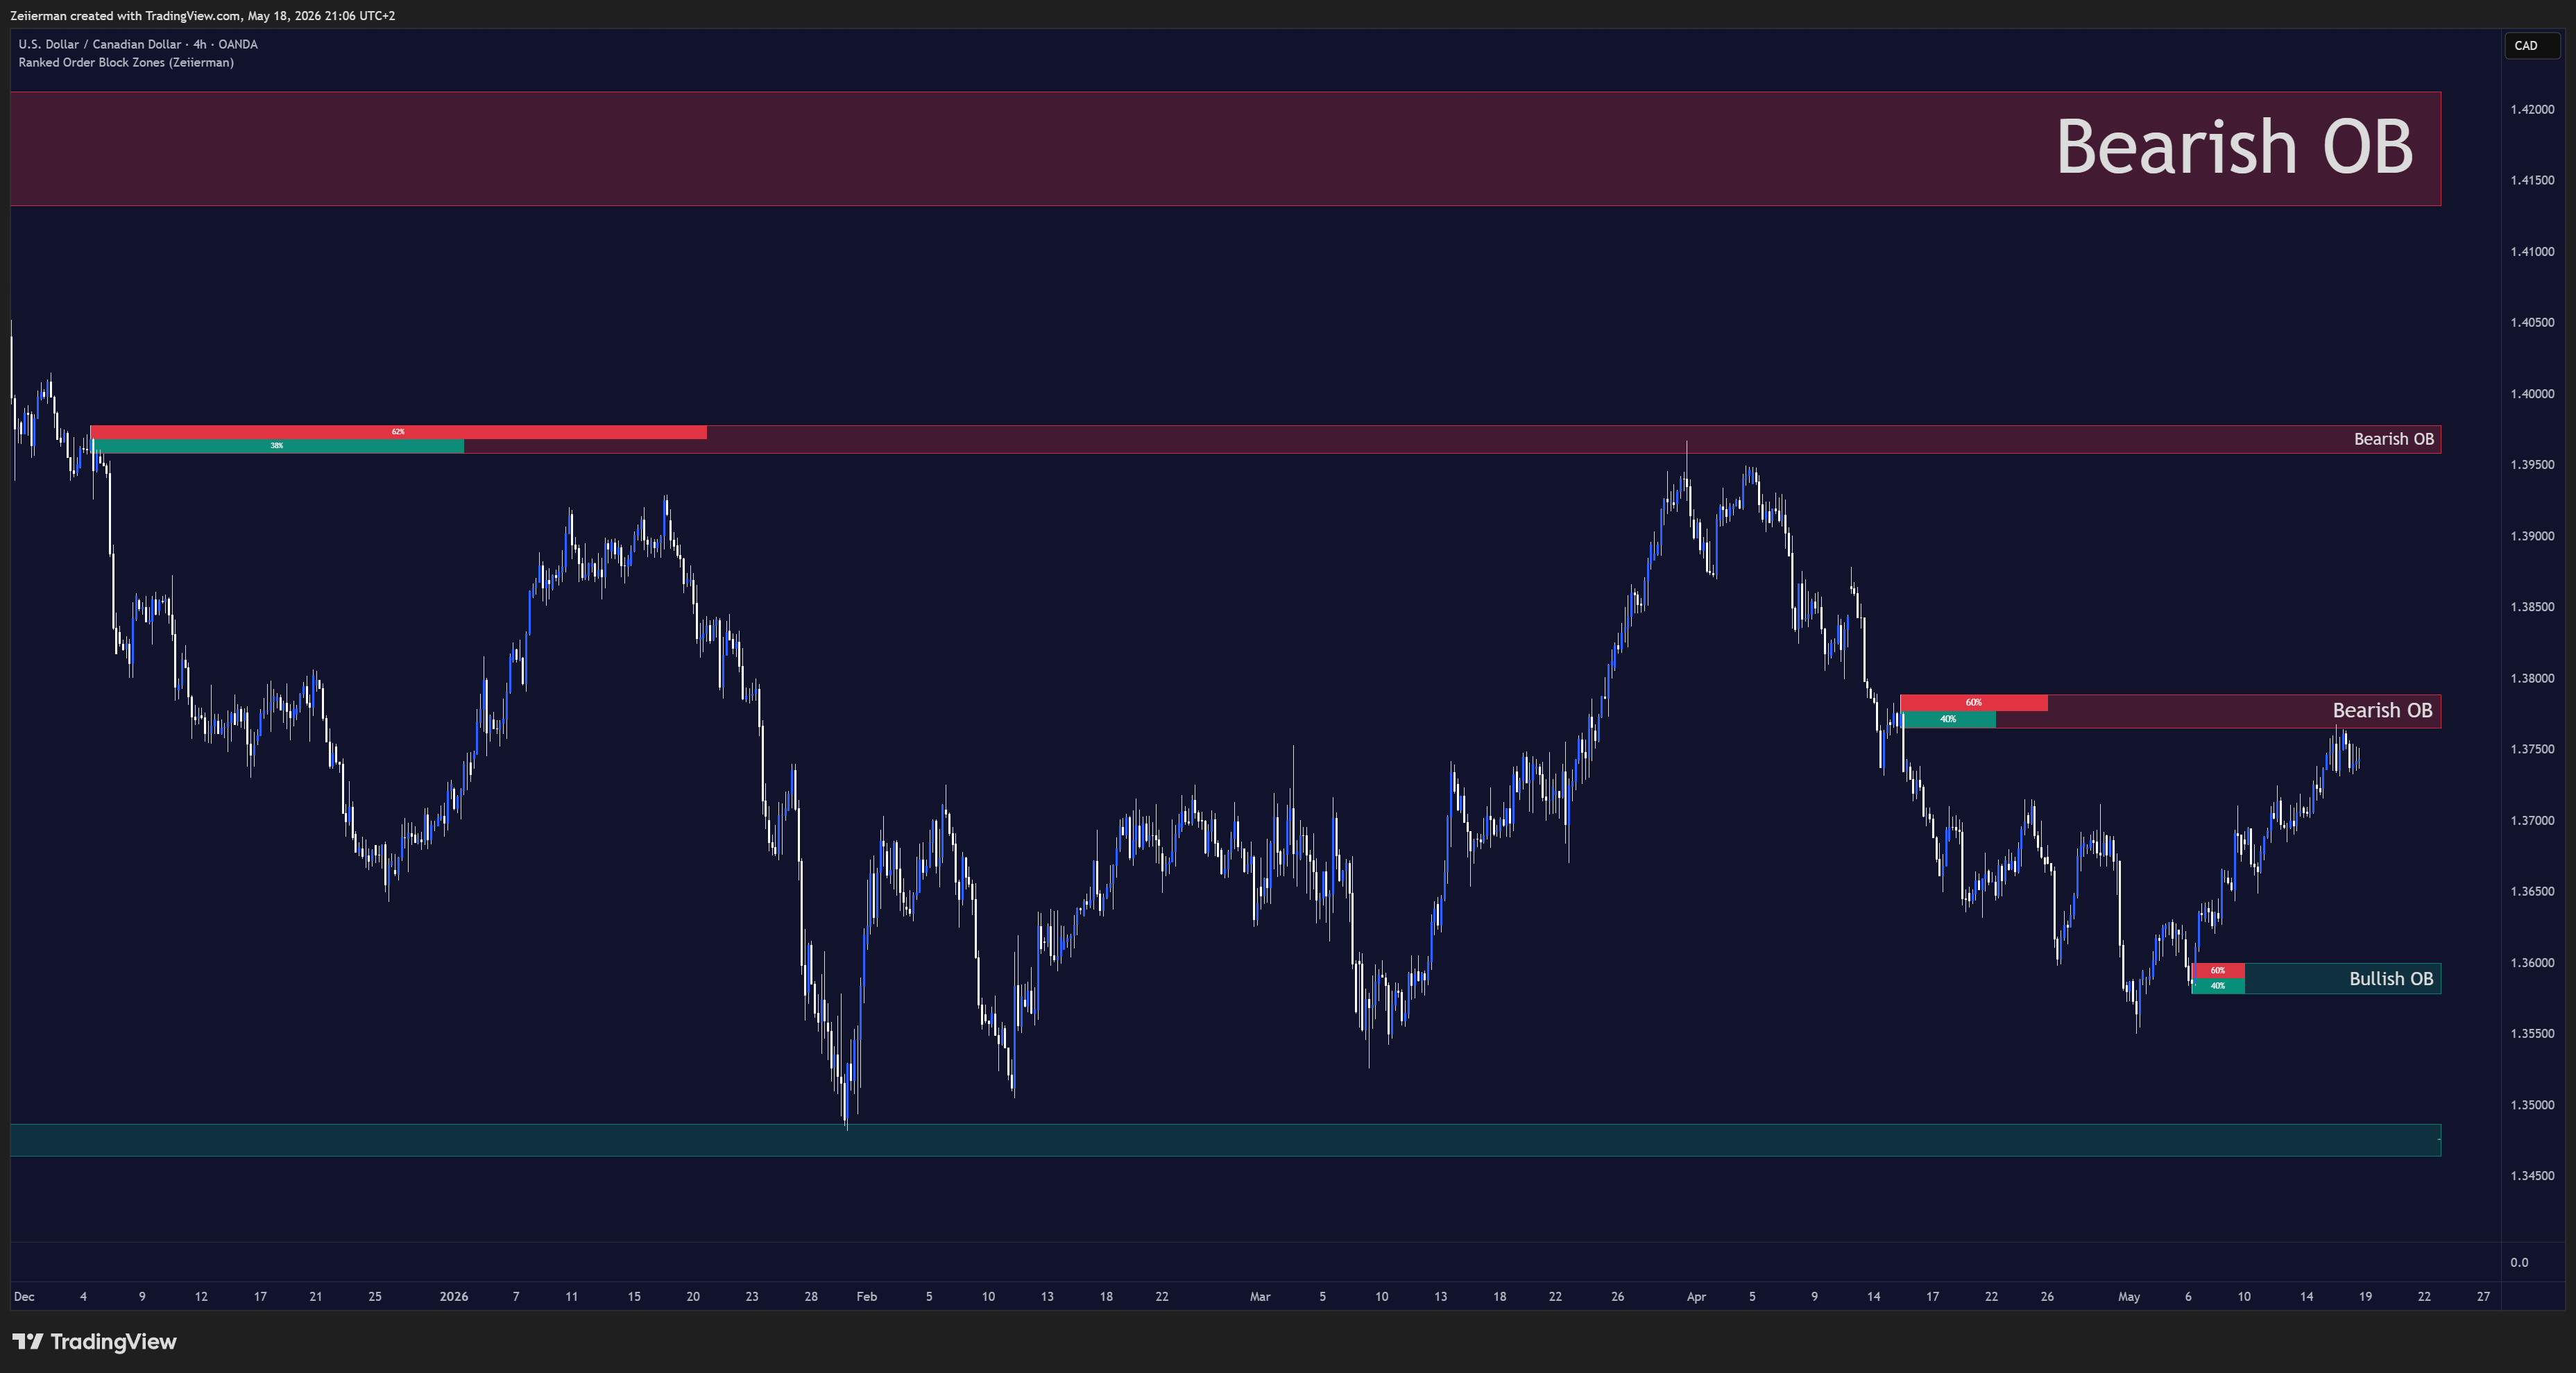
An Order Block (OB) is a Smart Money Concepts (SMC) idea: the last opposite-colored candle right before a strong, decisive “flip” candle is believed to mark the exact spot where large players placed their orders just before pushing price hard in the other direction. Because a portion of those large orders is theorized to remain unfilled, price is expected to react again when it revisits that same candle’s range later on.

Read More »

Ranked Support And Resistance Indicator

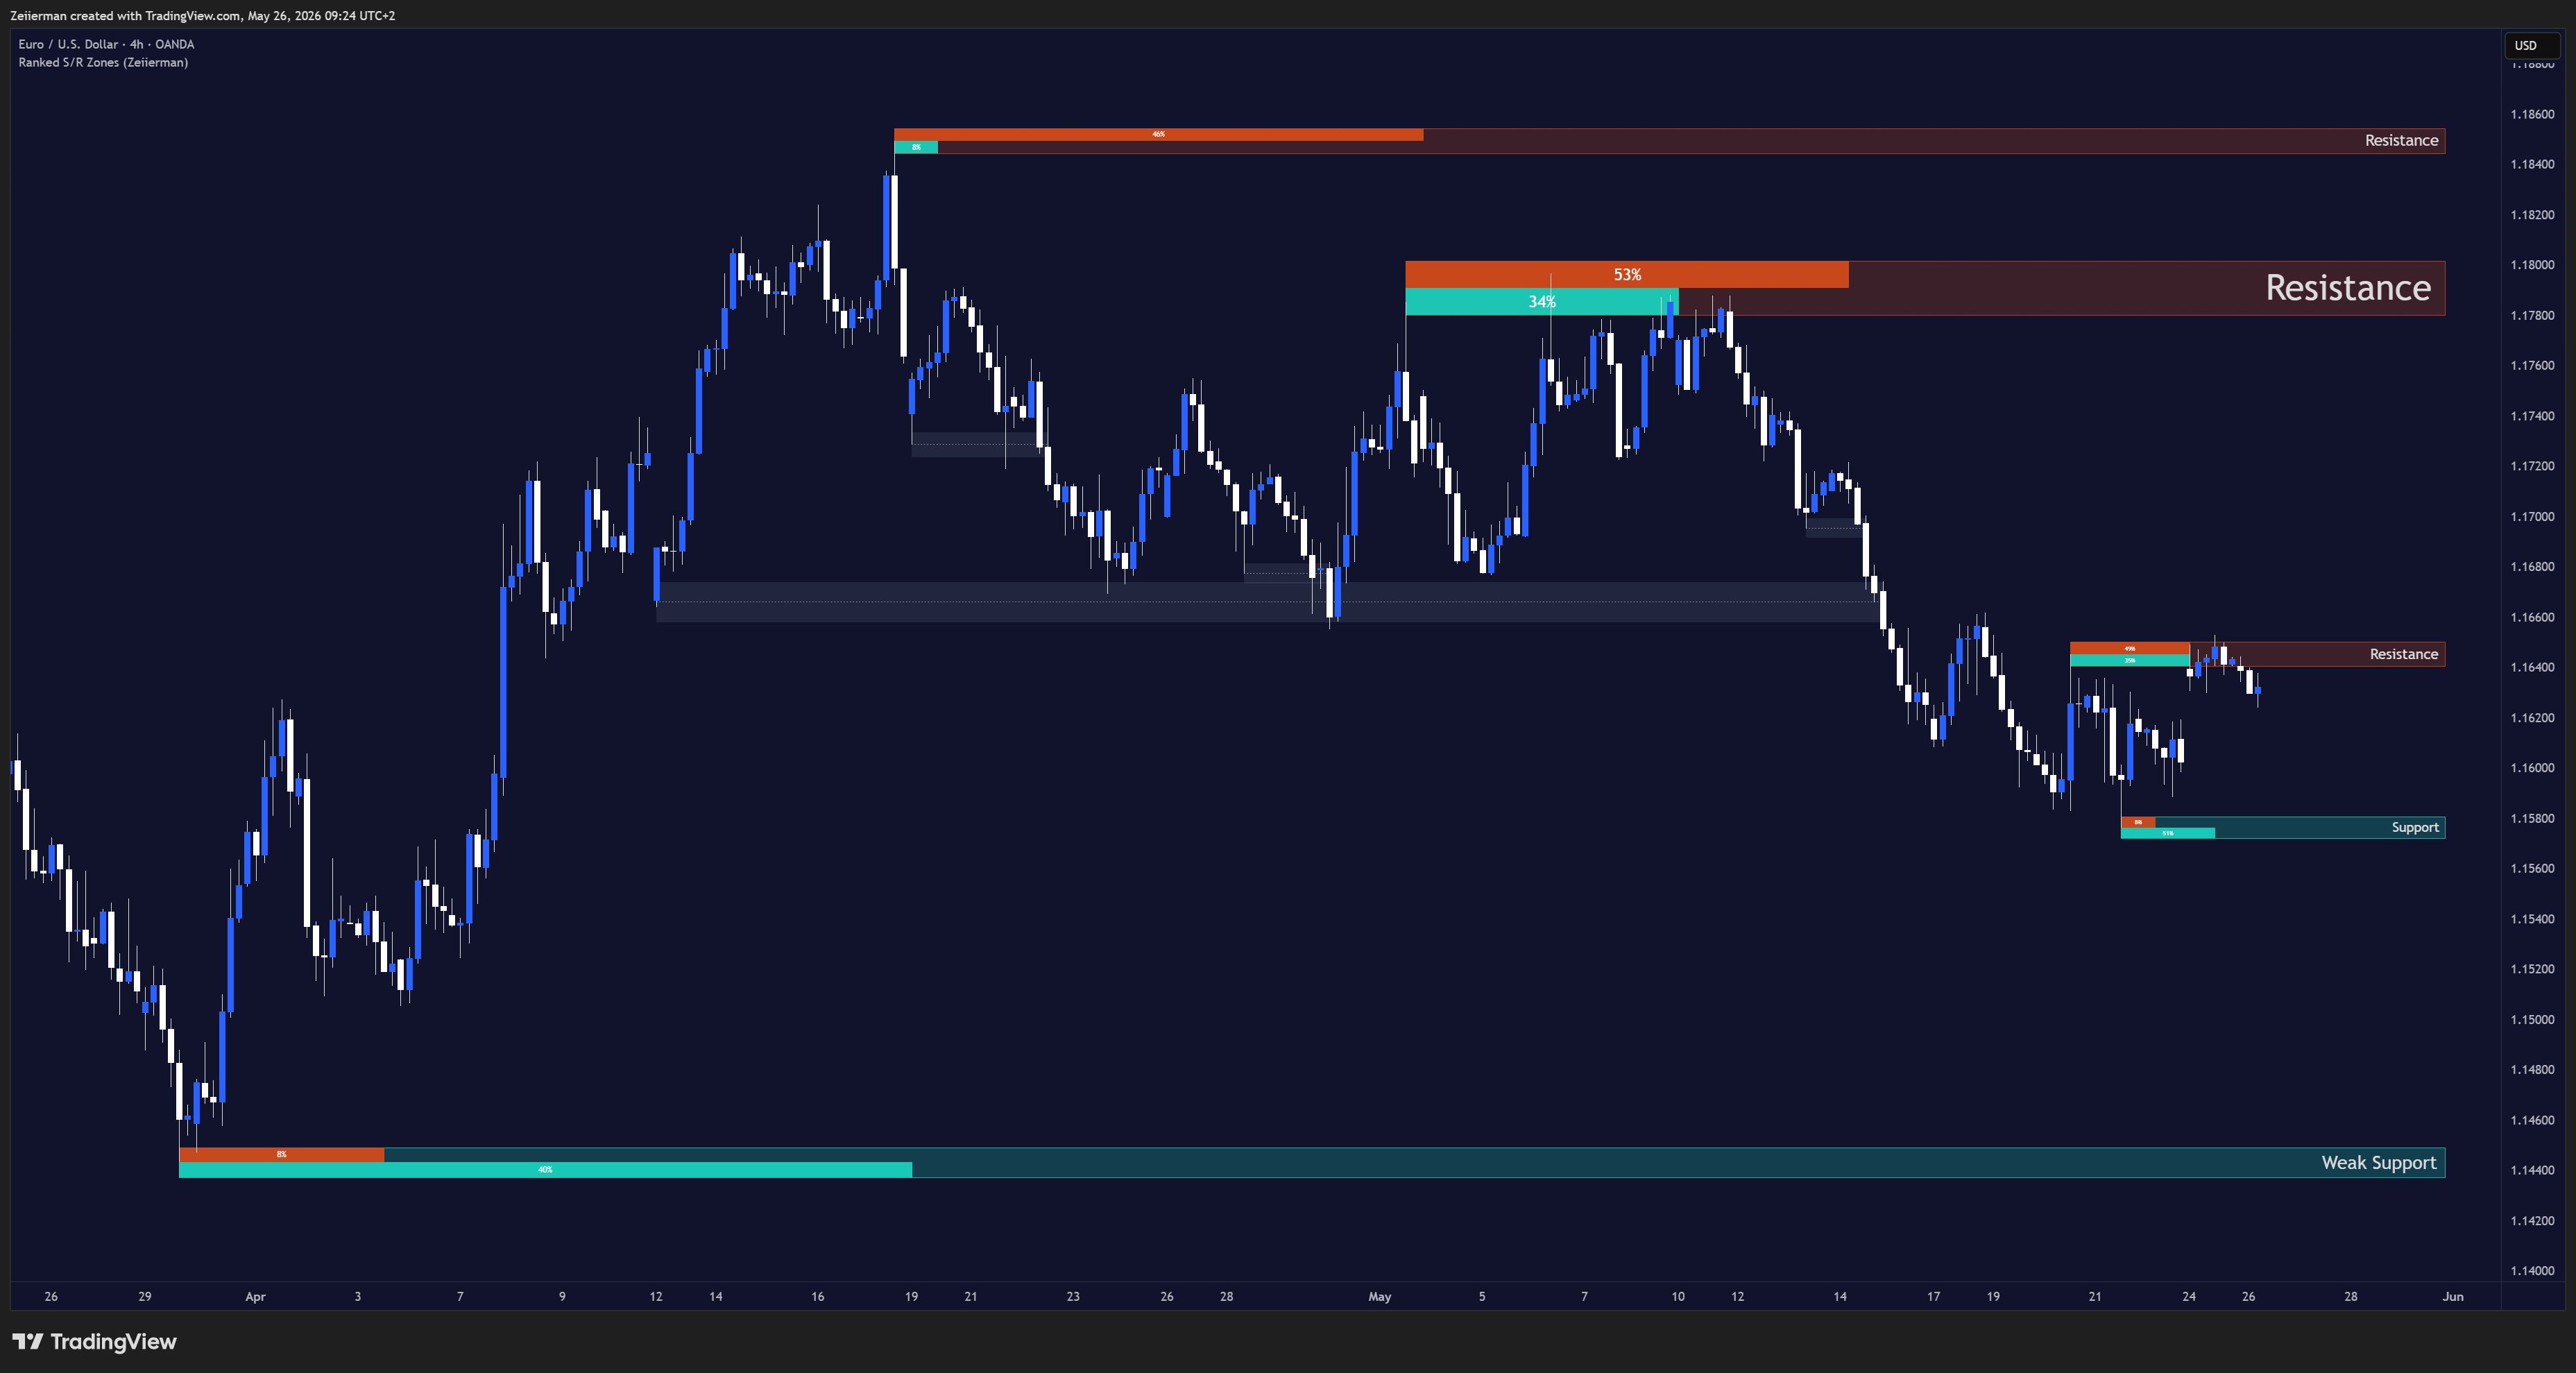
Most support/resistance (S/R) indicators simply mark every swing high and swing low as a level, leaving the chart cluttered with dozens of lines of unknown quality. This indicator is built on a different idea: not every S/R zone deserves equal attention. A zone that formed on high volume, aligns with the prevailing trend, was born from a sharp/clean swing, and has already proven itself by being touched and defended multiple times, is structurally more important than a random pivot that appeared once and was never revisited.

Read More »