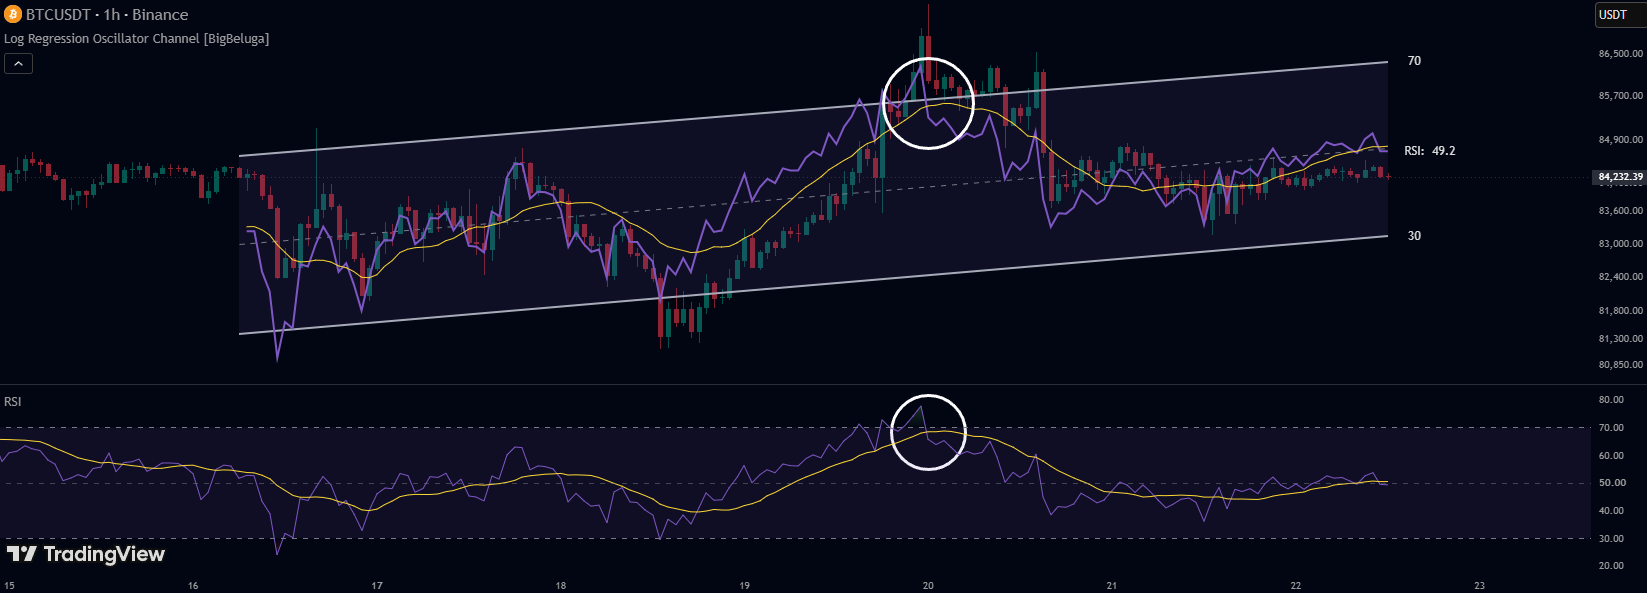
Log Regression Oscillator Channel Indicator – Strategy
Log Regression Oscillator Channel indicator: the indicator fits a sloping channel to the last 150 candles. How it works, settings and strategy logic.
Log Regression Oscillator Channel indicator: the indicator fits a sloping channel to the last 150 candles. How it works, settings and strategy logic.
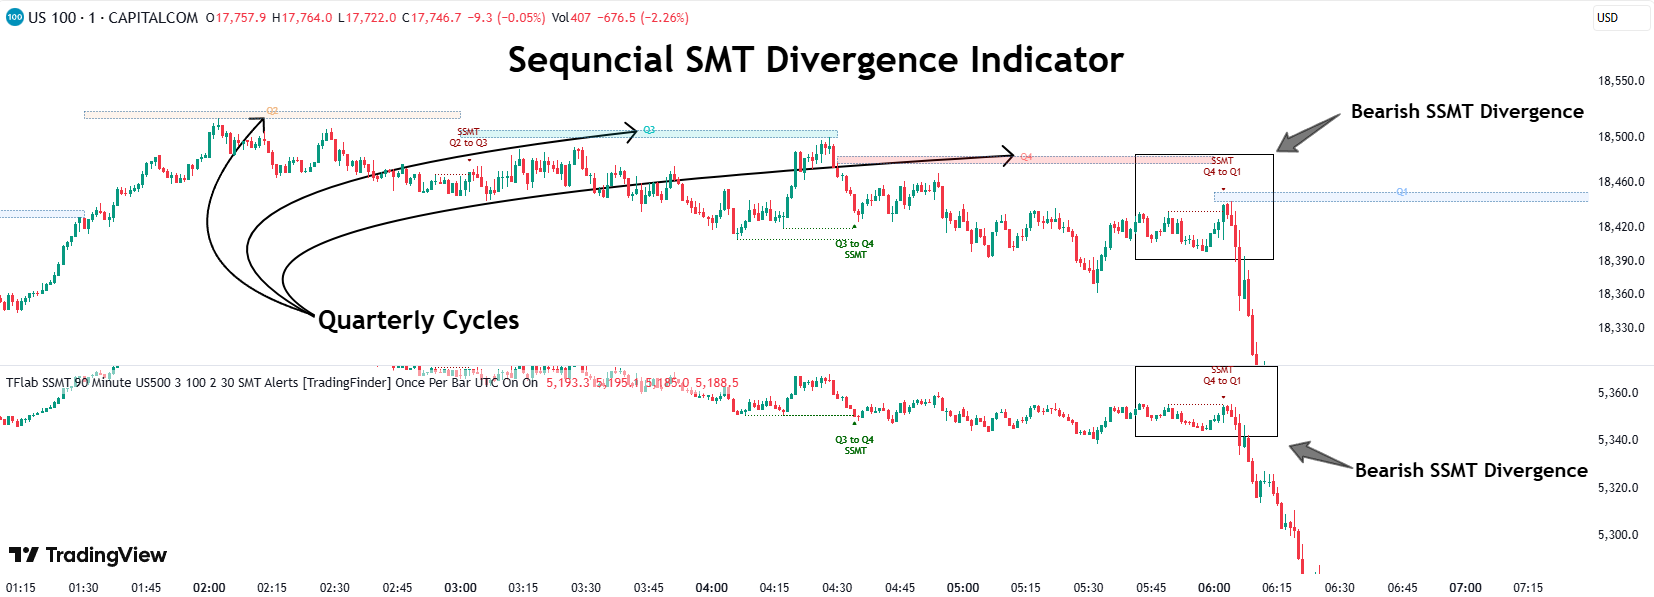
Quarterly Theory ICT SSMT indicator for TradingView: how it works, settings, signals and strategy logic.
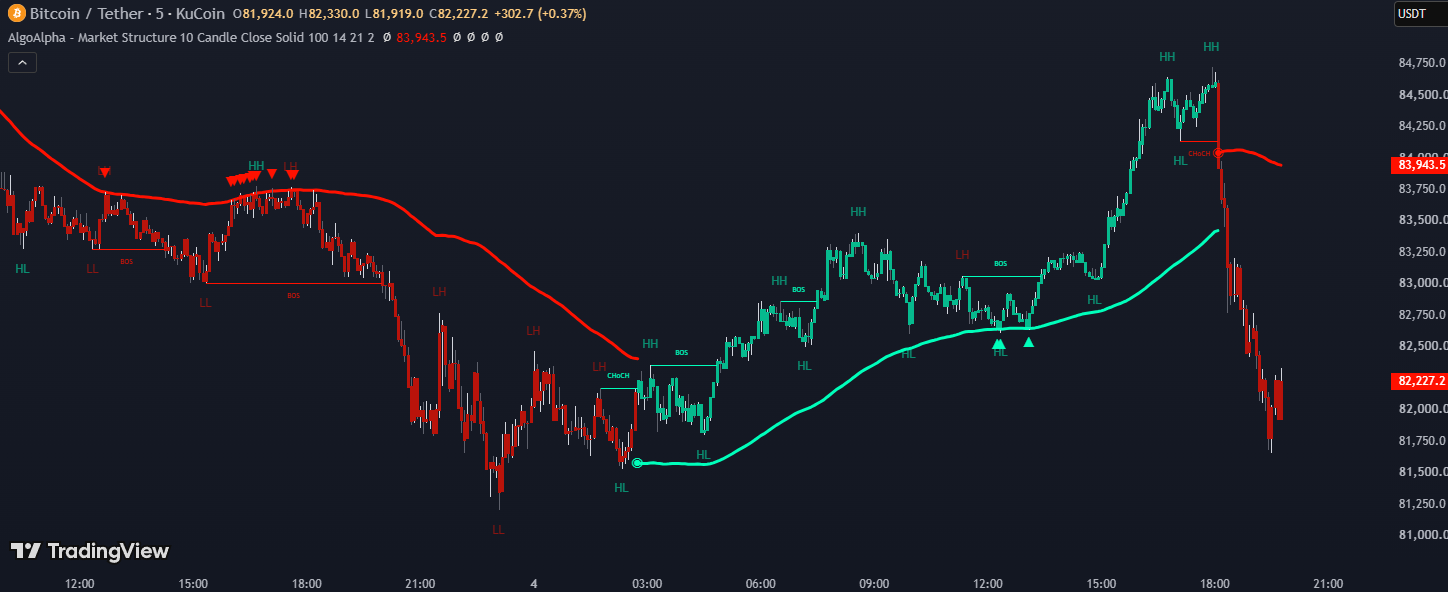
Market Structure Confluence indicator: the indicator finds swing highs and lows, marks every Break of Structure and Change of Character.
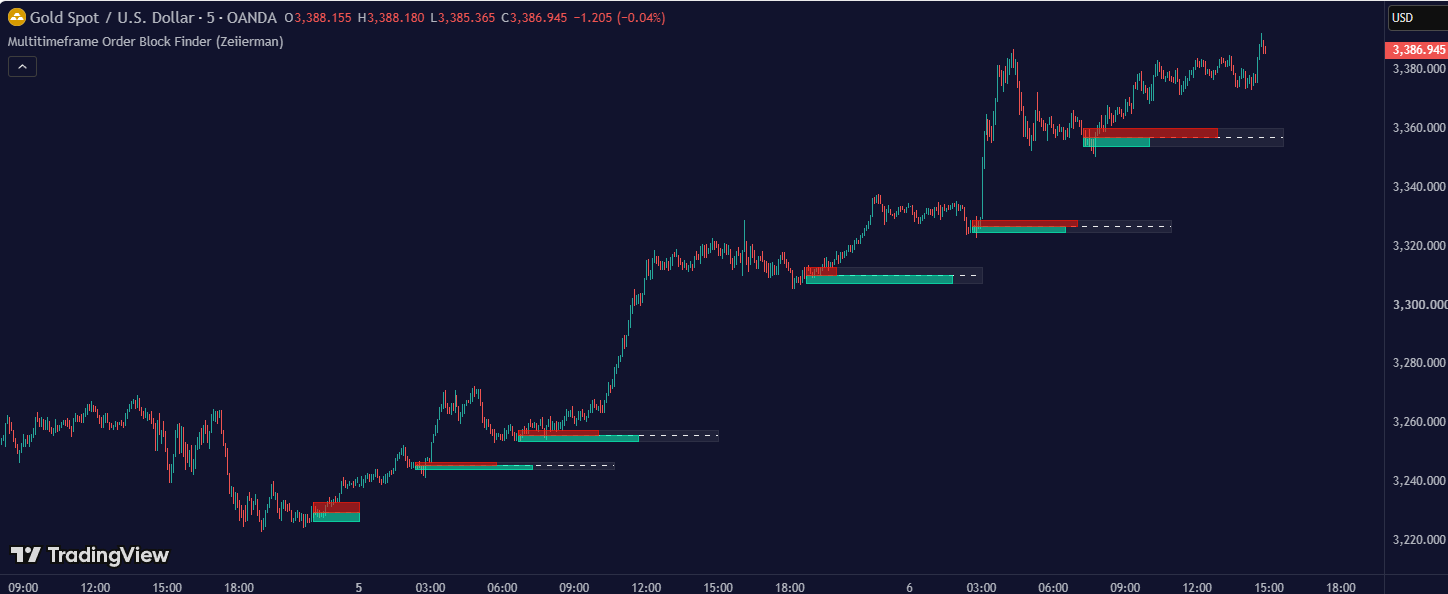
Multitimeframe Order Block Finder: reads a chosen timeframe and marks order blocks after runs of same-colour candles. How it works and settings.
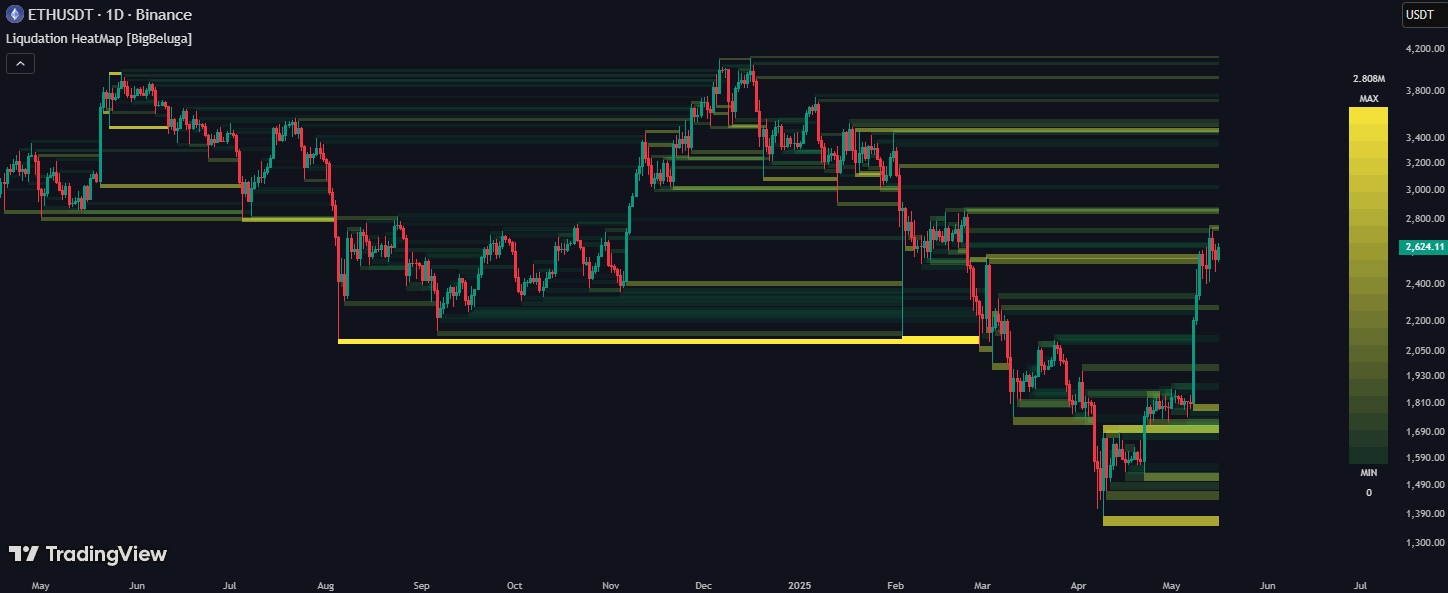
Liquidation HeatMap indicator: a “liquidity heat” map: the indicator finds swing highs and swing lows. How it works, settings and strategy logic.
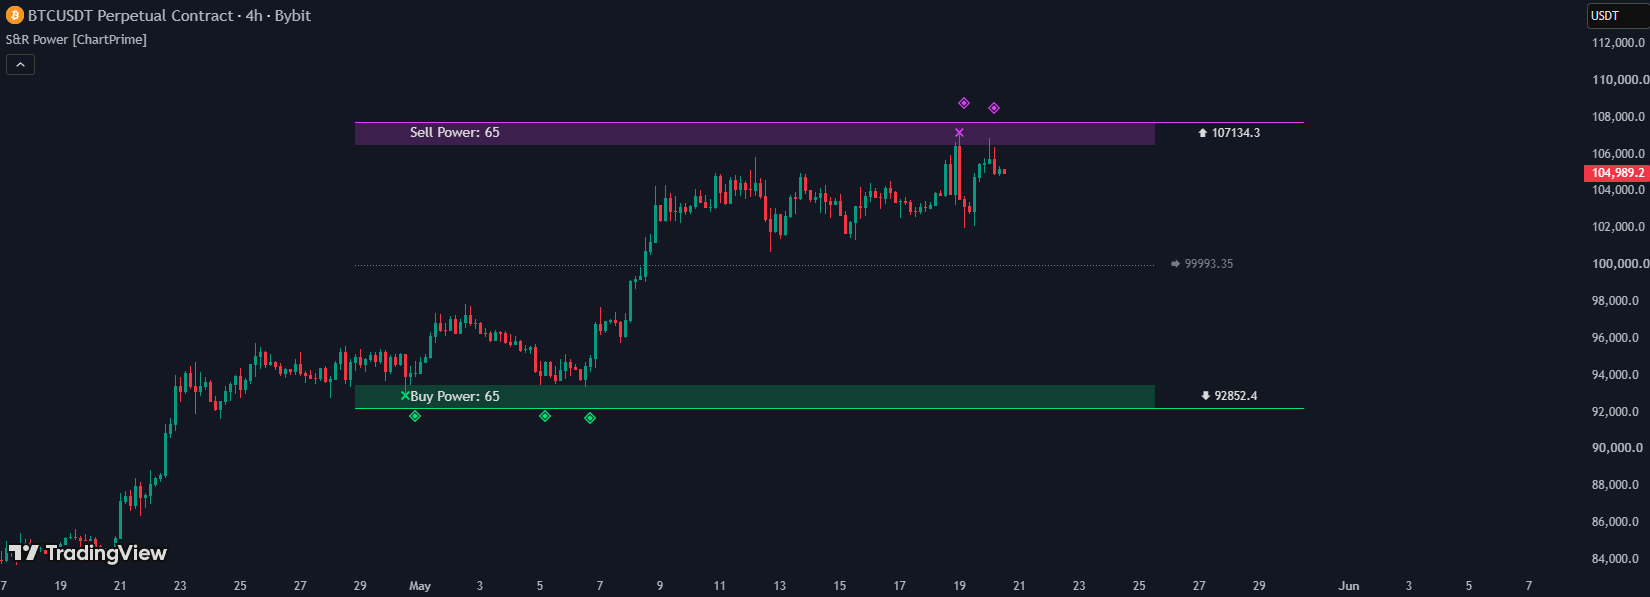
A “liquidity heat” map: the indicator finds swing highs and swing lows, parks a thin horizontal band right beyond each of them, and shades the band from faint lime to bright yellow according to how much volume traded on the pivot candle. A band stays alive until price cuts through its middle line.
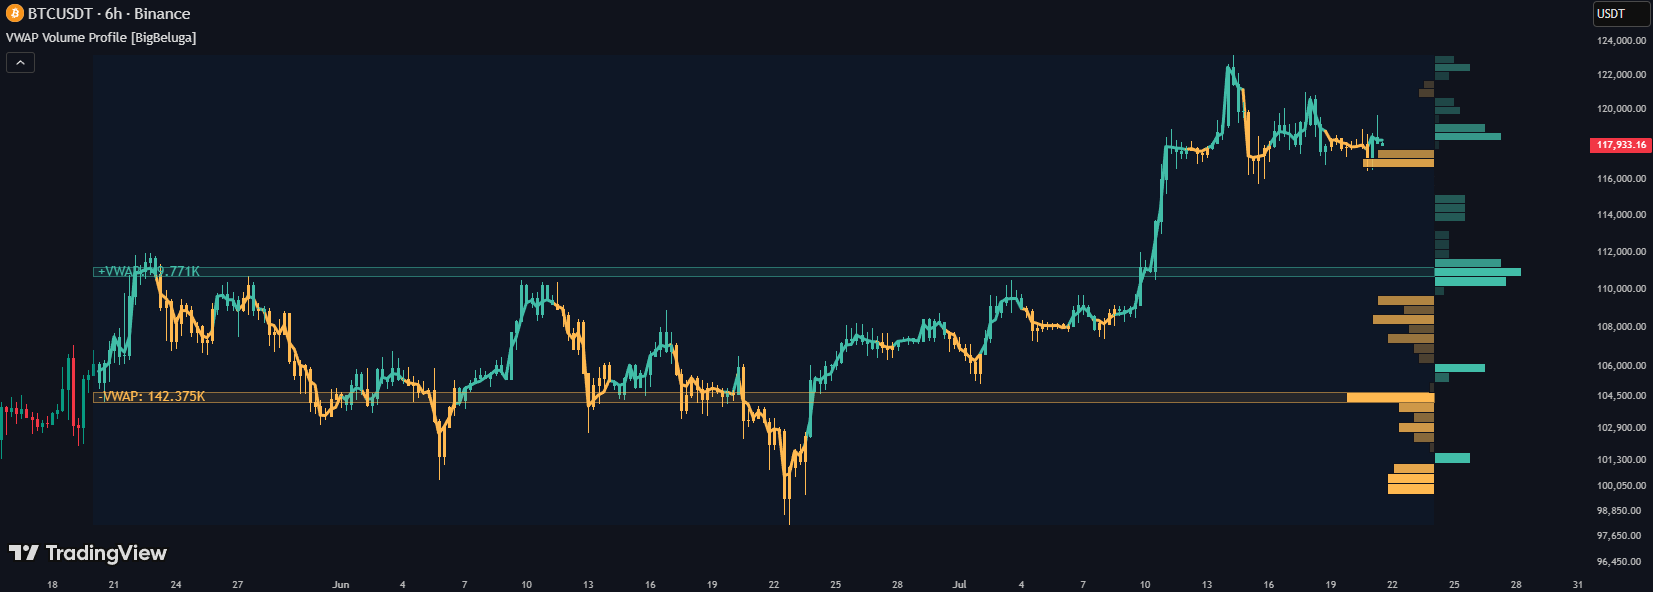
VWAP Volume Profile indicator: a two-sided volume profile built on the VWAP line instead of price. How it works, settings and strategy logic.
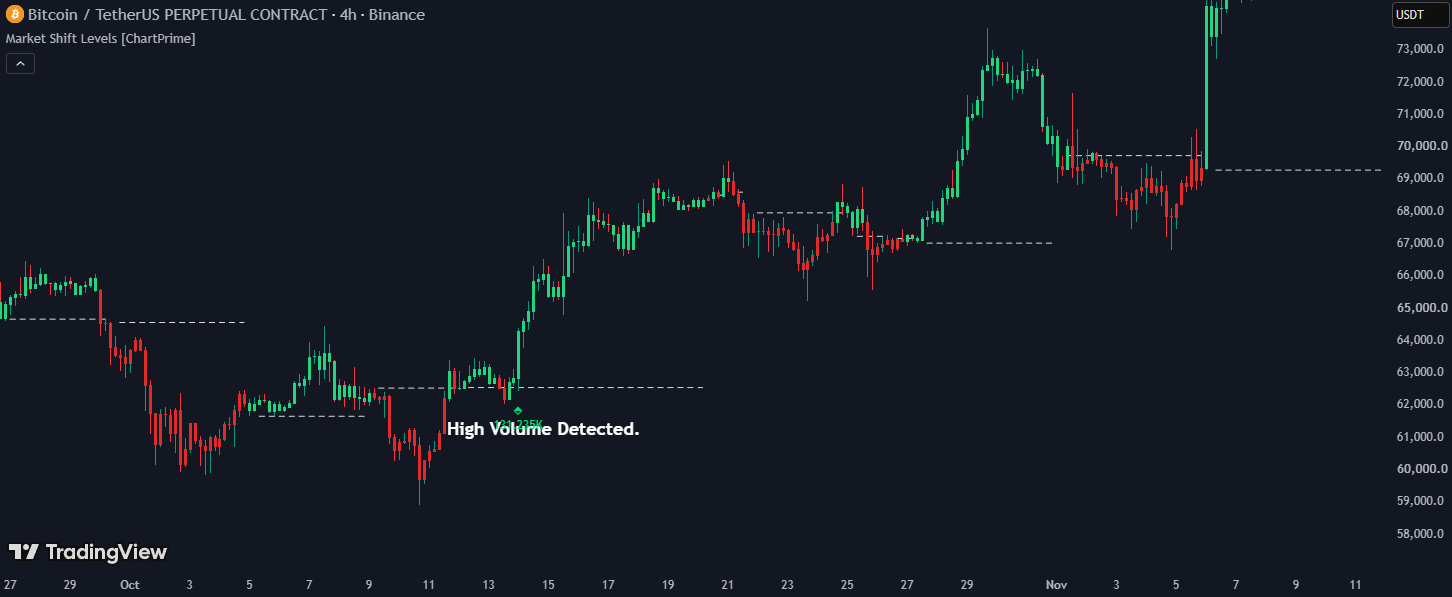
Market Shift Levels indicator for TradingView: how it works, settings, signals and strategy logic.
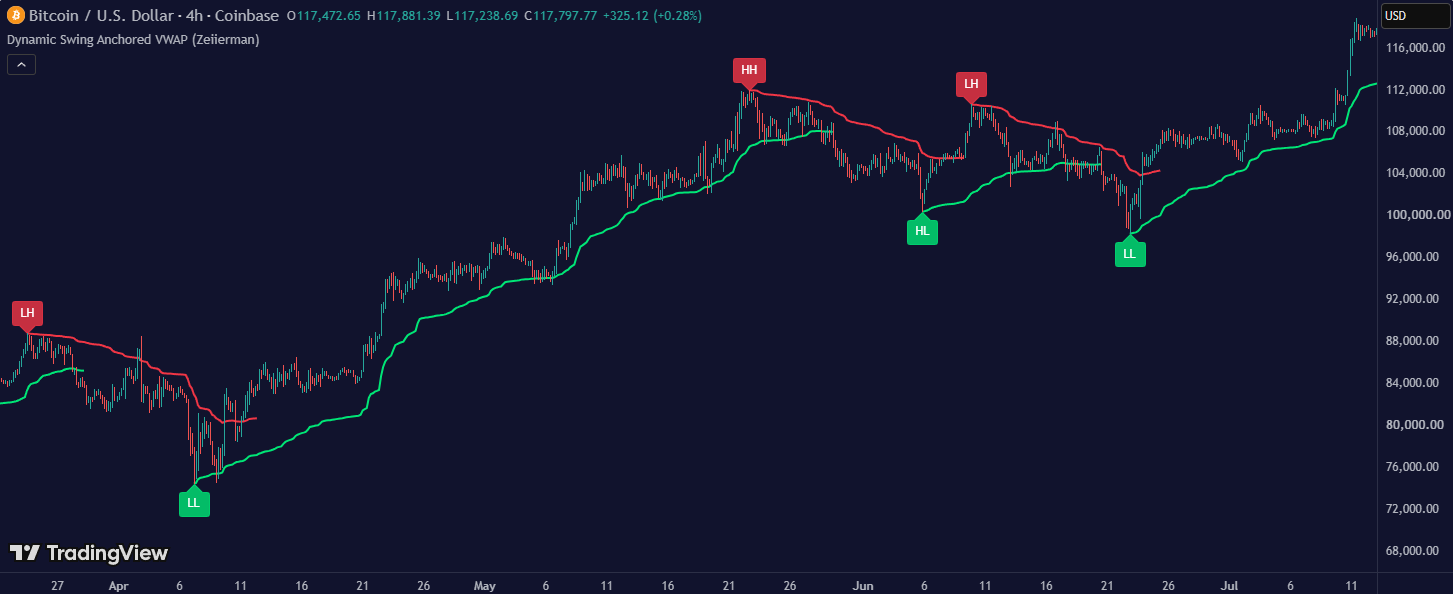
Dynamic Swing Anchored VWAP indicator: Automatically anchors a VWAP line to the most recent swing reversal point. How it works, settings and strategy logic.
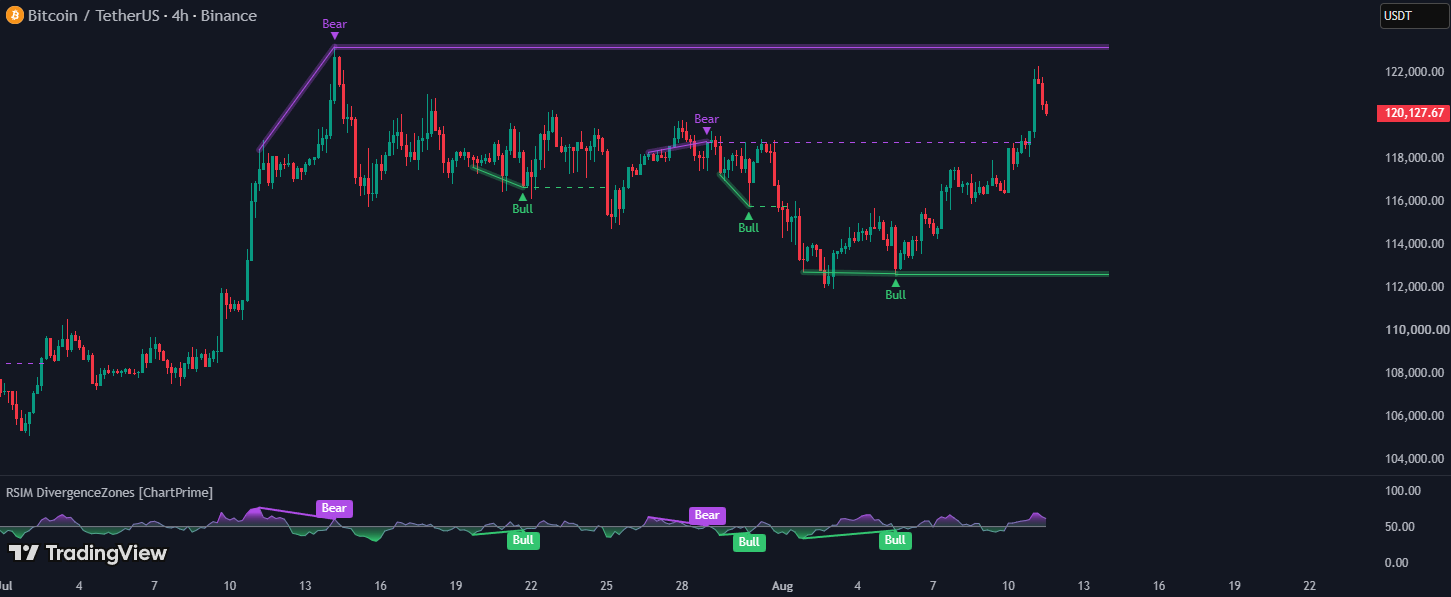
RSI Momentum Divergence Zones indicator: finds divergences between price and an unusual RSI. How it works, settings and strategy logic.