Skip to content
  • Home
  • Service
    • Zero2Hero Course
    • Code on Demand
  • Products
    • C2T Indicators
    • C2T Strategies
  • Tools
    • Indicator Merger
    • Signal Spy Bot
    • Strategy Tester
    • Trading Journal Bot
    • Tradingview 2 Telegram
  • Blog
    • Indicators Insider
    • Signal Spy
    • Trading Journal
    • Macro Scope
    • Off the chart
    • Trading Platform Tips
  • Contact
  • English
  • Tiếng Việt
  • Home
  • Service
    • Zero2Hero Course
    • Code on Demand
  • Products
    • C2T Indicators
    • C2T Strategies
  • Tools
    • Indicator Merger
    • Signal Spy Bot
    • Strategy Tester
    • Trading Journal Bot
    • Tradingview 2 Telegram
  • Blog
    • Indicators Insider
    • Signal Spy
    • Trading Journal
    • Macro Scope
    • Off the chart
    • Trading Platform Tips
  • Contact
  • English
  • Tiếng Việt
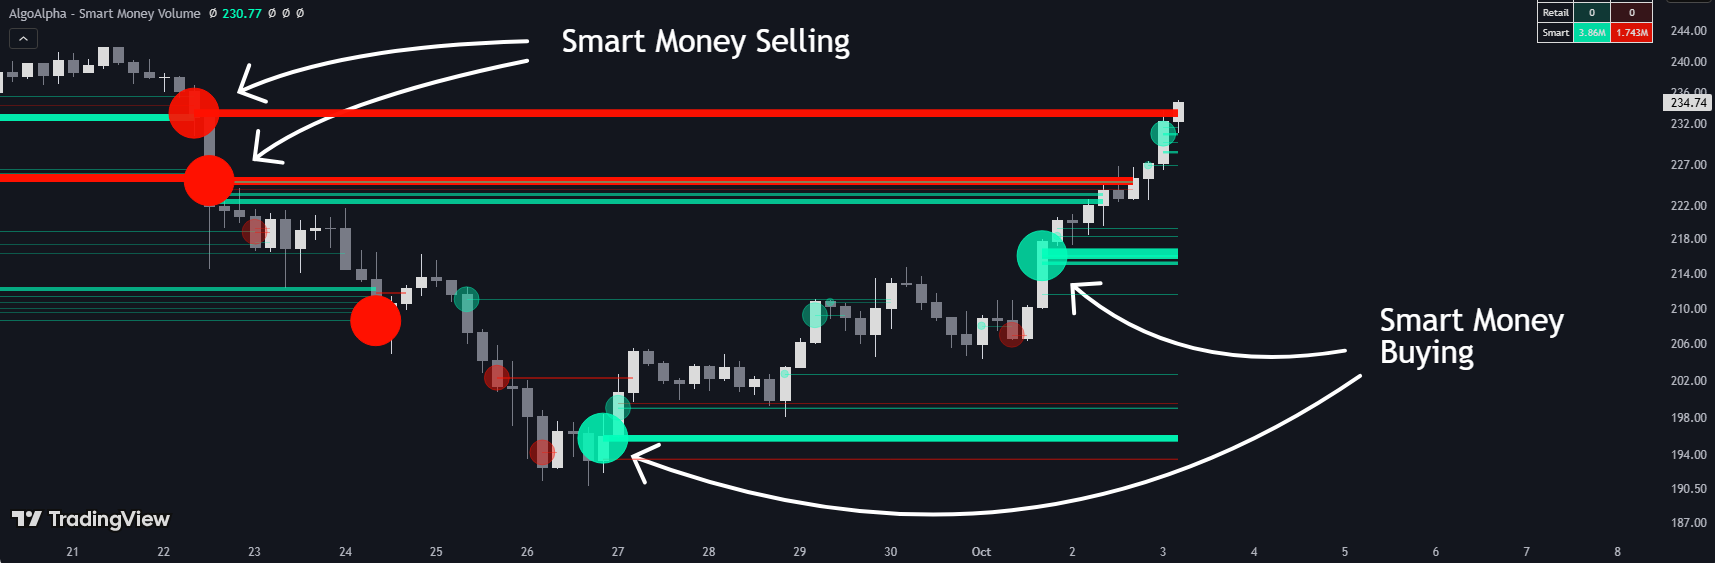
Chỉ báo Smart Money Volume Activity trên chart TradingView (ảnh 1)

Smart Money Volume Activity Indicator – Strategy

Smart Money Volume Activity indicator: an indicator that decomposes each chart candle into lower-timeframe volume. How it works, settings and strategy logic.
Read More »
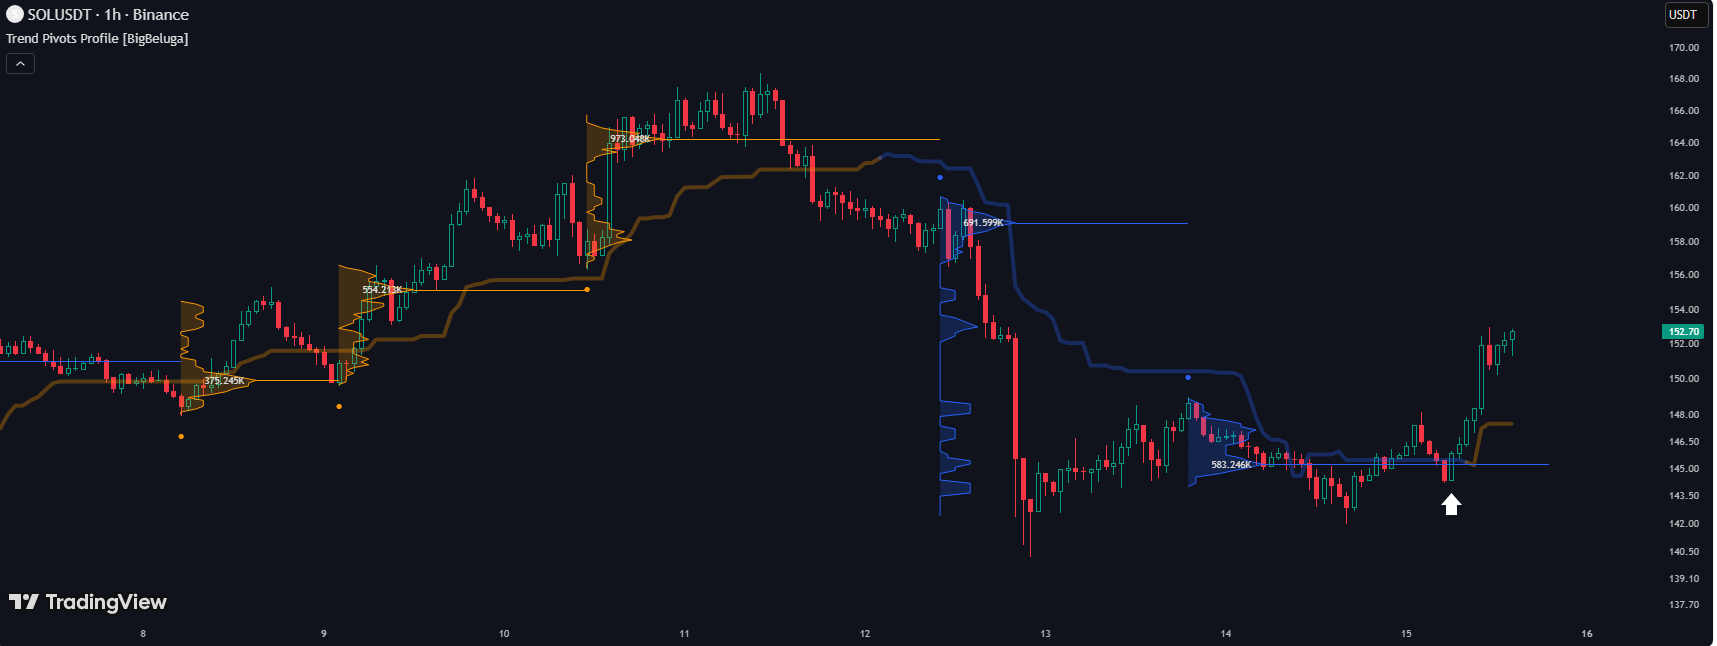
Chỉ báo Trend Pivots Profile trên chart TradingView (ảnh 1)

Trend Pivots Profile Indicator – Strategy

Trend Pivots Profile indicator: Draws a separate volume profile for each swing between two pivot reversal points. How it works, settings and strategy logic.
Read More »
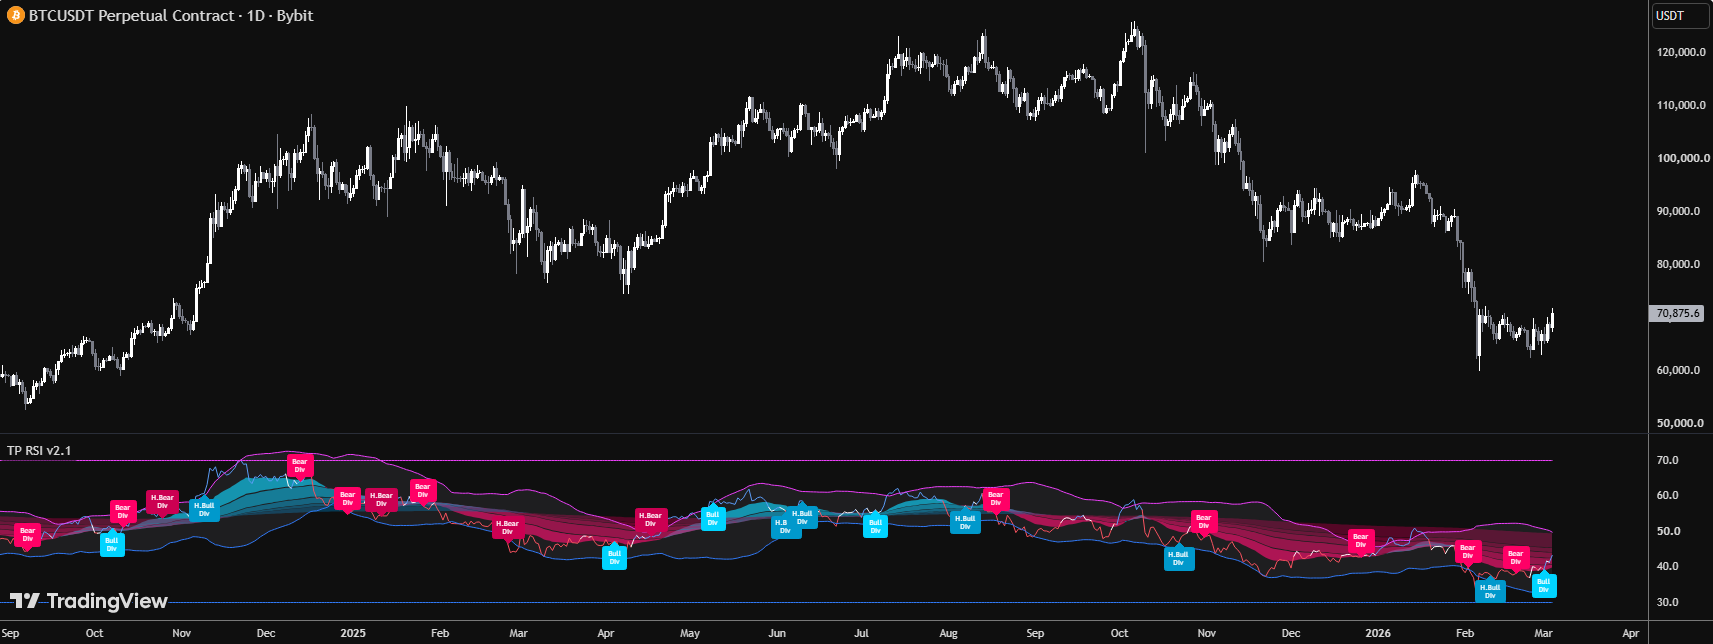
Chỉ báo TP RSI trên chart TradingView (ảnh 1)

TP RSI Indicator – Strategy

TP RSI indicator: an extended RSI: an adaptive neutral zone based on the RSI’s own volatility. How it works, settings and strategy logic.
Read More »
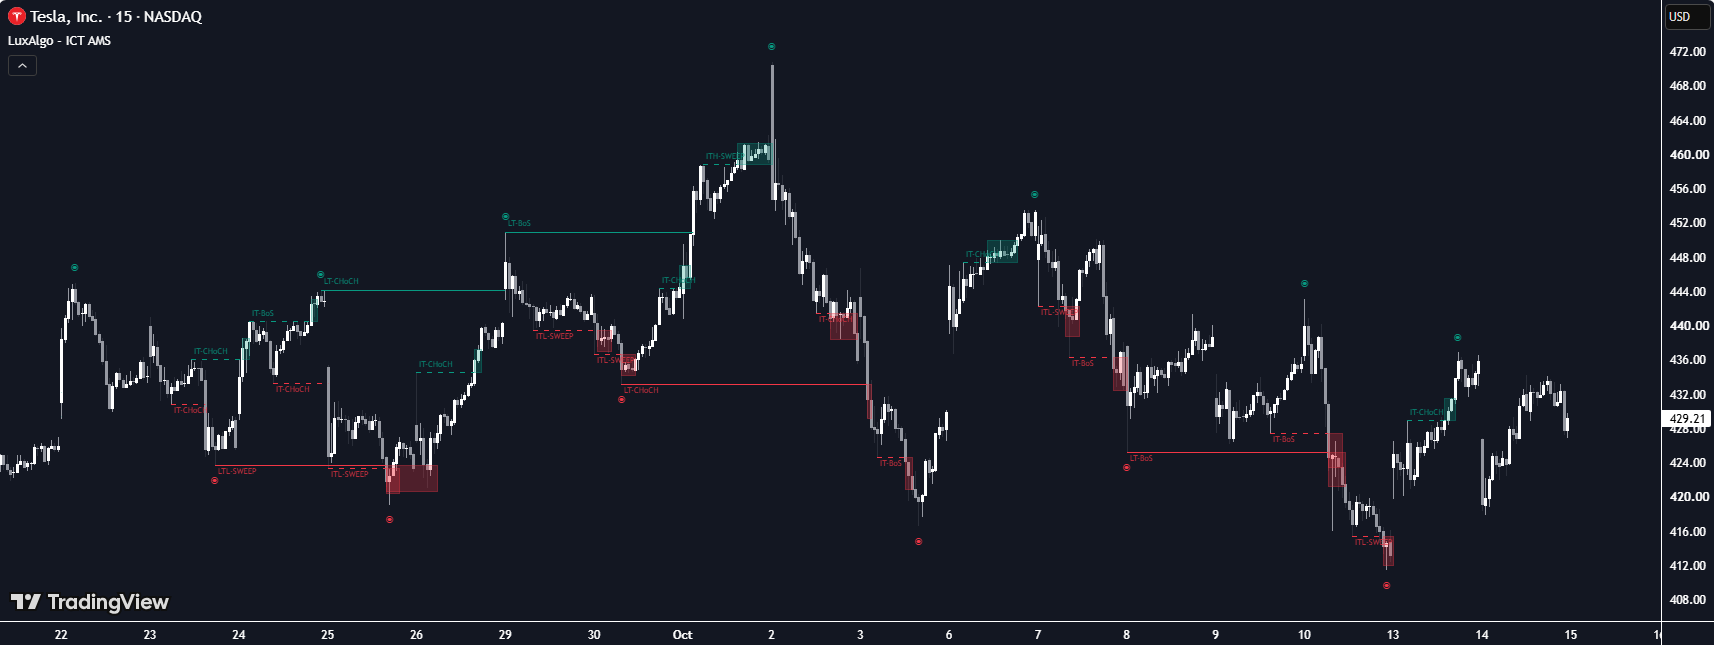
Chỉ báo ICT Anchored Market Structures with Validation trên chart TradingView (ảnh 1)

ICT Anchored Market Structures with Validation Indicator – Strategy

ICT Anchored Market Structures with Validation indicator: an ICT indicator that tracks market structure across 3 nested tiers. How it works and settings.
Read More »
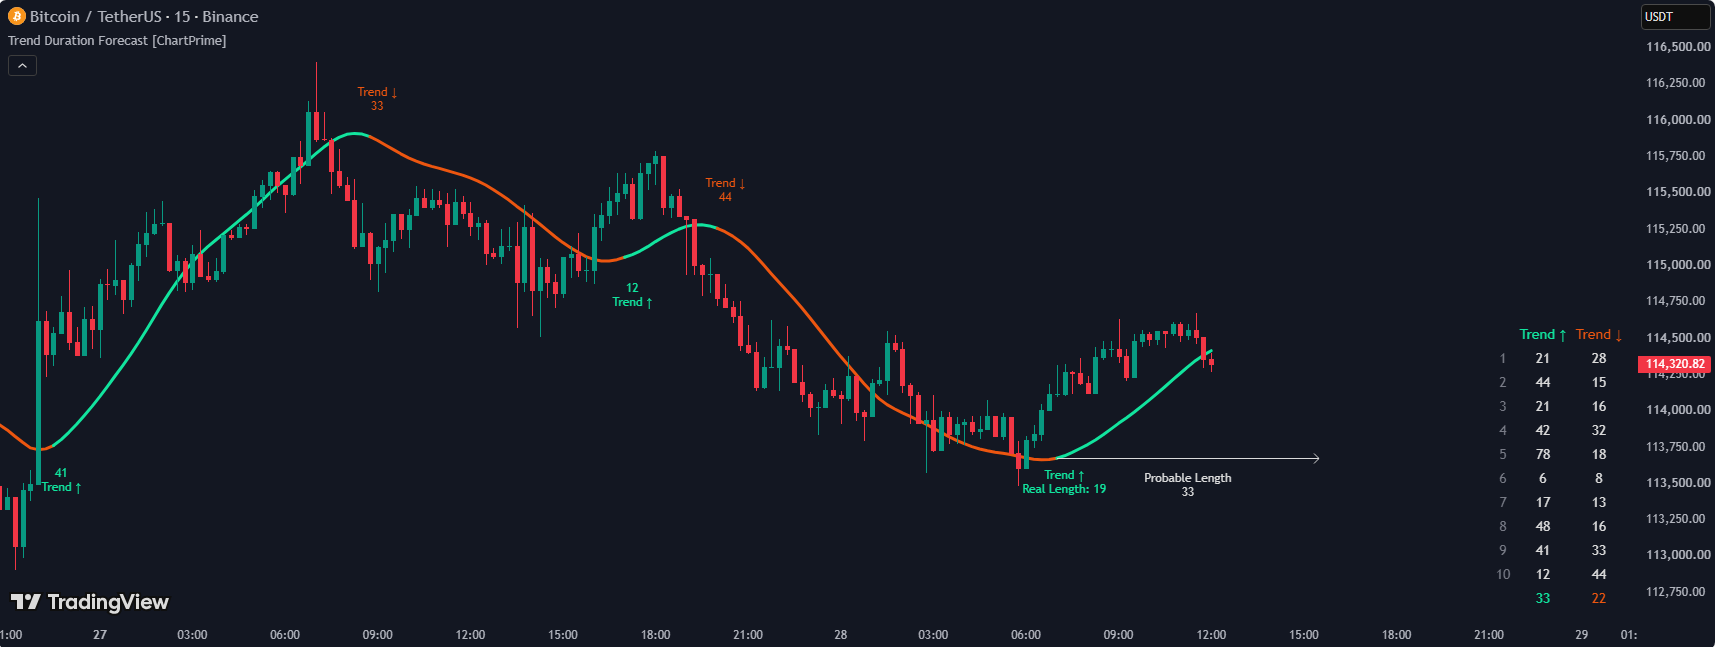
Chỉ báo Trend Duration Forecast trên chart TradingView (ảnh 1)

Trend Duration Forecast Indicator – Strategy

Trend Duration Forecast indicator: Determines trend direction from the slope of a Hull Moving Average. How it works, settings and strategy logic.
Read More »
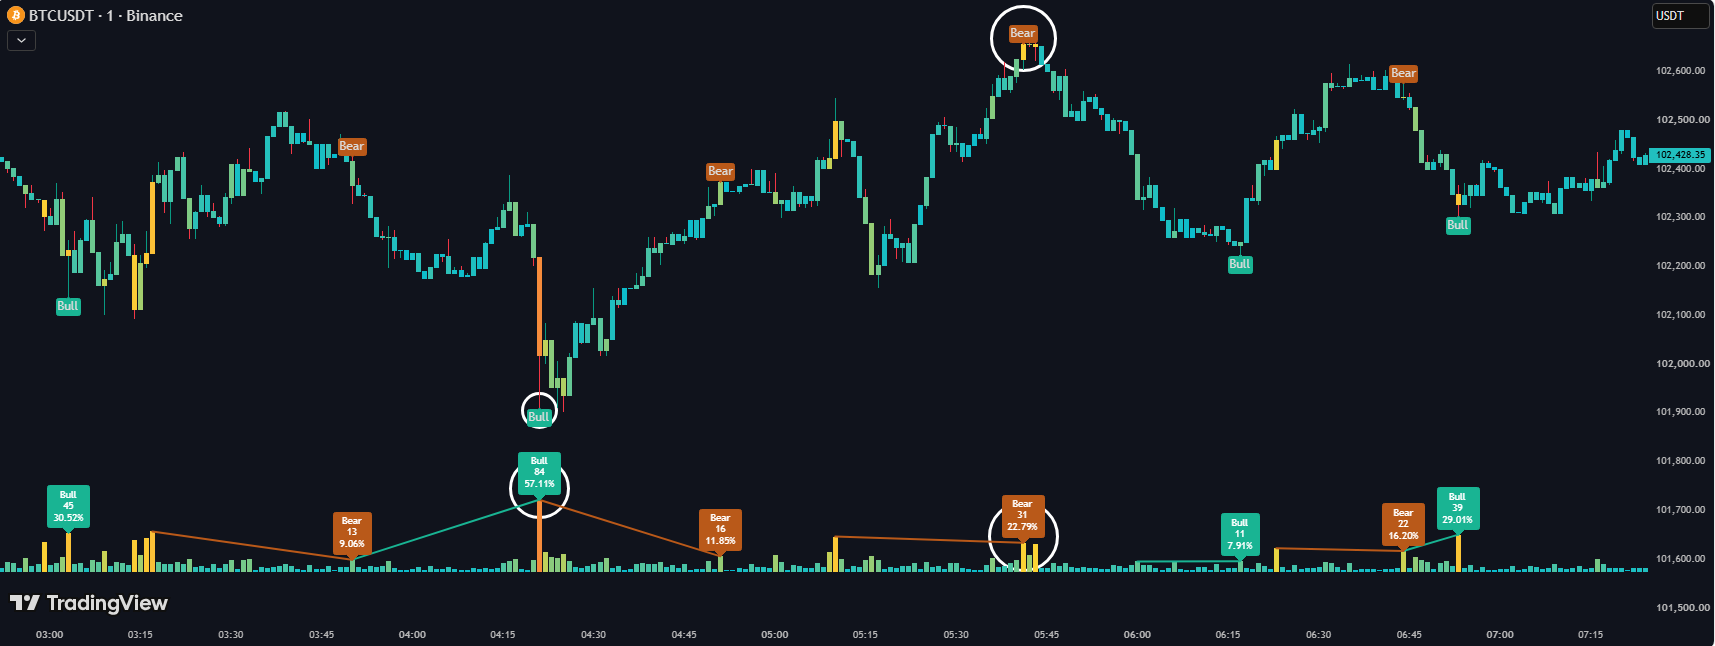
Chỉ báo Volume HeatMap Divergence trên chart TradingView (ảnh 1)

Volume HeatMap Divergence Indicator – Strategy

Volume HeatMap Divergence indicator: Draws volume as a percentile-colored “heatmap” directly on the price chart. How it works, settings and strategy logic.
Read More »
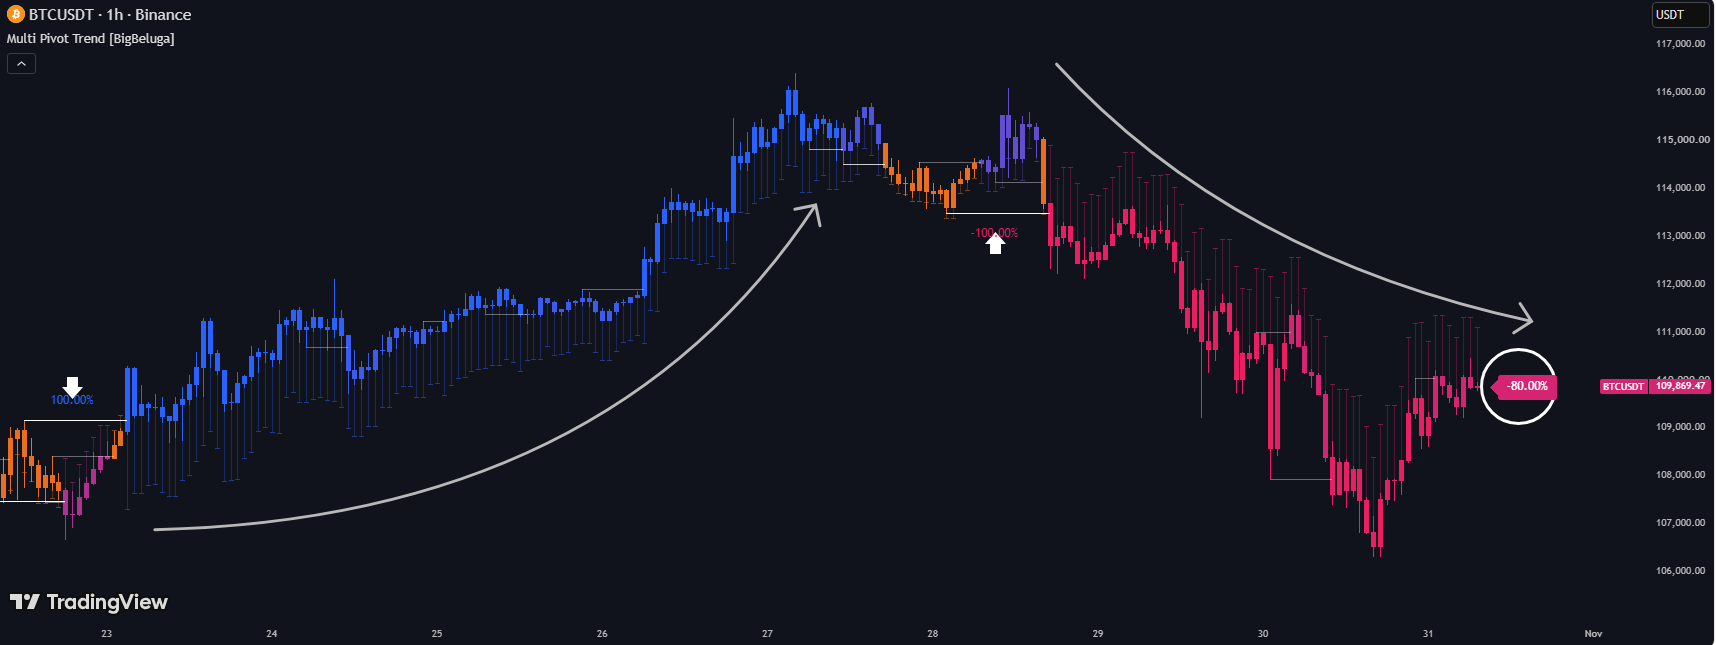
Chỉ báo Multi Pivot Trend trên chart TradingView (ảnh 2)

Multi Pivot Trend Indicator – Strategy

Multi Pivot Trend indicator: runs 10 breakout detectors in parallel with 10 pivot lengths and combines them into one trend signal. How it works and settings.
Read More »
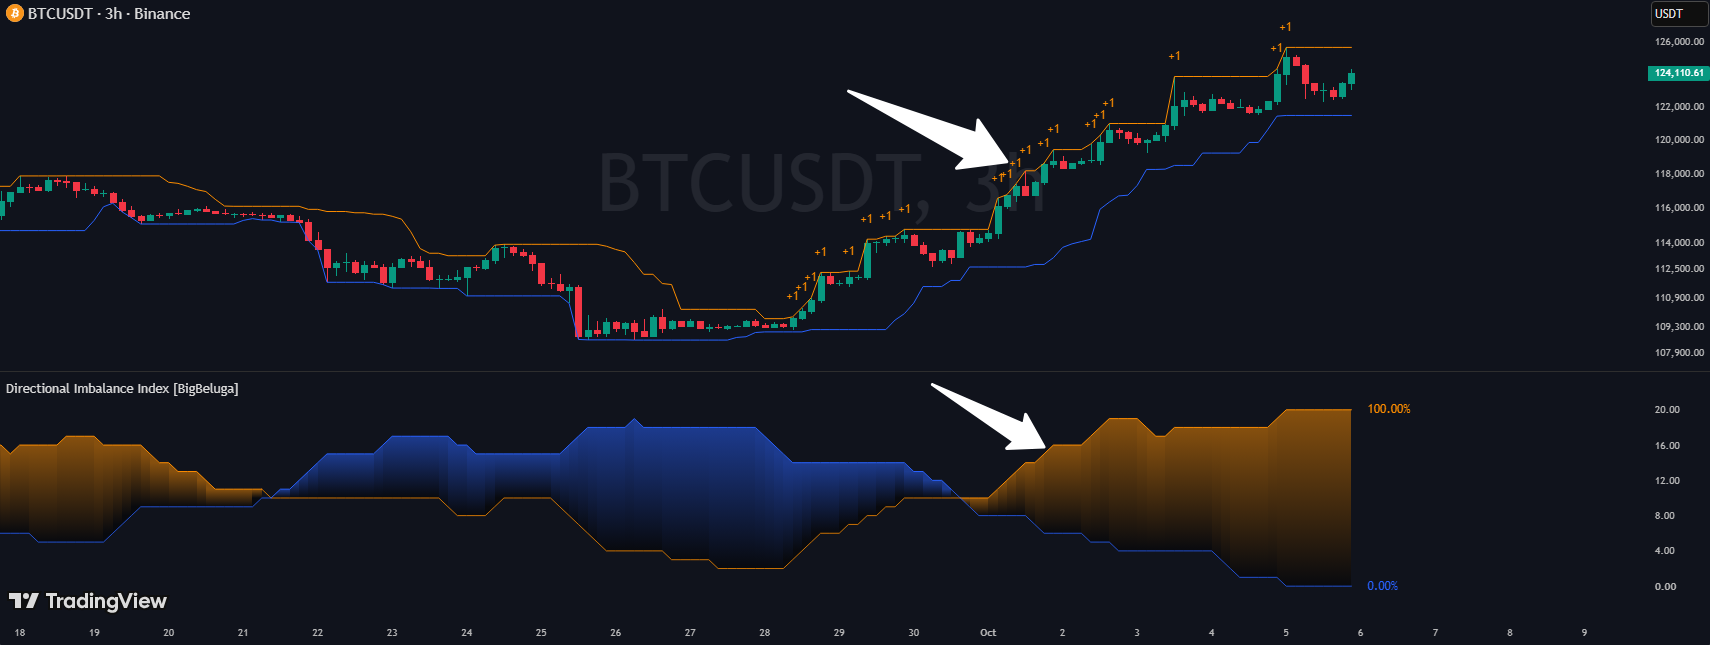
Chỉ báo Directional Imbalance Index trên chart TradingView (ảnh 3)

Directional Imbalance Index Indicator – Strategy

Directional Imbalance Index: counts how often price makes new rolling highs versus new lows to measure directional imbalance. How it works and settings.
Read More »
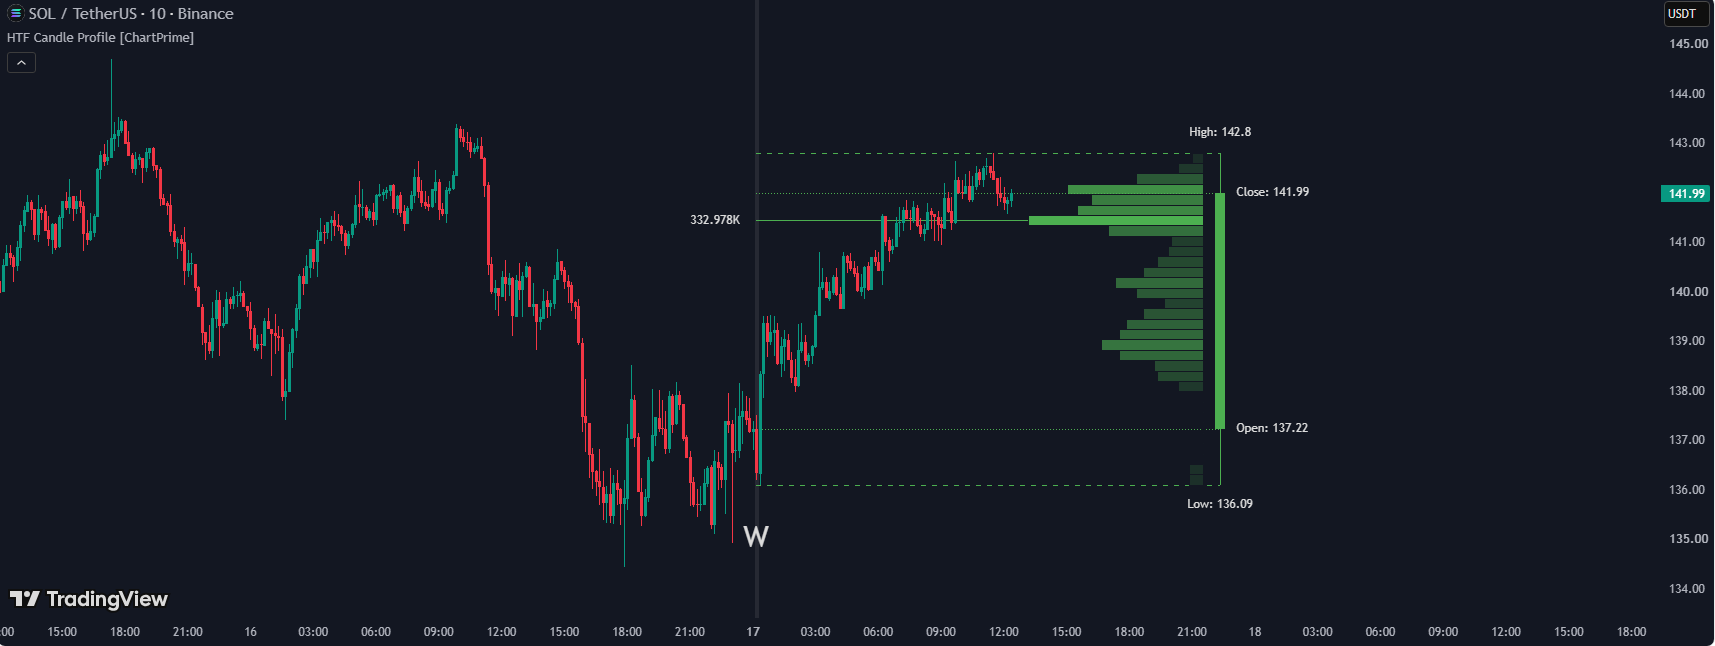
Chỉ báo HTF Candle Profile trên chart TradingView (ảnh 1)

HTF Candle Profile Indicator – Strategy

HTF Candle Profile indicator: builds a volume profile for the higher-timeframe candle currently forming. How it works, settings and strategy logic.
Read More »
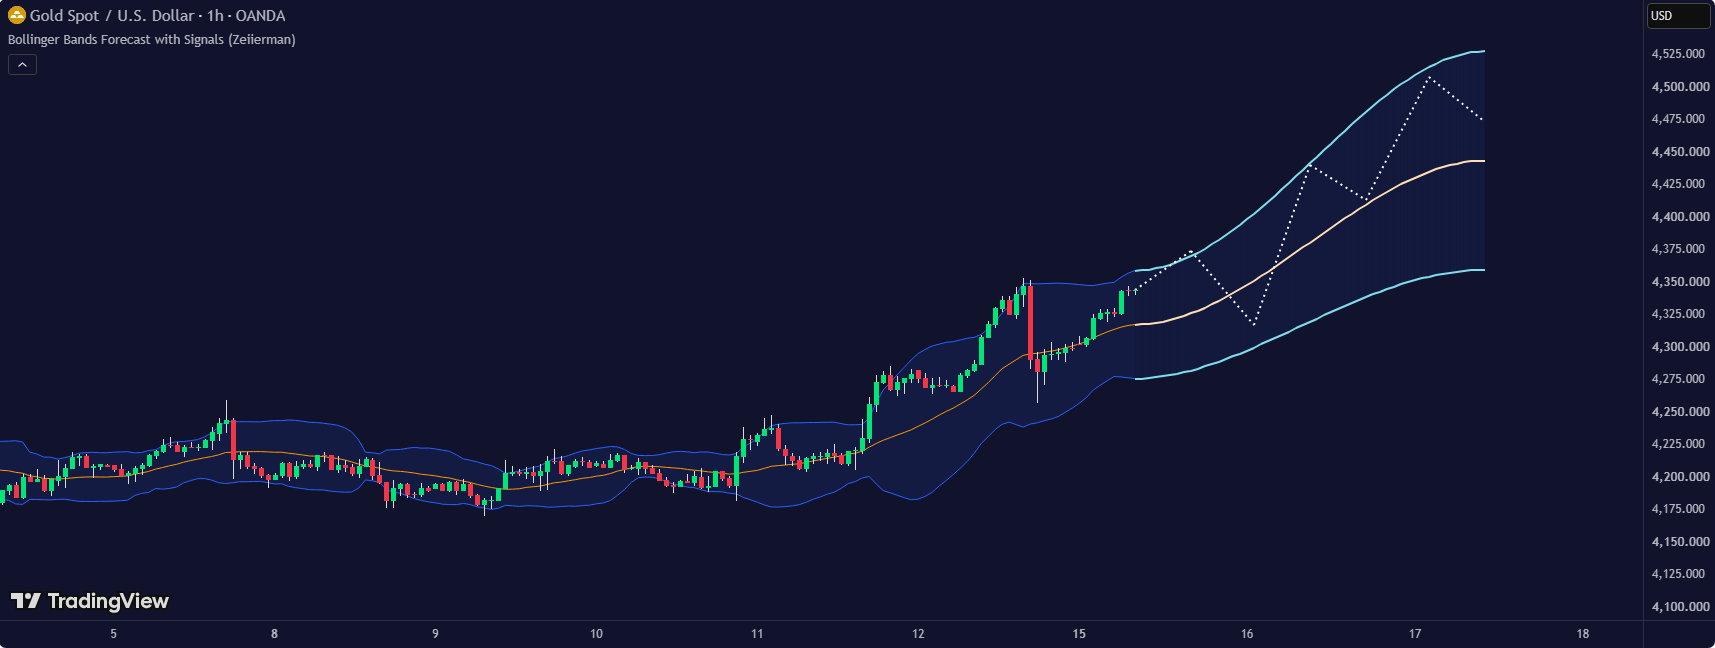
Chỉ báo Bollinger Bands Regression Forecast trên chart TradingView (ảnh 1)

Bollinger Bands Regression Forecast Indicator– Strategy

Bollinger Bands Regression Forecast Indicator– indicator for TradingView: how it works, settings, signals and strategy logic.

Read More »
Page1 Page2 Page3 Page4 Page5

Code 2 Trade

Facebook Twitter Youtube
Disclaimers

Risk Disclosure: Futures and forex trading contains substantial risk and is not for every investor. An investor could potentially lose all or more than the initial investment. Risk capital is money that can be lost without jeopardizing ones’ financial security or lifestyle. Only risk capital should be used for trading and only those with sufficient risk capital should consider trading. Past performance is not necessarily indicative of future results.


Hypothetical Performance Disclosure: Hypothetical performance results have many inherent limitations, some of which are described below. No representation is being made that any account will or is likely to achieve profits or losses similar to those shown; in fact, there are frequently sharp differences between hypothetical performance results and the actual results subsequently achieved by any particular trading program. One of the limitations of hypothetical performance results is that they are generally prepared with the benefit of hindsight. In addition, hypothetical trading does not involve financial risk, and no hypothetical trading record can completely account for the impact of financial risk of actual trading. for example, the ability to withstand losses or to adhere to a particular trading program in spite of trading losses are material points which can also adversely affect actual trading results. There are numerous other factors related to the markets in general or to the implementation of any specific trading program which cannot be fully accounted for in the preparation of hypothetical performance results and all which can adversely affect trading results.

Live Trade Room Disclosure:  This presentation is for educational purposes only and the opinions expressed are those of the presenter only. All trades presented should be considered hypothetical and should not be expected to be replicated in a live trading account. 


Testimonial Disclosure: Testimonials appearing on this website may not be representative of other clients or customers and is not a guarantee of future performance or success.